
Choosing the right engineering management platform is more critical than ever in 2026. This guide reviews the best alternatives to Jellyfish for engineering leaders, managers, and decision-makers who are seeking to optimize team performance, align engineering with business goals, and adapt to the rapidly evolving landscape of AI, developer experience, and workflow automation. With the increasing importance of actionable insights, real-time data, and seamless integration, selecting the right platform can directly impact your organization’s ability to deliver value, improve productivity, and stay competitive.
Jellyfish built its reputation as the pioneer engineering management platform. Since launching in 2017, the company has raised $114.5 million in funding from Accel, Insight Partners, and Tiger Global. Its core strength is aligning engineering work with business objectives, giving CFOs and VPs of Engineering a shared language around investment allocation, resource planning, engineering effort, and resource allocation—key aspects tracked by such platforms for effective capacity planning and workload management.
That positioning served enterprise buyers well for years. But the engineering intelligence category has shifted. AI coding tools are now standard across most teams. The 2025 DORA Report introduced new measurement frameworks. Developer experience has become a board-level priority. Today, aligning engineering activities with business goals and supporting business teams with actionable insights is critical for organizations seeking to optimize outcomes.
Platforms must now provide seamless integration with existing tools to enable real-time data aggregation, supporting new measurement frameworks and the growing focus on developer experience.
The question is no longer “Where is my engineering time going?” It is “How do I measure the real impact of AI tools on delivery, code quality, and developer experience, all at once?” Making data-driven decisions is now essential for evaluating the impact of engineering investments and driving continuous improvement.
If you are evaluating Jellyfish alternatives, you are likely dealing with one or more of these friction points.
Jellyfish is a capable platform for enterprise engineering management. It does several things well: investment allocation, capacity planning, R&D cost reporting, and executive dashboards. For organizations with deep Jira workflows and clean data hygiene, it provides solid visibility into where engineering time goes. Jellyfish focuses on quantitative metrics and tracking key metrics, offering dashboards and reports that help monitor team performance, but it may lack qualitative and tailored insights that provide a more complete understanding of engineering productivity.
But several patterns consistently push teams toward alternatives.
Pricing requires a sales conversation. Jellyfish does not publish pricing publicly. According to Vendr’s 2026 analysis, buyers with 50–150 engineering seats on annual contracts often see pricing in the range of $50,000–$120,000 per year. For mid-market teams with 50–200 engineers, that is a significant commitment before you have even seen the platform in action.
Setup and onboarding take time. Multiple competitor analyses and user reviews on G2 note that Jellyfish has a steep learning curve. Users report that training is vital to use the product well, and initial configuration can take weeks. Several G2 reviewers cite complex setup and the need for dedicated staff to manage the platform.
Heavy Jira dependency. Jellyfish treats Jira as its primary system of record. For teams using Linear, GitHub Issues, or hybrid setups, this Jira-centricity can become a constraint. As Faros AI’s analysis points out, Jellyfish’s approach can undercount engineering activities not tied to Jira issues. When only quantitative data is considered, technical debt and workflow bottlenecks can be overlooked, impacting long-term engineering efficiency.
Limited AI coding impact measurement until recently. Jellyfish launched AI Impact tracking in late 2024 and has expanded it since. However, many teams evaluating alternatives report needing deeper AI measurement: not just adoption tracking (who is using Copilot or Cursor), but actual impact on cycle time, code quality, and PR outcomes across AI-assisted versus non-AI PRs.
No automated code review. Jellyfish does not include a code review agent. If you want AI-powered code review alongside your engineering analytics, you need a separate tool or a platform that bundles both.
Customization gaps. G2 reviews consistently flag limited customization as a friction point. Of the top complaint themes, 21 mentions specifically call out lack of custom reporting flexibility, and 19 mentions note limited features and integration depth. Teams increasingly need comprehensive code insights and tailored insights to better understand team performance and address unique workflow challenges.
Many software teams struggle with the limitations of purely quantitative data, realizing it doesn't tell them how to improve or what's happening outside of platforms like Git and Jira, which can hinder actionable progress and slow development speed.
Before comparing specific platforms, it helps to know what separates a useful engineering intelligence tool from one that creates more dashboard fatigue. Here is what matters in 2026. Seamless integration with existing tools and customizable dashboards is essential for capturing real time data, enabling actionable insights, and supporting better decision-making across engineering teams.
Effective AI-powered workflow optimization requires tools that provide clear, actionable insights to highlight bottlenecks in the development process and offer specific recommendations for data-driven improvements. Seamless integration with existing tools is crucial for automatic data capture and improved decision-making.
Alternatives to Jellyfish, such as DX, LinearB, Swarmia, Haystack, Waydev, and Pluralsight Flow, address the main limitations of Jellyfish by offering a more comprehensive approach to engineering management. These platforms combine both qualitative and quantitative insights, allowing teams to track performance and identify bottlenecks more effectively. Platforms like Swarmia and Pluralsight Flow provide engineering teams with tools that focus on team dynamics and workflow optimization, which can be more beneficial than Jellyfish's top-down reporting approach. Jellyfish is often criticized for its limited customization and lack of focus on developer experience, which has led many teams to seek alternatives that offer better insights into daily challenges faced by developers. Additionally, alternatives like Haystack and Waydev emphasize real-time insights and proactive identification of bottlenecks, enhancing team productivity compared to Jellyfish's more rigid reporting structure.
When evaluating alternatives to Jellyfish, it's important to consider how some platforms position themselves as engineering effectiveness platforms—offering not just analytics, but comprehensive solutions for operational efficiency, code quality, and developer productivity. The table below compares seven alternatives across the capabilities that matter most for engineering leaders in 2026.
Notably, alternatives to Jellyfish such as DX and Typo AI combine both qualitative and quantitative insights, enabling teams to track performance and identify bottlenecks more effectively than platforms focused solely on high-level metrics.
Typo AI is an engineering effectiveness platform that combines SDLC visibility, AI coding tool impact measurement, automated AI code reviews, and developer experience surveys in a single product. It provides comprehensive code insights and tracks DORA and SPACE metrics to help teams optimize productivity, software health, and operational efficiency. Typo connects to GitHub, GitLab, Bitbucket, Jira, Linear, and CI/CD pipelines.
Where Typo differs from Jellyfish is scope and speed. Jellyfish focuses primarily on engineering-to-business alignment, investment allocation, and financial reporting. Typo starts from how work actually moves through the SDLC and layers in AI impact, code quality, and developer experience on top of that foundation, reflecting its broader mission to redefine engineering intelligence.
Key strengths:
Customer proof points:
Typo is a G2 Leader with 150+ reviews, trusted by 1,000+ engineering teams, and featured in Gartner’s Market Guide for Software Engineering Intelligence Platforms.
Best for: Engineering teams at mid-market SaaS companies (50–500 engineers) who need unified visibility across delivery, AI impact, code quality, and developer experience, without the enterprise pricing or multi-week onboarding—and who are evaluating why companies choose Typo for this use case.
LinearB focuses on engineering workflow automation, DORA metrics, and cycle time analytics. As an engineering analytics tool, it provides instant insights and workflow automation, delivering automated improvement actions like PR bots and alerts that help teams enforce working agreements around PR size, review turnaround, and merge frequency.
Where LinearB stands out: It is actionable at the team level. Instead of high-level allocation reporting, LinearB provides specific bottleneck identification, tracks key engineering metrics, and offers automated fixes. The free tier is generous for small teams, making it an accessible starting point.
Where it falls short versus Jellyfish alternatives: LinearB does not include native AI coding impact measurement. It does not offer automated code review. And it lacks DevEx survey capabilities. Teams who need to measure how AI tools affect delivery or who want code review bundled into their analytics platform will need to look elsewhere.
Best for: Engineering managers focused on process efficiency who want automated interventions in their development pipeline, particularly those starting with a free-tier budget. Alternatives like Haystack and Waydev emphasize real-time insights and proactive identification of bottlenecks, enhancing team productivity.
Swarmia combines DORA metrics with developer experience signals. It tracks cycle time, deployment frequency, and review throughput alongside “working agreements” that let teams set norms like PR size limits and review turnaround expectations. Swarmia helps development teams and software development teams track quality metrics and improve team's productivity by providing actionable insights and real-time analytics.
Where Swarmia stands out: Clean UX. Team-first approach. Positions itself explicitly as the “humane alternative to engineering surveillance,” which resonates with engineering leaders who care about developer experience as much as process metrics. The company raised €10 million in June 2025, signaling continued growth.
Where it falls short: No automated code review. Limited AI coding impact measurement. Limited customization for complex enterprise needs. G2 and Reddit discussions consistently cite feature depth as the primary gap compared to more comprehensive platforms.
Best for: Teams starting their metrics journey who want clean dashboards and team-first norms without enterprise complexity.
DX (formerly GetDX) is an engineering intelligence platform founded by the researchers who created the DORA, SPACE, and DevEx frameworks. It combines structured developer surveys with system metrics through its Data Cloud product to measure developer experience, productivity friction, and organizational health, while also measuring developer productivity and individual performance metrics. DX incorporates developer feedback as a qualitative element, ensuring that both quantitative data and direct input from developers are used to identify issues and suggest improvements.
Where DX stands out: Deep research pedigree. The DX Core 4 framework is becoming a standard reference in the DevEx space. No other tool has the same academic backing for its measurement methodology. DX leverages the SPACE framework (Satisfaction, Performance, Activity, Communication, Efficiency) to provide a holistic view of developer experience and productivity.
Where it falls short: DX is primarily a survey and sentiment platform. It incorporates self reported metrics from developers, which complements system-generated data, but does not include automated code review, native AI coding impact measurement, or deep SDLC analytics. If you need to see how work moves through your pipeline, diagnose PR bottlenecks, or track AI tool impact on cycle time, DX will not cover those use cases alone.
Best for: Organizations investing heavily in developer experience improvement and platform engineering who want the most rigorous DevEx measurement methodology available.
Haystack is a lightweight engineering analytics platform focused on DORA metrics, delivery visibility, and team health. It targets teams that want engineering metrics without the complexity of enterprise platforms, while providing real time data and real time visibility for distributed teams and software teams.
Where Haystack stands out: Quick setup, transparent pricing, and a focused feature set that does not overwhelm smaller teams. For engineering managers overseeing 5–50 developers who need basic delivery visibility, Haystack provides fast time-to-value.
Where it falls short: No AI coding impact measurement. No automated code review. No DevEx surveys. As teams scale past 50–100 engineers or need to measure AI tool ROI, Haystack’s feature set may not keep pace.
Best for: Small-to-mid engineering teams (under 50 developers) who want straightforward delivery metrics without enterprise complexity or pricing.
Waydev is an engineering intelligence platform that uses DORA metrics, the SPACE framework, developer experience insights, and AI capabilities to provide delivery analytics. It automatically tracks work from Git activity, visualizes project timelines, and includes basic code review workflow features, while also offering detailed analytics on pull requests and the entire development lifecycle.
Where Waydev stands out: Automated work logs from Git activity eliminate manual entry. Project timeline visualization gives clear progress views. Sprint planning integration supports agile workflows. Waydev also supports the software delivery process by providing engineering insights that help teams optimize performance and identify bottlenecks.
Where it falls short: AI coding impact measurement is limited. Code review capabilities are basic compared to dedicated AI code review tools. DevEx survey depth does not match platforms like DX or Typo.
Best for: Teams that want Git-level activity analytics with automated work tracking and sprint planning support.
Pluralsight Flow (formerly GitPrime) tracks coding activity: commits, lines of code, code churn, and review patterns. It was acquired by Appfire from Pluralsight in February 2025 and now operates as a standalone product within the Appfire ecosystem alongside BigPicture PPM and 7pace Timetracker. Flow also enables tracking of individual performance and individual performance metrics, providing visibility into productivity metrics and key metrics for both teams and developers—similar to platforms like Code Climate Velocity.
Where Flow stands out: Mature Git activity analytics with ML-powered insights. The Appfire ecosystem positions it alongside project management tools. For organizations already invested in Pluralsight for developer training, Flow provides natural synergy.
Where it falls short: No AI coding impact measurement. No automated code review. No DevEx surveys. No manager productivity agents. The platform focuses on Git-level patterns rather than full SDLC visibility, and it does not cover sprint analytics, deployment metrics, or incident tracking.
Best for: Large organizations that want mature Git analytics and are already invested in the Appfire or Pluralsight ecosystem.
The right platform depends on what gap Jellyfish is not filling for your team. Here is a framework for making the decision. For engineering organizations, leveraging data-driven approaches and data-driven insights is essential—these enable leaders to make informed decisions, optimize workflows, and align engineering efforts with strategic goals.
If your primary need is measuring AI coding tool impact: Typo is the strongest option for improving developer productivity with AI intelligence. It natively tracks GitHub Copilot, Cursor, Claude Code, and CodeWhisperer, and compares AI-assisted versus non-AI PR outcomes on cycle time, quality, and developer experience. Jellyfish added AI Impact tracking recently, but Typo’s approach measures verified impact, not just adoption.
If you need automated code review bundled with analytics: Typo is the only platform on this list that includes a context-aware AI code review agent alongside SDLC analytics, AI impact measurement, and DevEx surveys. Every other alternative requires a separate code review tool. Typo also supports engineering productivity and team efficiency by surfacing actionable metrics and workflow bottlenecks.
If your primary need is developer experience measurement: DX offers the deepest research-backed methodology. Typo offers DevEx surveys combined with delivery analytics and AI impact in one platform. The tradeoff is depth of DevEx research (DX) versus breadth of the platform (Typo).
If budget is your primary constraint: LinearB’s free tier or Swarmia’s transparent pricing provide accessible starting points. Typo also offers flexible plans and a self-serve free trial with no sales call required.
If you need enterprise finance alignment: Jellyfish may still be the right choice. Its investment allocation, R&D capitalization, and DevFinOps features are designed for CFO-level conversations. Jellyfish stands out for tracking engineering investments and aligning them with business outcomes. No alternative on this list matches Jellyfish’s depth in financial engineering reporting.
The 2025 DORA Report found that 90% of developers now use AI coding tools. But the report also found that AI amplifies existing practices rather than fixing broken ones. Teams with poor DORA baselines do not improve with AI. They accelerate their dysfunction.
This creates a measurement problem. Most organizations track AI tool adoption through license counts. They know how many seats are active. They do not know whether those tools are actually improving delivery speed, code quality, or developer experience. Tracking engineering effort and resource allocation is essential for understanding the true impact of AI tools, as it reveals how team resources are distributed and whether productivity gains are realized.
That gap is why AI coding impact measurement has become the defining capability in the engineering intelligence category. It is not enough to know that 80% of your team uses Copilot. You need to know whether AI-assisted PRs merge faster, introduce more rework, or create code quality issues that show up downstream—while also optimizing the development process and engineering processes for improved developer productivity and addressing technical debt.
Platforms that can answer that question, with verified data from your actual engineering workflow, are the ones worth evaluating.
Jellyfish built a strong foundation in the engineering management space. For enterprise teams that need deep investment allocation, R&D capitalization, and finance alignment, it remains a capable option.
But the category has evolved. AI coding tools have changed what engineering leaders need to measure. Developer experience has become a board-level priority. The importance of software delivery, team collaboration, and operational efficiency has grown as organizations seek platforms that optimize the entire development lifecycle. And the bar for setup speed and pricing transparency has risen.
If you are looking for a platform that covers SDLC visibility, AI coding impact measurement, automated code reviews, and developer experience in a single product, with a setup that takes 60 seconds instead of 60 days, Typo is worth evaluating.
What is Jellyfish used for?
Jellyfish is an engineering management platform that aligns engineering work with business objectives. It provides visibility into investment allocation, resource planning, R&D capitalization, and delivery metrics. It integrates with Jira, GitHub, GitLab, and other development tools.
How much does Jellyfish cost?
Jellyfish does not publish pricing publicly. Based on Vendr’s 2026 market data, annual contracts for 50–150 engineering seats typically range from $50,000 to $120,000, depending on modules, integrations, and contract terms.
What are the main limitations of Jellyfish?
Common friction points reported by users include: steep learning curve and complex initial setup, heavy dependency on Jira data quality, no automated AI code review capability, limited custom reporting flexibility, lack of customizable dashboards, limited tracking of quality metrics, and opaque pricing that requires a sales conversation.
Does Jellyfish measure AI coding tool impact?
Jellyfish added AI Impact tracking in late 2024, which measures AI tool adoption and usage across coding assistants like GitHub Copilot and Cursor. However, other engineering analytics tools provide more granular analysis of pull requests and quality metrics, enabling deeper AI-vs-non-AI PR comparison at the delivery impact level. Platforms like Typo provide more granular measurement.
What is the best Jellyfish alternative for mid-market teams?
For mid-market engineering teams (50–500 engineers) that need unified SDLC visibility, AI coding impact measurement, automated code review, and DevEx surveys in a single platform, Typo offers the most comprehensive coverage with the fastest setup (60 seconds) and self-serve pricing.

GitHub Copilot, Cursor, and Claude Code represent the three dominant paradigms in AI coding tools for 2026, each addressing fundamentally different engineering workflow needs. With 85% of developers now using AI tools regularly and engineering leaders actively comparing options in ChatGPT and Claude conversations, choosing the right ai coding assistant has become a strategic decision with measurable impact on delivery speed and code quality.
This guide covers performance benchmarks, pricing analysis, enterprise readiness, and measurable productivity impact specifically for engineering teams of 20-500 developers. It falls outside our scope to address hobbyist use cases or tools beyond these three leaders. The target audience is engineering managers, VPs of Engineering, and technical leads who need data-driven comparisons rather than developer preference debates.
The direct answer: GitHub Copilot excels at IDE integration and enterprise governance with 20M+ users and Fortune 100 adoption. Cursor leads in flow state maintenance and multi file editing for small-to-medium tasks. Claude Code dominates complex reasoning and architecture changes with its 1M token context window and 80.8% SWE-bench score.
By the end of this comparison, you will:
While these three tools boost individual productivity, measuring their actual impact on delivery speed and code quality requires dedicated engineering intelligence platforms that track AI-influenced outcomes across your entire codebase.
The 2026 landscape of ai coding tools has crystallized into three distinct approaches: IDE-integrated completion tools that augment familiar interfaces, AI-native editing environments that reimagine the development workflow entirely, and terminal-based autonomous agents that execute complex tasks independently. Understanding these categories is essential because each addresses different engineering bottlenecks.
IDE-integrated tools like GitHub Copilot work within your existing development environment. GitHub Copilot is an extension that works across multiple IDEs, providing the only tool among the three that supports a wide range of editors without requiring a switch. Developers keep their familiar interface, existing extensions, and muscle memory while gaining inline suggestions and chat capabilities. This approach minimizes change management friction and enables gradual adoption across teams using VS Code, JetBrains, or Neovim.
Standalone solutions like Cursor require switching development environments entirely. Cursor is a standalone IDE built as a VS Code fork with AI integrated into every workflow, making it a complete editor redesigned around AI-assisted development. As a vs code fork, Cursor maintains familiarity but demands that teams switch editors and migrate configurations. This tradeoff delivers deeper AI integration at the cost of adoption friction. Enterprise teams often find IDE-integrated approaches easier to roll out, while power users willing to embrace change may prefer the cohesion of AI-native environments.
Code completion tools focus on high-frequency, low-friction suggestions. You write code, and the ai generated code appears inline, accepted with a single keystroke. This approach optimizes for flow state and immediate productivity on the current file.
Autonomous coding through agent mode takes a fundamentally different approach. You describe a task in natural language descriptions, and the terminal agent executes multi step tasks across multiple files, potentially generating entire features or refactoring existing codebases. Claude Code is a terminal-based AI coding agent that autonomously writes, refactors, debugs, and deploys code, providing a unique approach compared to IDE-integrated tools. Claude Code leads this category, achieving higher solve rates on complex problems but requiring developers to adapt to conversational coding workflows.
The choice between approaches depends on your primary bottleneck. If developers spend most time on incremental coding, autocomplete delivers immediate time saved. If architectural changes, debugging intermittent issues, or navigating very large codebases consume significant cycles, autonomous agents provide greater leverage.
Building on these foundational distinctions, each tool demonstrates specific capabilities and measurable impact that matter for engineering teams evaluating options.
GitHub Copilot serves over 20 million developers and has become the Fortune 100 standard for ai assisted development. Its deep integration with the github ecosystem provides seamless workflow integration from code completion through pull request review.
Core strengths: Cross-IDE support spans visual studio, VS Code, JetBrains, Neovim, and CLI tools. Enterprise compliance features include SOC 2 certification, IP indemnification, and organizational policy controls. The Business tier ($19/user/month) provides admin controls and 300 premium requests monthly; Enterprise ($39/user/month) adds repository indexing, custom fine-tuned models (beta), and 1,000 premium requests.
Measurable impact: Best for enterprise teams needing consistent autocomplete across diverse development environments. Studies show inline suggestion acceptance rates of 35-40% without further editing. Agent mode and code review features enable multi file changes, though not as autonomously as Claude Code.
Key limitations: The context window presents the most significant constraint. While GPT-5.4 theoretically supports ~400,000 tokens, users report practical limits around 128-200K tokens with early summarization. For complex tasks spanning multiple files or requiring deep understanding of existing codebase, this limitation affects output quality.
Cursor positions itself as the ai coding tool for developers who want AI woven into every aspect of their workflow. Cursor is a standalone IDE built as a VS Code fork with AI integrated into every workflow, making it a complete editor redesigned around AI-assisted development. As a standalone ide based on a code fork of VS Code, it attracts over 1 million users seeking deeper integration than plugin-based approaches.
Core strengths: Composer mode enables multi file editing with context awareness across your entire project. Background cloud agents handle complex refactoring while you work on other tasks. Supermaven autocomplete achieves approximately 72% acceptance rates in benchmarks, significantly higher than alternatives for simple completions.
Measurable impact: Cursor completes SWE-bench tasks approximately 30% faster than Copilot for small-to-medium complexity work. First-pass correctness reaches ~73% overall, with ~42-45% of inline suggestions accepted without further editing. The tool excels at maintaining flow state, staying out of the way until needed.
Key limitations: Requires teams to switch editors, creating adoption friction. Token-based pricing through cursor pro can become unpredictable for heavy usage limits. On hard tasks, correctness drops to ~54% compared to Claude Code’s ~68%. The underlying model determines actual capabilities, making performance variable depending on configuration.
Claude Code operates as a terminal agent optimized for autonomous coding on complex tasks. Claude Code is a terminal-based AI coding agent that autonomously writes, refactors, debugs, and deploys code, providing a unique approach compared to IDE-integrated tools. Its 200K standard context window (up to 1M in enterprise/beta tiers) enables reasoning across entire codebases that would overwhelm other tools.
Core strengths: The largest context window available enables architectural changes, legacy system navigation, and debugging intermittent issues that require understanding thousands of files simultaneously. Agent teams enable parallel workflows. The 80.8% SWE-bench Verified score demonstrates superior performance on complex problems. VS Code and JetBrains extensions add claude code to existing workflows for those who prefer IDE integration.
Measurable impact: Claude code leads on first-pass correctness at ~78% overall, reaching ~68% on hard tasks versus Cursor’s ~54%. Pull request acceptance rates show 92.3% for documentation tasks and 72.6% for new features. Complex refactoring executes approximately 18% faster than Cursor.
Key limitations: Terminal-only primary interface requires learning curve for developers accustomed to IDE-centric workflows. Usage based pricing for extended context can become expensive for teams regularly using 1M-token sessions. Performance degrades around 147-150K tokens before auto-compaction triggers, requiring prompt engineering to manage context effectively.
Interpreting benchmark data requires understanding that synthetic benchmarks don’t directly translate to productivity gains in your specific codebase and workflow patterns.
SWE-bench Verified measures complex correctness on real-world code tasks. Claude Code (Opus 4.5) achieves ~80.9%, Cursor ~48%, and Copilot ~55% in comparable benchmark sets. These differences become more pronounced on hard tasks requiring multi step problems across multiple files.
HumanEval and MBPP test function-level code generation. Claude Opus 4.6 reaches ~65.4% on Terminal-Bench 2.0; Cursor’s newer Composer variants achieve ~61-62%. These benchmarks better predict inline suggestion quality than autonomous task completion.
Real-world accuracy patterns:
Interpretation guidance: Benchmark scores indicate ceiling performance under controlled conditions. Actual productivity impact depends on task distribution, codebase characteristics, and how well the tool matches your workflow patterns.
Synthesis:
Direct licensing costs:
Team cost scenarios:
Hidden costs matter:
Teams using cli tools extensively may find Claude Code’s terminal agent more accessible option despite the learning curve.
Developer resistance challenge: Teams using VS Code or JetBrains resist switching to Cursor’s standalone ide, even though it’s a vs code fork with a familiar interface. Exporting configurations, adjusting plugin sets, and changing muscle memory creates friction that individual developers often avoid.
Solution:
Code privacy challenge: All three tools process code through external ai models, raising IP protection concerns. Different tools offer different guarantees about data retention and model training.
Solution:
The brutal truth: These tools report adoption metrics—suggestions accepted, completions generated, features used—but none tell you their actual impact on your DORA metrics. License adoption doesn’t equal delivery speed improvement.
Solution:
Specific measurement approaches (pros and cons of relying on DORA alone):
Tool choice depends on team size, existing IDE preferences, and the complexity distribution of your codebase work. GitHub copilot vs cursor vs claude code isn’t a simple “best tool” question—it’s a workflow fit question requiring measurement to answer definitively.
The game changer isn’t choosing the right answer among these other tools—it’s implementing measurement infrastructure to track actual engineering impact rather than license deployment counts. Without that measurement, you’re guessing at ROI rather than proving it.
Related topics worth exploring: AI-assisted coding impact and best practices, engineering intelligence platforms for DORA metrics tracking, AI code review automation, and hybrid tool strategies for different tasks across your organization.
Which AI coding tool has the best ROI for engineering teams?
ROI depends on three factors: team size, codebase complexity, and measurement infrastructure. For enterprise teams prioritizing governance and minimal disruption, GitHub Copilot typically delivers fastest time-to-value. For teams doing heavy refactoring, Cursor’s multi-file capabilities justify the IDE migration cost. For complex architectures or legacy systems, Claude Code’s context window provides unique capabilities. Without measuring actual DORA metric impact, ROI claims remain speculative.
Can you use multiple AI coding tools together effectively?
Yes, hybrid approaches are increasingly common. Many teams use GitHub Copilot for daily inline suggestions, Cursor for complex refactoring sessions, and add claude code for architectural analysis or debugging multi step problems. The key is matching each tool to specific task types rather than forcing single-tool standardization, drawing on broader AI coding assistant evaluations and developer productivity tooling strategies.
How do you measure if AI coding tools are actually improving delivery speed?
Focus on DORA metrics: deployment frequency, lead time for changes, change failure rate, and mean time to recovery. Track these metrics before AI tool adoption, then measure changes over 30-90 day periods. Compare PR cycle times for AI-influenced commits versus non-AI commits. Engineering intelligence platforms like Typo provide this measurement across all three tools, and resources such as a downloadable DORA metrics guide can help structure your approach.
Which tool is best for teams using legacy codebases?
Claude Code’s 1M token context window makes it uniquely capable of reasoning across very large codebases without losing context. It can analyze entire codebases that would exceed other tools’ limits. For legacy systems requiring understanding of interconnected components across hundreds of files, this context advantage is significant.
What’s the difference between AI code completion and autonomous coding?
Code completion provides inline suggestions as you write code—high frequency, immediate, minimal disruption. Autonomous coding executes entire tasks from plain language descriptions, making multi file changes, generating api endpoints, or refactoring components. Completion optimizes flow state for solo developer work; autonomous agents leverage AI for complex tasks that would otherwise require hours of manual effort.
How do enterprise security requirements affect tool choice?
GitHub Copilot Enterprise offers the most comprehensive compliance features: SOC 2 certification, IP indemnification, organizational policy controls, and explicit guarantees about code not being used for model training. Cursor’s enterprise features are less publicly documented. Claude Enterprise offers compliance plans but terminal-based workflows may require additional security review. Response cancel respond policies and data retention terms vary by tier—evaluate enterprise agreements carefully.
PR cycle time measures the duration from pull request creation to merge into the main branch—and it’s the most actionable metric engineering leaders can move quickly. Code review cycle time, specifically, is the period from when a pull request is submitted until it is merged, serving as a critical indicator of development velocity and team collaboration efficiency. Elite teams achieve total cycle times under 24 hours, while median performers take 2-5 days. That gap represents days of delayed features, slower feedback loops, and compounding context switching costs across your entire development pipeline. High code review cycle times often indicate communication gaps, unclear requirements, or overburdened reviewers, while consistently low cycle times suggest efficient collaboration and well-defined review processes.
This guide covers how to measure PR cycle time components, break down the different phases of the cycle, interpret benchmarks for your team size, diagnose root causes of delays, and implement proven reduction strategies. As an essential part of DORA metrics for engineering performance, understanding PR cycle time is crucial for evaluating engineering team performance and efficiency and for appreciating why PR cycle time is often a better metric than velocity. The target audience is engineering managers, VPs of Engineering, and team leads managing 5-50 developers who want to accelerate their software development process without sacrificing code quality.
The short answer: Reduce PR cycle time through smaller PRs (< 200 lines), automated triage and reviewer assignment, clear code ownership, and AI-powered pre-screening that catches issues before human reviewers engage. Keeping pull requests small and manageable is key—research shows that PRs with over 200 changes often deter reviewers, while smaller PRs lead to quicker, more effective code reviews.
By the end of this guide, you will:
PR cycle time, often referred to as code review cycle time, is the total elapsed time from when a pull request is opened until it successfully merges into the main branch. This key metric measures the duration of the code review process and is central to DORA’s Lead Time for Changes—one of the four key metrics that distinguish elite engineering organizations from average performers. Understanding cycle time vs lead time within DORA metrics clarifies how PR cycle time fits into broader delivery performance. Code review cycle time can be broken down into different phases, such as initial development, waiting time, and review, to pinpoint where delays occur and optimize each segment for efficiency.
Understanding cycle time requires breaking it into these distinct phases, because the interventions for each are different. Tracking other pull request metrics—like PR Pickup Time and PR size—alongside PR review time and overall cycle time helps teams identify bottlenecks and target improvements more effectively. A team with high PR pickup time needs different solutions than one with slow merge times. High cycle time is often a sign of inefficiency and can indicate hidden problems within the workflow. Shorter PR cycle times usually indicate smoother workflows, while longer cycle times often signal hidden problems such as unclear ownership or overloaded reviewers.
PR pickup time measures the duration from PR creation until the first reviewer begins reviewing. This is the waiting period where new code sits idle, and it typically dominates overall cycle time.
In an analysis of 117,413 reviewed pull requests, median pickup time was approximately 0.6 hours—but the P90 (slowest 10%) reached 128.9 hours. That’s over five days of waiting before anyone even looks at the code change.
High PR pickup time correlates directly with reviewer availability, team awareness of pending reviews, and lack of automated assignment. When it’s unclear who should review a PR, developers passively wait for someone else to pick it up. Ensuring the team is promptly notified when a PR exists is essential to avoid unnecessary delays and keep the workflow moving.
Managing review requests and making sure PRs are reviewed in a timely manner is crucial for reducing pickup time. Dashboards that track pending review requests and highlight bottlenecks can help teams respond faster and improve overall PR cycle time.
Review time covers the active period from first review through final approval. This includes reading code, providing feedback, waiting for author responses, and iterating through review rounds. Code reviews are an essential process for maintaining code quality and delivery speed, but complex PRs can significantly increase review time due to the additional effort required to understand and assess them.
Key factors affecting review duration include pull request size, code complexity, and reviewer experience with the codebase. Large pull requests take exponentially longer—not just because there’s more code, but because reviewers defer them, requiring more context switching when they finally engage. Common causes of long PR cycle times include large pull requests, unclear ownership, and overloaded reviewers, which can create bottlenecks in the review process.
The tradeoff between review depth and speed is real. Teams must decide how much scrutiny different types of changes warrant. A one-line configuration fix shouldn’t require the same review process as complex changes to core business logic.
Merge time is the interval from final approval to actual merge into the main branch. This phase is often overlooked, but in the same GitHub dataset, P90 merge delay reached 19.6 hours.
Technical factors driving merge time include CI/CD pipeline duration, merge conflicts with other branches, required compliance checks, and branch policies that restrict merge windows. Teams with long-running test suites or manual deployment gates see this phase balloon.
Understanding each component matters because you can’t fix what you don’t measure. A team might assume review quality is the problem when actually their developers are waiting days for the first comment. The next section establishes benchmarks so you can identify where your team falls.
Industry benchmarks provide context for your team’s performance, but they require interpretation based on your specific situation. Metrics like code review cycle time and other pull request metrics—such as PR Pickup Time, overall cycle time, and PR size—are important benchmarks for assessing team performance and identifying bottlenecks in your workflow, especially when you follow the dos and don'ts of using DORA metrics effectively. A 24-hour cycle time means something different for a 5-person startup versus a 50-person team in regulated fintech. Frequent measurement of key performance indicators (KPIs) helps teams understand which strategies are effective in reducing PR cycle time and optimizing development velocity.
Based on aggregated data from DORA reports, Typo and CodePulse research, code review cycle time benchmarks break down as follows:
For teams of 5-50 engineers specifically: elite performers achieve under 12-24 hours total code review cycle time, with first review happening within four hours during business hours.
The median reviewed PR on public GitHub takes approximately 3 hours total—but P90 reaches 149 hours. That spread indicates most PRs move quickly, but a significant tail of delayed reviews drags down team velocity.
Effective measurement requires tracking each phase separately rather than just total duration. Breaking down the process into different phases enables more targeted improvements:
Tracking other pull request metrics such as PR Pickup Time and PR size alongside these phases provides additional insight into where delays or inefficiencies occur in the pull request process.
Consider business hours versus calendar time. An 18-hour cycle time that spans overnight isn’t the same as 18 hours during working hours. Some tools normalize for this; others require manual interpretation.
Typo surfaces real-time PR analytics that break down these components automatically, helping engineering leaders identify bottlenecks without manual data collection. The platform tracks cycle time trends across teams and repos, flagging when metrics drift outside acceptable ranges and making it easier to track and improve DORA metrics across your SDLC.
Benchmarks shift based on team composition and business context:
Small teams (5-10 engineers): Expect shorter cycle times due to higher code familiarity and simpler coordination. Target <4 hours for elite performance.
Medium teams (10-50 engineers): Coordination overhead increases. Target <24 hours for strong performance. Cross-team reviews and code ownership complexity require explicit processes.
Regulated industries: Compliance requirements, security reviews, and audit trails legitimately extend cycle time. Focus on reducing variance and eliminating unnecessary delays rather than hitting startup-speed benchmarks.
High-risk code changes: Critical paths warrant thorough review despite longer cycle times. The goal isn’t uniform speed—it’s appropriate speed for each type of change.
With benchmarks established, the next section covers specific interventions proven to reduce cycle time.
These strategies come from teams that have achieved measurable improvements—not theoretical best practices. Setting WIP limits and actively managing review PRs are proven methods to reduce PR cycle time, as they help prevent bottlenecks and maintain a steady workflow. Each intervention addresses specific phases of the PR cycle and includes implementation guidance. Effective PR teams can save up to 40% of their time by streamlining processes and eliminating bottlenecks through structured workflows.
Pull request size is the single strongest predictor of cycle time. Typo data shows small PRs get picked up 20× faster than large ones. The relationship is exponential, not linear. Complex PRs—those with many files changed or large code diffs—tend to slow down reviews, increase the risk of bugs, and create bottlenecks for both authors and reviewers.
Implementation steps:
For example, a team working on a major refactor initially submitted a single complex PR with over 1,000 lines changed. Reviewers hesitated to pick it up, and the PR sat idle for days. After splitting the work into five smaller PRs, each focused on a specific module, reviews were completed within hours, and feedback was more actionable.
Smaller PRs benefit everyone: authors get faster feedback, reviewers maintain focus without context switching overload, and the team catches issues earlier in the development process. Keeping pull requests small and manageable significantly enhances the likelihood of timely reviews, as large or complex PRs often deter reviewers and delay progress.
When it’s unclear who should review a PR, it sits in limbo. Automated assignment eliminates this ambiguity and ensures that every team member is promptly notified when a PR exists, reducing the risk of overlooked or stalled pull requests. Managing review requests effectively—by tracking pickup times and monitoring pending review requests—helps teams identify bottlenecks and maintain steady progress.
Implementation steps:
Clear expectations around response times eliminate ambiguity and ensure reviews and merges are completed in a timely manner, which is essential for maintaining workflow efficiency and reducing waiting.
Supporting practices:
Async norms work because they remove negotiation overhead. Reviewers know what’s expected; authors know when to escalate, helping the team consistently complete reviews and merges in a timely manner.
AI-powered pre-screening represents the largest recent advancement in reducing cycle time. These tools act as a first reviewer, catching issues before human reviewers engage and transforming how AI is used in the code review process.
Atlassian’s internal deployment of their AI code review agent reduced PR cycle time by approximately 45%. Their median time from open to merge had crept above 3 days, with pickup waits averaging 18 hours. After implementing AI pre-screening, the wait for first feedback dropped to effectively zero.
How AI code review helps:
Typo customers have seen substantial improvements: StackGen achieved 30% reduction in PR review time, and JemHR improved PR cycle time by 50%. These gains come from reducing review iterations—AI code reviews catch what would otherwise require human feedback rounds.
The balance between automation and human judgment matters. AI handles mechanical checks; humans focus on architecture, logic, and maintainability. This division makes both more effective.
Even teams committed to improvement hit obstacles. These are the most frequent bottlenecks and proven solutions. Setting WIP limits helps manage work-in-progress and prevent bottlenecks, while tracking other pull request metrics—such as PR Pickup Time, cycle time, and PR size—enables teams to monitor and optimize the entire pull request process. Additionally, mapping workflows visually, creating standard operating procedures (SOPs), and implementing a RACI matrix are effective strategies for improving PR processes and reducing cycle time.
Problem: Senior engineers become bottlenecks, reviewing most PRs while their queues grow.
Solution: Implement load balancing across team members. Cross-train developers on different code areas so multiple people can approve in each subsystem. Track review distribution metrics and adjust when imbalance appears.
Problem: PRs sit waiting because no one knows who should review them.
Solution: CODEOWNERS files combined with automated assignment rules. Define clear escalation paths for when owners are unavailable. Every directory should have at least two qualified reviewers.
Problem: Constant PR notifications interrupt deep work, leading developers to ignore them entirely.
Solution: Batch review sessions instead of interrupt-driven reviews. Configure intelligent notification filtering that surfaces urgent items while batching routine reviews. Some teams find dedicated “review o’clock” times effective.
Problem: Some changes genuinely can’t be decomposed easily, especially migrations or refactoring.
Solution: Establish different review processes for known-large changes. Use incremental migration strategies where possible. When large PRs are unavoidable, schedule dedicated review time with appropriate reviewers rather than expecting async turnaround.
Reducing PR cycle time requires a systematic approach across three dimensions: controlling PR size, automating triage and initial review, and establishing clear team processes. The teams seeing 30-50% improvements aren’t doing one thing differently—they’re applying multiple interventions that compound.
Immediate next steps:
Related areas to explore: Overall DORA metrics optimization connects PR cycle time to broader delivery performance, including CI/CD optimization using DORA metrics. Developer experience measurement helps identify whether cycle time improvements translate to actual productivity gains. Understanding how AI coding tools impact your metrics ensures you’re measuring what matters as development practices evolve.
See PR Analytics in Typo to track cycle time components and identify bottlenecks in real time. The platform surfaces where your team loses time across the entire code review process, enabling targeted interventions rather than guesswork.
What’s the difference between PR cycle time and lead time for changes?
PR cycle time measures from pull request creation to merge. DORA’s Lead Time for Changes spans from first commit to running in production—a broader measure that includes time before PR creation and deployment time after merge. PR cycle time is a subset of lead time and typically the most actionable component for engineering teams to improve when you are mastering the art of DORA metrics.
How do I convince my team to keep PRs smaller without sacrificing quality?
Frame it as reducing cognitive load, not cutting corners. Smaller PRs get faster, more thorough reviews because reviewers can actually focus. Share data: PRs under 200 lines get reviewed 20× faster. Start with guidelines rather than hard limits, and celebrate examples of good decomposition. Feature flags enable shipping incomplete features safely, removing the pressure to batch everything into large PRs.
Should we prioritize speed over thorough code review?
No—but the framing is misleading. Smaller PRs enable both speed and thoroughness. A reviewer spending 20 focused minutes on a 100-line PR catches more issues than spending 90 distracted minutes on a 500-line PR. Optimize for review quality per line of code, not absolute time spent. Reserve intensive review for high-risk changes; routine changes can move faster.
How does AI code review impact overall cycle time?
AI code review primarily reduces pickup time (providing instant first feedback) and review iterations (catching issues authors would otherwise need to fix after human review). Atlassian saw 45% cycle time reduction; Exceeds AI data shows PRs with AI assistance close in 2.1 days versus 4.2 days without. The tradeoff: some research indicates AI-assisted PRs may have higher defect density, so human review remains essential for complex changes.
What’s a realistic target for teams just starting to optimize PR cycle time?
Start with reducing time to first review by 25% and ensuring 80%+ of PRs stay under 200 lines. For a team currently at 3-5 day cycle times, target reaching <48 hours within a quarter. Elite performance (<12 hours) typically requires multiple optimization cycles. Focus on consistency before speed—reducing variance in your slowest PRs often matters more than improving your already-fast ones.
In 2026, organizations across manufacturing, IT, and product development face mounting pressure to deliver more value with fewer resources. Throughput metrics have become the universal language for quantifying exactly how much value—whether units, tasks, transactions, or data—a system delivers per unit of time. Understanding throughput is no longer optional; it’s the foundation of operational efficiency and competitive advantage.
Throughput metrics are typically tracked over a certain period, such as daily or weekly intervals, to analyze and optimize efficiency.
This guide is intended for operations managers, software development leads, IT professionals, and anyone responsible for optimizing system performance or delivery processes. Tracking key metrics is essential for monitoring system performance and identifying opportunities to improve throughput.
This article covers throughput metrics across three critical domains: manufacturing operations, Agile and Kanban workflows in software development processes, and system performance including network and load testing. You’ll learn core formulas with practical examples, discover how to calculate throughput in different contexts, and understand how to interpret throughput data alongside related metrics like cycle time, lead time, and bandwidth.
Throughput refers to the number of completed units of output delivered per defined period.
Throughput metrics measure the rate at which a system processes, completes, or delivers work within a specific timeframe. Throughput is the amount of data or transactions a system processes within a defined time frame under specific conditions. Throughput is the amount of a product that a company can produce and deliver within a set time period. Throughput measures how quickly and efficiently an organization can deliver products, services, or completed work to meet customer demands.
Whether you’re measuring products per hour, stories per sprint, or requests per second, the fundamental concept remains consistent: throughput quantifies your system’s actual delivery rate.
The basic formula is straightforward:
Throughput = Number of Completed Units / Time Period
The critical distinction here is that “completed units” must represent actual value delivered—sold products, deployed features, or successfully processed requests—rather than merely work started. A chair manufacturer with 100 chairs in their production process and an average flow time of 10 days has a throughput of 10 chairs per day, regardless of how many units are still being assembled.
Because throughput is a rate (not a raw count), it’s sensitive to both volume and time. This characteristic makes measuring throughput central for capacity planning, allowing teams to forecast how many units or tasks they can realistically deliver within a given period.
While the mathematical definition of throughput remains consistent, its practical interpretation varies across industries:
These variations share a common thread: throughput always answers “how many units of value does this process deliver per unit of time?”
Throughput rarely tells the complete story on its own. To gain valuable insights into team performance and organizational performance, you need to analyze throughput alongside other key flow metrics that capture different dimensions of system behavior.
Throughput metrics gained strategic prominence through the Theory of Constraints (TOC), pioneered by Eliyahu Goldratt in his 1984 novel “The Goal.” TOC positions throughput as the primary measure of system success, with all performance ultimately limited by a single constraint or bottleneck.
Consider a factory capable of assembling 500 units daily, yet shipping only 350 units due to final inspection capacity limits. This throughput analysis immediately highlights where management should focus improvement efforts. Organizations use throughput per shift, per day, or per week as a governance metric in manufacturing, logistics, and warehouse operations to identify areas requiring intervention.
In software development and knowledge work, throughput tracks completed work items—user stories, tasks, bugs, or features—over a sprint or week. This performance metric provides a count-based view of delivery capacity that supports forecasting and process stability assessment.
Consider two teams with similar velocity of 40 story points per sprint. Team A completes 8 large items while Team B completes 16 smaller items. Differences in how teams estimate work—such as whether they rely more on story points vs hours for estimation—also influence how throughput and velocity trends are interpreted. Team B’s higher throughput typically indicates better predictability and more frequent customer feedback—demonstrating why throughput matters for agile project management.
Kanban tools commonly visualize throughput using specialized charts that reveal patterns invisible in raw numbers:
A typical pattern might show a team whose throughput centers around 6-8 items/day under normal conditions but occasionally spikes to 15 items immediately following big releases when accumulated items flow through to completion. Recognizing these patterns enables better sprint planning and resource allocation.
In Scrum, throughput measures completed Product Backlog Items per sprint, regardless of story point estimates. This simplicity makes it powerful for tracking team’s throughput over time, especially when complemented with DORA metrics to improve Scrum team performance.
Example progression:
Best practices for Scrum throughput:
In performance testing, throughput measures transactions processed per second or minute under specific load conditions. This metric is central to validating that systems can handle expected—and unexpected—traffic volumes.
Test reports typically present time-series throughput graphs, helping teams identify at what user load throughput plateaus and correlate performance degradation with specific system components.
Network throughput represents actual volume of data successfully delivered over a link per second, while bandwidth defines maximum theoretical capacity. Understanding this distinction is crucial for realistic capacity planning.
Engineers read throughput graphs during incident analysis to pinpoint whether network capacity, application logic, or backend systems are causing degradation.
This section provides ready-to-use formulas for typical contexts along with guidance on interpretation and common pitfalls.
Operations/Manufacturing:
Agile/Kanban:
Performance Testing:
Financial/Healthcare:
Interpretation guidance:
Throughput measurement tools play a key role in helping organizations achieve operational efficiency by providing the data and insights needed to calculate throughput, analyze performance, and identify bottlenecks across workflows. By leveraging these tools, teams can visualize throughput, track progress on tasks, and pinpoint areas where efficiency can be improved.
Time tracking software is a foundational tool for measuring how long tasks and projects take to complete. By capturing detailed throughput data, these tools enable teams to analyze throughput trends, identify areas where work slows down, and make informed decisions to optimize productivity.
Project management platforms such as Asana, Trello, and Jira are widely used to manage workflows, monitor work in progress, and track completed items over a set timeframe. These tools not only help teams calculate throughput but also provide valuable insights into team performance, allowing managers to identify bottlenecks and allocate resources more effectively. By visualizing throughput and work completed, organizations can quickly spot inefficiencies and implement targeted improvements.
Analytics software, including solutions like Google Analytics and Mixpanel, extends throughput measurement to digital environments. These tools help organizations analyze throughput in terms of website traffic, user actions, and conversion rates, offering a data-driven approach to optimizing digital processes and increasing throughput.
In supply chains and logistics, specialized supply chain management software is essential for tracking inventory, monitoring the flow of raw materials, and managing the production process. These tools help organizations identify areas where wait time or processing time limits throughput, enabling more efficient sourcing of raw materials and smoother delivery of finished goods.
By integrating these throughput measurement tools into their operations, organizations gain the ability to continuously monitor, analyze, and improve throughput. This leads to greater efficiency, higher productivity, and a more agile response to changing business demands.
Consistently tracking throughput gives organizations a quantitative basis for improvement decisions rather than relying on intuition or anecdotes. The benefits span operational, financial, and customer-facing dimensions.
These benefits apply across functions: operations teams use throughput for scheduling, engineering teams for sprint planning, and finance teams for margin analysis.
Improving throughput isn’t simply about working faster—it requires systematically removing constraints and reducing waste. The flow rate through any system depends on its weakest link, so indiscriminate effort often yields minimal results.
Any throughput increase must be balanced with quality and risk management. Track defect rates, error percentages, and customer complaints alongside throughput to ensure speed doesn’t compromise value. Maintaining high throughput means nothing if quality degrades.
Organizations seeking to maximize throughput and maintain high operational efficiency often adopt proven methodologies and frameworks that focus on continuous improvement, reducing bottlenecks, and increasing productivity. These organizational approaches are designed to optimize the flow of work, streamline processes, and ensure that resources are used as efficiently as possible.
Lean manufacturing is a widely adopted approach that emphasizes the elimination of waste, reduction of variability, and improvement of process flow. By focusing on value-added activities and systematically removing inefficiencies, Lean helps organizations increase throughput and deliver more value with fewer resources.
Agile project management is another powerful strategy, particularly in software development and knowledge work. By breaking down large projects into smaller, manageable tasks and prioritizing work based on customer value, Agile teams can improve throughput, adapt quickly to change, and foster a culture of continuous improvement. Regular retrospectives and iterative planning help teams identify bottlenecks and implement targeted improvements to their workflows.
Total Quality Management (TQM) takes a holistic approach to improving throughput by engaging employees at all levels in the pursuit of quality and efficiency. TQM emphasizes continuous improvement, data-driven decision-making, and a strong focus on customer satisfaction. By embedding quality into every stage of the production process, organizations can reduce rework, minimize delays, and increase overall throughput.
Just-in-time (JIT) production is a strategy that aligns production schedules closely with customer demand, minimizing inventory and reducing wait times. By producing and delivering products only as needed, organizations can optimize throughput, reduce excess work in progress, and respond more flexibly to market changes.
By implementing these organizational approaches, companies can systematically improve throughput, reduce bottlenecks, and drive ongoing improvements in efficiency and productivity. These strategies not only enhance team performance and project management outcomes but also position organizations for long-term success in competitive markets.
Throughput can mislead when measured incorrectly or incentivized poorly. Awareness of common pitfalls helps teams avoid optimizing for the wrong outcomes.
In one documented case, throughput-tied bonuses led a team to fragment large projects into dozens of tiny tickets, technically increasing throughput while delaying actual project completion by weeks. The lesson: throughput incentives must align with customer value, not just item counts.
Throughput metrics, when clearly defined and consistently measured, provide a powerful lens on system performance across manufacturing, Agile delivery, and IT operations. From how many units a factory ships daily to transactions processed by financial systems per second, throughput answers the fundamental question of delivery capacity.
The most effective use of throughput combines:
Industry leaders in 2026 leverage throughput metrics not just for reporting, but for probabilistic forecasting, constraint identification, and continuous improvement. Real-time dashboards in manufacturing execution systems and Kanban tools provide immediate visibility, while AI-driven simulations enable more sophisticated planning than simple averages allow.
Start by mapping your current process and identifying the single biggest constraint limiting your throughput today. Implement basic throughput tracking with consistent definitions and measurement periods. As your data matures, incorporate other metrics and move toward more advanced analyses. Building resilient, scalable, and customer-centric operations requires exactly this kind of quantitative foundation—and throughput metrics provide the starting point.
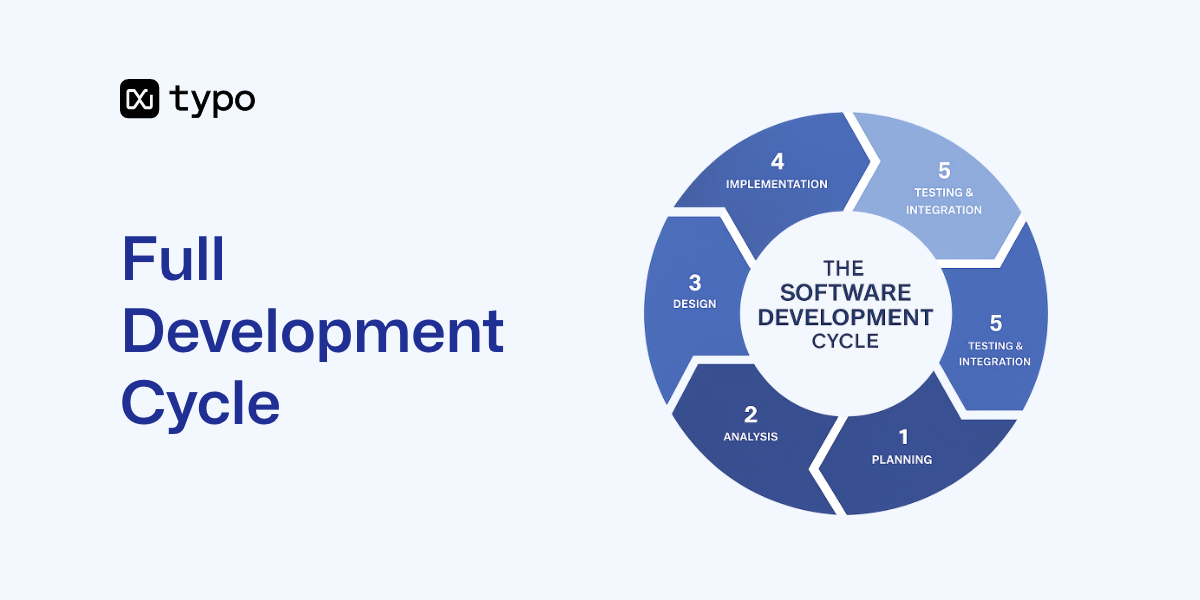
The full development cycle, commonly referred to as the Software Development Life Cycle (SDLC), is a structured, iterative methodology used to plan, create, test, and deploy high-quality software efficiently at a low cost. The SDLC consists of several core stages, also known as common SDLC phases and key phases: planning, design, implementation, testing, deployment, and maintenance. Each of these phases plays a critical role in the software development process, serving as essential checkpoints that contribute to quality and project success.
After understanding the phases, it’s important to recognize the variety of SDLC models available. Common SDLC models include the Waterfall model (a linear, sequential approach best for small projects), the Agile model (an iterative, flexible methodology emphasizing collaboration and customer feedback), the V-shaped model (which focuses on validation and verification through testing at each stage), the Spiral model (which combines iterative development with risk assessment), and the RAD (Rapid Application Development) model (which emphasizes quick prototyping and user feedback). Choosing the right SDLC model depends on the software project’s requirements, team structure, and complexity, especially for complex projects.
The full development cycle refers to managing a software product’s entire process and full life cycle through a structured SDLC process that maintains team continuity and a unified project vision. This approach is central to custom software development and full cycle development, where the same project team is engaged throughout the software development lifecycle. A full cycle developer is involved in all stages of the software development process, ensuring seamless workflow, clear communication, and comprehensive responsibility for project success. Unlike segmented or sprint-based development, full-cycle software development services ensure no interruptions during the development cycle, leading to faster time-to-market, better budget management, and cost-effectiveness.
Full-cycle software development is also ideal for MVP development, as it allows for planning all steps in advance and gradual implementation. This is particularly beneficial for complex projects, as it allows for comprehensive planning, risk management, and proactive problem-solving. The consistency of engaging the same team throughout the entire process enhances communication, collaboration, and the quality of the final product. A unified dev team boosts developer productivity and operational efficiency, empowering the team to deliver better results and reduce burnout.
Why does this matter? With fast-changing market demands and high customer expectations, managing the entire lifecycle allows faster response to change, better alignment to business objectives, and improved quality assurance. Effective project management in a software project includes monitoring & controlling, risk management, and maintaining cost & time efficiency through detailed planning and improved visibility, all of which contribute to effective software delivery across the SDLC. Improved visibility and efficiency in SDLC keeps stakeholders informed and streamlines project tracking.
Organizations using fragmented approaches often accumulate significant technical debt because early decisions in system architecture, security, and user experience suffer when later teams lack context from previous development stages. Effective communication among team members and full cycle developers further enhances workflow efficiency and project success, particularly when supported by well-chosen KPIs for software development team success that align everyone on shared outcomes.
Risk management in SDLC detects issues early, mitigating potential security or operational risks, especially when teams follow well-defined software development life cycle phases with clear deliverables and review points. Additionally, SDLC addresses security by integrating security measures throughout the entire software development life cycle, not just in the testing phase. Approaches such as DevSecOps incorporate security early in the process and make it a shared responsibility, ensuring a proactive stance on security management during SDLC from initial design to deployment.
The development cycle, often referred to as the software development life cycle (SDLC), is a structured process that guides development teams through the creation of high quality software. By following a systematic approach, the SDLC ensures that every stage of software development—from initial planning to final deployment—is carefully managed to meet customer expectations and business goals. This life cycle is designed to bring order and efficiency to software development, reducing risks and improving outcomes. Each phase of the development cycle plays a vital role in shaping the software development life, ensuring that the final product is robust, reliable, and aligned with user needs. By adhering to a structured process, organizations can deliver software that not only functions as intended but also exceeds customer expectations throughout its entire life cycle.
The Development Life Cycle SDLC is the backbone of a successful software development process, providing a systematic framework that guides teams from concept to completion. By breaking down the software development process into distinct, interconnected phases—such as planning, design, implementation, testing, deployment, and maintenance—the SDLC process ensures that every aspect of the project is carefully managed and aligned with customer expectations. This structured approach not only helps development teams produce high quality software, but also enables them to anticipate challenges, allocate resources efficiently, and maintain a clear focus on project goals throughout the life cycle. By adhering to the development life cycle SDLC, organizations can deliver software that is reliable, scalable, and tailored to meet the evolving needs of users, ensuring long-term success and satisfaction.
A streamlined workflow is the backbone of an effective software development life cycle. In full cycle software development, the development team benefits from a clearly defined process where each stage—from planning through deployment—is mapped out and responsibilities are transparent. This clarity allows the team to collaborate efficiently, minimizing bottlenecks and ensuring that every member knows their role in the development cycle. By maintaining a structured workflow, the development process becomes more predictable and manageable, which is essential for delivering high quality software that aligns with customer expectations. Project management plays a pivotal role in this, with methodologies like agile and Lean development practices for SDLC helping teams adapt quickly to changes and stay focused on their goals, and with resources on engineering data management and workflow automation further supporting continuous improvement. Ultimately, a streamlined workflow supports the entire life cycle, enabling the development team to deliver consistent results and maintain momentum throughout the software development life.
The planning and requirement gathering phase is the cornerstone of a successful software development life cycle. During this stage, the development team collaborates closely with stakeholders—including customers, end-users, and project managers—to collect and document all necessary requirements for the software project. This process results in the creation of a comprehensive software requirement specification (SRS) document, which outlines the project scope, objectives, and key deliverables. The SRS serves as a roadmap for the entire development process, ensuring that everyone involved has a clear understanding of what needs to be achieved. In addition to defining requirements, the planning phase involves careful risk management, accurate cost estimates, and strategic resource allocation that directly influence developer productivity throughout the project. These activities help the team assess project feasibility and set realistic timelines, laying a solid foundation for the rest of the software development life, including planning for effective code review best practices that will support code quality later in the cycle. By investing time and effort in thorough planning, development teams can minimize uncertainties and set the stage for a smooth and successful project execution.
The Design Phase is a pivotal part of the software development life cycle, where the vision for the software begins to take concrete shape. During this stage, software engineers use the insights gathered during the planning phase to craft a detailed blueprint for the software product. This involves selecting the most appropriate technologies, development tools, and considering the integration of existing modules to streamline the development process. The design phase also addresses how the new solution will fit within the current IT infrastructure, ensuring compatibility and scalability. The result is a comprehensive design document that outlines the software’s architecture, user interfaces, and system components, serving as a roadmap for the implementation phase. By investing in a thorough design phase, development teams lay a strong foundation for the entire development process, reducing risks and setting the stage for a successful software development life.
The development stages of the software development life cycle encompass the design, implementation, and testing phases, each contributing to the creation of a high quality software product. In the design phase, software engineers translate requirements into a detailed blueprint, defining the software’s architecture, components, and interfaces. This careful planning ensures that the system will be scalable, maintainable, and aligned with the project’s goals, while also creating the context needed to avoid common mistakes during code reviews that can undermine software quality. The implementation phase follows, where the development team brings the design to life by writing code, conducting code reviews, and performing unit testing to verify that each component functions correctly. Collaboration and attention to detail are crucial during this stage, as they help maintain code quality and consistency. Once the core features are developed, the testing phase begins, involving integration testing, system testing, and acceptance testing. These activities validate the software’s functionality, performance, and security, ensuring that it meets the standards set during the earlier phases. By progressing through these development stages in a structured manner, teams can effectively manage the software development life, reduce overall software cycle time, and minimize coding time within cycle time to deliver reliable solutions that fulfill user needs.
Testing and quality assurance are essential components of the software development life cycle, ensuring that the final product meets both technical standards and customer expectations. During the testing phase, the testing team employs a variety of techniques—including black box, white box, and gray box testing—to thoroughly evaluate the software’s functionality, performance, and security, often relying on specialized tools that improve the SDLC from automated testing to continuous integration. These methods help identify and report defects early, reducing the risk of issues in the production environment. Quality assurance goes beyond testing by incorporating activities such as code reviews, validation, and process improvements to guarantee that the software is reliable, stable, and maintainable, often supported by an effective code review checklist that standardizes review criteria. The creation of detailed test cases, test scripts, and test data enables comprehensive coverage and repeatable testing processes. By prioritizing quality assurance throughout the life cycle, development teams can produce high quality software that not only meets but often exceeds customer expectations, supporting long-term success and continuous improvement in the software development process.
Deployment and Maintenance are essential phases in the software development life cycle that ensure the software product delivers ongoing value to users. The deployment phase is when the software is packaged, configured, and released into the production environment, making it accessible to end-users. This stage requires careful planning to ensure a smooth transition and minimal disruption. Once deployed, the maintenance phase begins, focusing on supporting the software throughout its operational life. This includes addressing bugs, implementing updates, and responding to user feedback to ensure the software continues to meet customer expectations. Maintenance also involves monitoring system performance, enhancing security, and making necessary adjustments to keep the software reliable and efficient. Together, the deployment and maintenance phases are crucial for sustaining the software development life and ensuring the product remains robust and relevant over time.
One of the standout advantages of full cycle software development is the ability to achieve faster time-to-market by improving key delivery metrics such as cycle time and lead time. By following a structured development process and leveraging iterative development practices, development teams can quickly transform ideas into a working software product. This approach allows for rapid prototyping, frequent releases, and continuous feedback, ensuring that new features and improvements reach users sooner. Automation in testing and deployment further accelerates the process, reducing manual effort and minimizing delays. As a result, businesses can respond swiftly to evolving market demands, outpace competitors, and better satisfy customer needs. The full cycle approach not only speeds up delivery but also ensures that the software product maintains the quality and functionality required for long-term success.
Navigating the software development life cycle comes with its share of risks, from project delays and budget overruns to the delivery of subpar software. Effective risk management is essential to a successful development process. Development teams can proactively address potential issues through comprehensive risk analysis, identifying and evaluating threats early in the development cycle. Contingency planning ensures that the team is prepared to handle unexpected challenges without derailing the project. Continuous testing throughout the development life cycle SDLC helps catch defects early, while analyzing cycle time across development stages reduces the likelihood of costly fixes later on. Strong project management practices, supported by the right tools and careful tracking of issue cycle time in engineering operations and accurately calculating cycle time in software development, keep the team organized and focused, further minimizing risks. By integrating these strategies, teams can safeguard the software development life, ensuring that the final product meets both quality standards and customer expectations.
A successful software development life cycle relies on a suite of tools and technologies that support each phase of the development process. Project management tools help the development team organize tasks, track progress, and collaborate effectively. Version control systems, such as Git, ensure that code changes are managed efficiently and securely, while tracking key DevOps metrics for performance helps teams understand how those changes affect delivery speed and stability. Integrated development environments (IDEs) like Eclipse streamline coding and debugging, while testing frameworks such as JUnit enable thorough and automated software testing. Deployment tools, including Jenkins, facilitate smooth transitions from development to production environments. The selection of these tools depends on the project’s requirements and the preferences of the development team, but their effective use can significantly enhance the efficiency, quality, and reliability of the software development process throughout the life cycle.
Adopting best practices is vital for development teams aiming to deliver high quality software that meets and exceeds customer expectations. Following a structured software development life cycle ensures that every phase is executed with precision and accountability. Thorough requirements gathering and analysis lay the groundwork for success, while iterative and incremental development approaches allow for flexibility and continuous improvement. Regular code reviews help maintain code quality and catch issues early, and the use of version control systems safeguards project assets, especially when teams follow best practices for setting software development KPIs to measure and improve these activities. Continuous testing and integration ensure that new features are reliable and do not disrupt existing functionality. Additionally, investing in the ongoing training and development of the team, embracing agile methodologies, and fostering a culture of learning and adaptation all contribute to a robust software development life. By integrating these best practices into the life cycle, development teams can consistently produce software that is reliable, maintainable, and aligned with customer needs.
GitHub Copilot ROI is top of mind in February 2026, and engineering leaders everywhere are asking the same question: is this tool actually worth it? Understanding Copilot ROI helps engineering leaders make informed investment decisions and optimize team productivity. ROI (Return on Investment) is a measure of the value gained relative to the cost incurred. The short answer is yes—if you measure beyond license usage and set it up intentionally. Most teams still only see 28-day adoption windows, not business impact.
The data shows real potential. GitHub’s 2023 controlled study found developers with Copilot completed coding tasks 55% faster (1h11m vs 2h41m). But GitClear’s analysis of millions of PRs revealed ~41% higher churn in AI-assisted code. Typo customers who combined Copilot with structured measurement saw different results: JemHR achieved 50% improvement in PR cycle time, and StackGen reduced PR review time by 30%.
This article is for VP/Directors of Engineering and EMs at SaaS companies with 20–500 developers already piloting Copilot, Cursor, or Claude Code. Here’s what we’ll cover:
Over 50,000 businesses and roughly one-third of the Fortune 500 now use GitHub Copilot. Yet most organizations only track seats purchased and monthly active users—metrics that tell you nothing about software delivery improvement.
Adoption patterns vary dramatically across teams:
This creates the “AI productivity paradox”: individual developer speed goes up, but org-level delivery metrics stay flat. Telemetry studies across 10,000+ developers confirm this pattern—faster individual coding, but modest or no change in lead time until teams rework their review and testing pipelines.
GitHub’s built-in Copilot metrics provide a 28-day window with per-seat usage and suggestion acceptance rates. But engineering leaders need trend lines over quarters, impact on PR flow, incident rates, and rework data. Typo connects to GitHub, GitLab, Bitbucket, Jira, and other core tools in ~60 seconds to unify this data without extra instrumentation using its full suite of engineering tool integrations.
Most dashboards answer “How many people use Copilot?” instead of “Is our SDLC (Software Development Life Cycle) healthier because of it?” This distinction matters because license utilization can look great while PR throughput and code quality degrade.
Developer experience metrics—satisfaction, cognitive load, burnout risk—are part of ROI, not “nice to have.” Satisfied developers perform better and stay longer. Many teams overlook that improved developer satisfaction directly affects retention costs, even though developer productivity in the age of AI is increasingly shaped by these factors.
Definition: AI-assisted work refers to code or pull requests (PRs) created with the help of tools like GitHub Copilot. AI-influenced PRs are pull requests where AI-generated code or suggestions have been incorporated.
The evidence base for AI-assisted development is now much stronger than in 2021–2022.
Typo’s dataset of 15M+ PRs across 1,000+ teams reveals a consistent pattern: teams that combine Copilot with disciplined PR practices see 20–30% reductions in PR cycle time and more deployments within 3–6 months. The key insight: Copilot has strong potential ROI, but only when measured within the SDLC, not just the IDE—exactly the gap Typo’s AI engineering intelligence platform is built to address.
This framework is designed for VP/Director-level implementation: baseline → track → survey → benchmark. Everything must be measurable with real data from GitHub, Jira, and CI/CD tools.
You can’t calculate ROI without “before” data—ideally 4–12 weeks of history. Capture these baseline metrics per team and repo:
These maps closely to DORA metrics for engineering leaders, so you can compare your Copilot impact to industry benchmarks.
Use structured DevEx questions and lightweight in-tool prompts from an AI-powered developer productivity platform rather than ad hoc surveys.
Example baseline: “Team Alpha: 2.5-day median PR cycle time, 15 deployments/month, 18% change failure rate in Q4 2025.”
You must distinguish AI-influenced PRs from non-AI PRs to get valid comparisons. Without this, you’re measuring noise.
Definition: AI-assisted work refers to code or pull requests (PRs) created with the help of tools like GitHub Copilot.
For remote and distributed teams, pairing tagging with AI-assisted code reviews for remote teams can make it easier to consistently flag AI-generated changes.
Treat Git events and work items as a single system of record by leaning on deep GitHub and Jira integration so that Copilot usage is always tied back to business outcomes.
Typo’s AI Impact Measurement pillar automatically correlates “AI-assisted” signals with PR outcomes—no Elasticsearch + Grafana setup required, and its broader AI-powered code review capabilities ensure risky changes are flagged early.
Treat this as a data-driven experiment, not a permanent commitment: 8–12 weeks, 1–3 pilot teams, clear hypotheses.
Example result: “Pilot Team Bravo reduced median PR cycle time from 30h to 20h over 10 weeks while AI-influenced PR share climbed from 0% to 45%.”
ROI Formula: ROI = (Value of Time Saved + Quality Gains + DevEx Improvements − Costs) ÷ Costs
Quality gains include fewer incidents, lower rework, and reduced churn. DevEx value covers reduced burnout risk and improved developer happiness tied to retention.
Anchor on a small, rigorous set of concrete metrics rather than dozens of vanity charts.
GitHub’s Copilot metrics (activation, acceptance, language breakdown) are useful input signals but must be correlated with these SDLC metrics to tell an ROI story. Typo surfaces all three buckets in a single dashboard, broken down by team, repo, and AI-adoption cohort.
40–60 engineers using Node.js/React with GitHub + Jira. After measuring baseline and implementing Copilot with Typo analytics, they achieved ~50% improvement in PR cycle time over 4 months. Deployment frequency increased ~30% with no increase in change failure rate.
15 engineers facing severe PR review bottlenecks. Copilot adoption plus Typo’s automated AI code review reduced PR review time by ~30%. Reviewers focused on architectural concerns while AI caught style issues and performed more thorough analysis of routine tasks.
120-engineer org runs a 12-week Copilot+Typo pilot with 3 teams. Pilot teams see 25% reduction in lead time, 20% more deployments, and 10–15% fewer production incidents. Financial impact: faster feature delivery yields estimated competitive advantage versus <$100K annual spend.
These outcomes only materialized where leaders treated Copilot as an experiment with measurement—not “flip the switch and hope.”
Poor measurement can make Copilot look useless—or magical—when reality is nuanced.
Typo’s dashboards are intentionally team- and cohort-focused to avoid surveillance concerns and encourage widespread adoption.
Typo is an engineering intelligence platform purpose-built to answer “Is our AI coding stack actually helping?” for GitHub Copilot, Cursor, and Claude Code, grounded in a mission to redefine engineering intelligence for modern software teams.
Typo’s automated AI code review layer complements Copilot by catching risky AI-generated code patterns before merge—reducing the churn that GitClear data warns about and leveraging AI-powered PR summaries for efficient reviews to keep feedback fast and focused. Connect Typo to your GitHub org and run a 30–60 day Copilot ROI experiment using prebuilt dashboards.
Copilot has real, measurable ROI—but only if you baseline, instrument, and analyze with the right productivity metrics.
Connect GitHub/Jira/CI to Typo and freeze your baseline. Capture quantitative metrics and run an initial DevEx survey for qualitative feedback.
Enable Copilot for 1–2 pilot programs, run enablement sessions, and start tagging AI-influenced work. Set realistic expectations with teams working on the pilot.
Monitor PR cycle time, lead time, and early quality signals. Identify optimization opportunities in existing workflows and development cycles.
Run a quick DevEx survey and produce a preliminary ROI snapshot for leadership using data driven insights.
Report Copilot ROI using DORA and DevEx language—lead time, change failure rate, developer satisfaction—not “lines of code” or “suggestions accepted.” This enables continuous improvement and seamless integration with your digital transformation initiatives.
Ready to see your actual Copilot impact quantified with real SDLC data? Start a free Typo trial or book a demo to measure your GitHub Copilot ROI in 60 seconds—not 60 days.

Engineering leaders evaluating LinearB alternatives in 2026 face a fundamentally different landscape than two years ago. The rise of AI coding tools like GitHub Copilot, Cursor, and Claude Code has transformed how engineering teams write and review code—yet most engineering analytics platforms haven’t kept pace with measuring what matters most: actual AI impact on delivery speed and code quality.
Note: LinearB should not be confused with Linear, which is a project management tool often used as a faster alternative to Jira.
This guide covers the top LinearB alternatives for VPs of Engineering, CTOs, and engineering managers at mid-market SaaS companies who need more than traditional DORA metrics. We focus specifically on platforms that address LinearB’s core gaps: native AI impact measurement, automated code review capabilities, and simplified setup processes. Enterprise-focused platforms requiring months of implementation fall outside our primary scope, though we include them for context.
The direct answer: The best LinearB alternatives combine SDLC visibility with AI impact measurement and AI powered code review capabilities that LinearB currently lacks. Platforms like Typo deliver automated code review on every pull request while tracking GitHub Copilot ROI with verified data—capabilities LinearB offers only partially.
By the end of this guide, you’ll understand:
Note: LinearB should not be confused with Linear, which is a project management tool often used as a faster alternative to Jira.
LinearB positions itself as a software engineering intelligence platform focused on SDLC visibility, workflow automation, and DORA metrics like deployment frequency, cycle time, and lead time. The platform integrates with Git repositories, CI/CD pipelines, and project management tools to expose bottlenecks in pull requests and delivery flows. For engineering teams seeking basic delivery analytics, LinearB delivers solid DORA metrics and PR workflow automation through GitStream.
However, LinearB’s architecture reflects an era before AI coding tools became central to the software development process. Three specific limitations now create friction for AI-native engineering teams.
LinearB tracks traditional engineering metrics effectively—deployment frequency, cycle time, change failure rate—but lacks native AI coding tool impact measurement. While LinearB has introduced dashboards showing Copilot and Cursor usage, the tracking remains surface-level: license adoption and broad cycle time correlations rather than granular attribution.
Recent analysis of LinearB’s own data reveals the problem clearly. A study of 8.1 million pull requests from 4,800 teams found AI-generated PRs wait 4.6x longer in review queues, with 10.83 issues per AI PR versus 6.45 for manual PRs. Acceptance rates dropped from 84.4% for human code to 32.7% for AI-assisted code. These findings suggest AI speed gains may be cancelled by verification costs—exactly the kind of insight teams need, but LinearB’s current metrics don’t capture this nuance.
For engineering leaders asking “What’s our GitHub Copilot ROI?” or “Is AI code increasing our delivery risks?”, LinearB provides estimates rather than verified engineering data connecting AI usage to business outcomes.
G2 reviews consistently highlight LinearB’s steep learning curve. Teams report multi-week onboarding processes for organizations with many repositories, complex CI/CD pipelines, or non-standard branching workflows. Historical data import challenges and dashboard configuration complexity add friction.
This contrasts sharply with modern alternatives offering 60-second setup. For mid-market SaaS companies without dedicated platform teams, weeks of configuration work represents real engineering effort diverted from product development.
LinearB introduced AI-powered code review features including auto-generated PR descriptions, context-aware suggestions, and reviewer assignment through GitStream. However, these capabilities complement workflow automation rather than replace deep code analysis.
Missing from LinearB’s offering: merge confidence scoring, scope drift detection (identifying when code changes solve the wrong problem), and context-aware reasoning that considers codebase history. For teams where AI-generated code comprises 30-40% of pull requests, this gap creates review bottlenecks that offset AI productivity gains.
Given LinearB’s gaps, what should engineering managers prioritize when evaluating alternatives? Three capability areas separate platforms built for 2026 from those designed for 2020.
Modern engineering intelligence platforms must track AI coding tool impact beyond license counts. Essential capabilities include:
This engineering data enables informed decisions about AI tool investments and identifies where human review processes need adjustment.
AI powered code review has evolved beyond syntax checking. Leading platforms now offer:
These capabilities address the verification bottleneck revealed in AI PR data—where faster writing means slower reviewing without intelligent automation.
Setup complexity directly impacts time to value. Modern alternatives provide:
The following analysis evaluates each platform against criteria most relevant for AI-native engineering teams: AI capabilities, setup speed, DORA metrics support, and pricing transparency.
Top alternatives to LinearB for software development analytics include Jellyfish, Swarmia, Waydev, and Allstacks.
1. Typo
Typo operates as an AI-native engineering management platform built specifically for teams using AI coding tools. The platform combines delivery analytics with automated code review on every pull request, using LLM-powered analysis to provide reasoning-based feedback rather than pattern matching.
Key differentiators include native GitHub Copilot ROI measurement with verified data, merge confidence scoring for delivery risk detection, and 60-second setup. Typo has processed 15M+ pull requests across 1,000+ engineering teams, earning G2 Leader status with 100+ reviews as an AI-driven engineering intelligence platform.
For teams where AI impact measurement and code review automation are primary requirements, Typo addresses LinearB’s core gaps directly.
2. Swarmia
Swarmia focuses on developer experience alongside delivery metrics, combining DORA metrics with DevEx surveys and team agreements, though several Swarmia alternatives offer broader AI-focused analytics. The platform emphasizes research-backed metrics rather than overwhelming teams with every possible measurement.
Strengths include clean dashboards, real-time Slack integrations, and faster setup (hours versus days). However, Swarmia provides limited AI impact tracking and no automated code review—teams still need separate tools for AI powered code review capabilities.
Best for: Teams prioritizing developer workflow optimization and team health measurement over AI-specific analytics, though some organizations will prefer a Swarmia alternative with deeper automation.
3. Jellyfish
Jellyfish serves enterprise organizations needing engineering visibility tied to business strategy, and there is now a growing ecosystem of Jellyfish alternatives for engineering leaders. The platform excels at resource allocation, capacity planning, R&D capitalization, and aligning engineering effort with business priorities.
The trade-off: Jellyfish requires significant implementation time—often 6-9 months to full ROI per published comparisons. Pricing reflects enterprise positioning with custom contracts typically exceeding $100,000 annually.
Best for: Large organizations needing financial data integration and executive-level strategic planning capabilities.
4. DX (getdx.com)
DX specializes in developer experience measurement using the DX Core 4 framework. The platform combines survey instruments with system metrics to understand morale, burnout, and workflow friction.
DX provides valuable insights into developer productivity factors but lacks delivery analytics, code review automation, or AI impact tracking. Teams typically use DX alongside other engineering analytics tools rather than as a standalone solution, especially when implementing broader developer experience (DX) improvement strategies.
Best for: Organizations with mature engineering operations seeking to improve team efficiency through DevEx insights.
5. Haystack
Haystack offers lightweight, Git-native engineering metrics with minimal configuration, sitting alongside a broader set of Waydev and similar alternatives in the engineering analytics space. The platform delivers DORA metrics, PR bottleneck identification, and sprint summaries without enterprise complexity.
Setup takes hours rather than weeks, making Haystack attractive for smaller teams wanting quick delivery performance visibility. However, the platform lacks AI code review features and provides basic AI impact tracking at best.
Best for: Smaller engineering teams needing fast delivery insights without comprehensive AI capabilities.
6. Waydev
Waydev provides Git analytics with individual developer insights and industry benchmarks and is frequently evaluated in lists of top LinearB alternative platforms. The platform tracks code contributions, PR patterns, and identifies skill gaps across engineering teams.
Critics note Waydev’s focus on individual metrics can create surveillance concerns. The platform offers limited workflow automation and no AI powered code review capabilities.
Best for: Organizations comfortable with individual contributor tracking and needing benchmark comparisons.
7. Allstacks
Allstacks positions itself as a value stream intelligence platform with predictive analytics and delivery forecasting, often compared against Intelligent LinearB alternatives like Typo. The platform helps teams identify bottlenecks across the value stream and predict delivery risks before they impact schedules.
Setup complexity and enterprise pricing limit Allstacks’ accessibility for mid-market teams. AI impact measurement remains basic.
Best for: Larger organizations needing predictive risk detection and value stream mapping across multiple products.
8. Pluralsight Flow
Pluralsight Flow combines engineering metrics with skill tracking and learning recommendations. The platform links identified skill gaps to Pluralsight’s training content, creating a development-to-learning feedback loop and is also frequently listed among Waydev competitor tools.
The integration with Pluralsight’s learning platform provides unique value for organizations invested in developer skill development. However, Flow provides no automated code review and limited AI impact tracking.
Best for: Organizations using Pluralsight for training who want integrated skill gap analysis, while teams focused on broader engineering performance may compare it with reasons companies choose Typo instead.
Challenge: Teams want to retain baseline engineering metrics covering previous quarters for trend analysis and comparison.
Solution: Choose platforms with API import capabilities and dedicated migration support. Typo’s architecture, having processed 15M+ pull requests across 2M+ repositories, demonstrates capability to handle historical data at scale. Request a migration timeline and data mapping documentation before committing. Most platforms can import GitHub/GitLab historical data directly, though Jira integration may require additional configuration.
Challenge: Engineering teams resist new tools, especially if previous implementations required significant configuration effort.
Solution: Prioritize platforms offering intuitive interfaces and dramatically faster setup. The difference between 60-second onboarding and multi-week implementation directly impacts adoption friction. Choose platforms that provide immediate team insights without requiring teams to build custom dashboards first.
Present the switch as addressing specific pain points (like “we can finally measure our Copilot ROI” or “automated code review on every PR”) rather than as generic tooling change.
Challenge: Engineering teams rely on specific GitHub/GitLab configurations, Jira workflows, and CI/CD pipelines that previous tools struggled to accommodate.
Solution: Verify one-click integrations with your specific toolchain before evaluation. Modern platforms should connect to existing tools without requiring workflow changes. Ask vendors specifically about your branching strategy, monorepo setup (if applicable), and any non-standard configurations.
LinearB delivered solid DORA metrics and workflow automation for its era, but lacks the native AI impact measurement and automated code review capabilities that AI-native engineering teams now require. The 4.6x longer review queue times for AI-generated PRs—revealed in LinearB’s own data—demonstrate why teams need platforms that address AI coding tool verification, not just adoption tracking.
Software performance measurement has become the backbone of modern engineering organizations. Achieving high performance is a key goal of software performance measurement, as it enables teams to optimize processes and deliver superior results. As teams ship faster and systems grow more complex, understanding how software behaves in production—and how effectively it’s built—separates high-performing teams from those constantly firefighting.
This guide is intended for engineering leaders, software developers, and technical managers seeking to improve software performance measurement practices in software development. Effective performance measurement is critical for delivering reliable, scalable, and high-quality software products.
This guide explores the full landscape of performance measurement, from runtime metrics that reveal user experience to delivery signals that drive engineering velocity. APM metrics are key indicators that help business-critical applications achieve peak performance, ensuring that organizations can maintain reliability and efficiency at scale.
Software performance measurement systematically tracks how a software application behaves in production and how effectively it’s built and delivered. It evaluates speed, stability, and scalability at runtime, alongside cycle time, deployment frequency, and code quality on the delivery side.
This practice covers two main areas. First, application-level performance monitored by traditional tools: response times, CPU usage, error rates, memory usage, throughput, request rates, concurrent users, uptime, database lock time, and the Apdex score measuring user satisfaction. Monitoring these metrics helps maintain a positive end user experience by preventing issues that degrade satisfaction or disrupt service. Second, delivery-level performance focuses on how quickly and safely code moves from commit to production, measured through DORA metrics and developer experience indicators.
Since around 2010, performance measurement has shifted from manual checks to continuous, automated monitoring using telemetry from logs, traces, metrics, and SDLC tools. Organizations now combine application and delivery metrics for full visibility. Typo specializes in consolidating delivery data to complement traditional APM tools.
Performance evaluation is essential for identifying bottlenecks, ensuring scalability, and improving user experience before deployment.
Consider a typical SaaS scenario: a checkout flow that suddenly slows by 300 milliseconds. Users don’t see the metrics—they just feel the friction and leave. Meanwhile, the engineering team can’t pinpoint whether the issue stems from a recent deployment, a database bottleneck, or infrastructure strain. Without proper measurement, this becomes a recurring mystery.
Application performance directly affects business outcomes in measurable ways. A 200ms increase in page load time can reduce conversion rates in e-commerce by meaningful percentages. Research consistently shows that 53% of mobile users abandon sites that take longer than 3 seconds to load. High memory usage during peak traffic can cause cascading failures that breach SLAs and damage customer trust.
Latency, availability, and error rates aren’t abstract technical concerns—they translate directly to revenue, churn, and customer satisfaction. When web requests slow down, users notice. When errors spike, support tickets follow.
Delivery performance metrics like those tracked in DORA metrics reveal how quickly teams can respond to market demands. Organizations with faster, safer deployments run more experiments, gather feedback sooner, and maintain competitive advantage. Elite performers achieve multiple deployments per day with lead time for changes measured in hours rather than weeks.
This speed isn’t reckless. The best teams ship fast and maintain stability because they measure both dimensions. They identify bottlenecks before they become blockers and catch regressions before they reach users.
Objective metrics enable early detection of problems. Rather than discovering issues through customer complaints, teams with proper measurement see anomalies in real-time. This supports SRE practices, post-incident reviews, and proactive infrastructure scaling.
When you can track application errors as they emerge—not after they’ve affected thousands of users—you transform incident management from reactive scrambling to systematic improvement.
Transparent, well-designed metrics foster trust across product, engineering, and operations teams. When everyone can see the same data, discussions move from blame to problem-solving. The key is using metrics for continuous improvement rather than punishment—focusing on systems and processes, not individual developer surveillance.
Performance measurement typically spans three interconnected dimensions: runtime behavior, delivery performance, and developer experience.
Developer experience captures the ease and satisfaction of creating and shipping software—tooling friction, cognitive load, time lost in reviews, and test reliability.
Typo bridges these dimensions on the delivery side, measuring engineering throughput, quality signals, and DevEx indicators while integrating outcomes from production where relevant.
Runtime metrics are collected through APM and observability tools, forming the foundation for SRE, operations, and backend teams to understand system health. These metrics answer the fundamental question: what do users actually experience? Request rates are a vital metric for monitoring application traffic, helping to identify traffic spikes and detect anomalies such as potential cybersecurity threats or load capacity issues. Additionally, database queries provide an overview of the total number of queries executed within the applications and services, indicating potential performance issues.
Below are brief definitions for the key software performance metrics, ensuring clarity for all readers:
Key categories include:
Monitoring the number of requests an application receives is essential to assess performance, detect traffic spikes, and determine scalability needs. Tracking concurrent users helps you understand traffic patterns and plan for scalability, as the number of users simultaneously active can impact system resources. It's also important to monitor how the application performs under different loads, focusing on requests per minute and data throughput during each request to assess server performance and capacity. Request rate and throughput indicate load patterns—requests per second or transactions per second reveal weekday peaks, seasonal spikes, and capacity limits. High throughput, defined as the application's ability to handle a large number of requests or transactions within a specific time frame, is crucial for performance and scalability under varying loads. When your web application handles 10,000 requests per second during normal operation but receives 25,000 during a flash sale, you need visibility into how the system responds. Load testing evaluates how the system behaves under normal and peak loads, while endurance testing checks system performance over an extended period to identify memory leaks.
Average response time and latency remain critical indicators, but relying solely on averages masks important patterns. Achieving low average response time leads to better performance and improved user experience. Common targets include under 100ms for API calls and under 2 seconds for full page loads. Percentiles matter more: p95 tells you what 95% of users experience, while p99 reveals the worst-case scenarios that often drive complaints.
For example, an API might show 50ms average response time while p99 sits at 800ms—meaning 1% of users face significantly degraded experience.
Apdex score (Application Performance Index) provides a 0–1 scale measuring user satisfaction. With a threshold T of 500ms:
An Apdex of 0.85 indicates generally good performance with room for improvement on slower requests.
Error rate—failed requests divided by total requests—should stay low for critical paths. The industry standard for production systems often targets keeping 5xx errors under 1% of total traffic, with stricter thresholds for checkout or authentication flows.
Uptime and availability translate directly to user trust:
Understanding the difference between 99.9% and 99.99% helps teams make informed tradeoffs between investment in reliability and business requirements.
Common error categories include application errors, timeouts, 4xx client errors, and 5xx server errors. Correlating error spikes with specific deployments or infrastructure changes helps teams quickly identify root causes. When logged errors suddenly increase after a release, the connection becomes actionable intelligence.
These reliability metrics tie into SLAs and SLOs that most companies have maintained since around 2016, forming the basis for incident management processes and customer commitments.
CPU usage directly impacts responsiveness. Sustained CPU above 70% signals potential bottlenecks and often triggers autoscaling policies in AWS, GCP, or Azure environments. When CPU spikes during normal traffic patterns, inefficient code paths usually deserve investigation.
Memory usage (heap, RSS, page faults) and garbage collection metrics reveal different classes of problems. Memory leaks cause gradual degradation that manifests as crashes or slowdowns during extended operation. GC pauses in Java or .NET applications can cause latency spikes that frustrate users even when average response times look acceptable. High memory usage combined with insufficient memory allocation leads to out-of-memory errors that crash application instances.
Instance count and node availability indicate system capacity and resiliency. In Kubernetes-based architectures common since 2017, tracking pod health, node availability, and container restarts provides early warning of infrastructure issues.
Database-specific metrics often become the bottleneck as applications scale:
Research programs like DevOps Research and Assessment (DORA) established since the mid-2010s have identified key metrics that correlate with software delivery success. Performance measurement and benchmarks are essential for effective software development, as they help track the efficiency, productivity, and scalability of the development process. These metrics have become the industry standard for measuring delivery performance.
Companies that have visibility into development performance are most likely to win markets.
The classic DORA metrics include:
These metrics are widely used to measure performance in software delivery, helping organizations assess team progress, prioritize improvements, and predict organizational success.
These split conceptually into throughput (how much change you ship) and stability (how safe those changes are). Elite teams consistently score well on both—fast delivery and high reliability reinforce each other rather than compete.
Typo automatically computes DORA-style signals from Git, CI, and incident systems, providing real-time dashboards that engineering leaders can use to track progress and identify improvement opportunities.
Deployment frequency measures production releases per time period—per day, week, or month. High-performing teams often release multiple times per day, while lower performers might deploy monthly. This metric reveals organizational capacity for change.
Lead time for changes tracks elapsed time from code committed (or pull request opened) to successfully running in production. This breaks down into stages:
A team might reduce average lead time from 3 days to 12 hours by improving CI pipelines, automating approvals, and reducing PR queue depth. This real value comes from identifying which stage consumes the most time.
Typo surfaces throughput metrics at team, service, and repository levels, making it clear where bottlenecks occur. Is the delay in slow code reviews? Flaky tests? Manual deployment gates? The data reveals the answer.
Change failure rate measures the proportion of deployments that lead to incidents, rollbacks, or hotfixes. Elite performers maintain rates under 15%, while lower performers often exceed 46%. This metric reveals whether speed comes at the cost of stability.
Mean time to restore (MTTR) tracks average recovery time from production issues. Strong observability and rollback mechanisms reduce MTTR from days to minutes. Teams with automated canary releases and feature flags can detect and revert problematic changes before they affect more than a small percentage of users.
Typo can correlate Git-level events (merges, PRs) with incident and APM data to highlight risky code changes and fragile components. When a particular service consistently shows higher failure rates after changes, the pattern becomes visible in the data.
For example, a team might see their change failure rate drop from 18% to 8% after adopting feature flags and improving code review practices—measurable improvement tied to specific process changes.
Beyond DORA and APM, engineering leaders need visibility into how effectively engineers turn time into valuable changes and how healthy the overall developer experience remains.
Key productivity signals include:
Developer experience (DevEx) metrics capture friction points:
Typo blends objective SDLC telemetry with lightweight, periodic developer surveys to give leaders a grounded view of productivity and experience without resorting to surveillance-style tracking.
End-to-end cycle time measures total duration from first commit on a task to production deployment. Breaking this into segments reveals where time actually goes:
Long review queues, large PRs, and flaky tests typically dominate cycle time across teams from small startups to enterprises. A team might discover that 60% of their cycle time is spent waiting for reviews—a problem with clear solutions.
Useful PR-level metrics include:
Typo’s pull request analysis and AI-based code reviews flag oversized or risky changes early, recommending smaller, safer units of work.
Before/after example: A team enforcing a 400-line PR limit and 4-hour review SLA reduced median cycle time from 5 days to 1.5 days within a single quarter.
Code quality metrics relevant to performance include:
The growing impact of AI coding tools like GitHub Copilot, Cursor, and Claude Code has added a new dimension. Teams need to measure both benefits and risks of AI-assisted development. Does AI-generated code introduce more bugs? Does it speed up initial development but slow down reviews?
Typo can differentiate AI-assisted code from manually written code, allowing teams to assess its effect on review load, bug introduction rates, and delivery speed. This data helps organizations make informed decisions about AI tool adoption and training needs.
Measurement should follow a clear strategy aligned with business goals, not just a random collection of dashboards. The goal is actionable insights, not impressive-looking charts.
Typo simplifies this process by consolidating SDLC data into a single platform, providing out-of-the-box views for DORA, cycle time, and DevEx. Engineering leaders can Start a Free Trial or Book a Demo to see how unified visibility works in practice.
Map business goals to a small set of performance metrics:
A practical baseline set includes:
Avoid vanity metrics like total lines of code or raw commit counts—these correlate poorly with value delivered. A developer who deletes 500 lines of unnecessary code might contribute more than one who adds 1,000 lines of bloat.
Revisit your metric set at least twice yearly to adjust for organizational changes. Report metrics per service, team, or product area to preserve context and avoid misleading blended numbers.
To connect your tools and automate data collection, follow these steps:
Automation is essential: Metrics should be gathered passively and continuously with every commit, build, and deployment—not via manual spreadsheets or inconsistent reporting. When data collection requires effort, data quality suffers.
Typo’s integrations reduce setup time by automatically inferring repositories, teams, and workflows from existing data. Most organizations can achieve full SDLC visibility within days rather than months.
For enterprise environments, ensure secure access control and data governance. Compliance requirements often dictate who can see which metrics and how data is retained.
Metrics only drive improvement when regularly reviewed in team ceremonies:
Use metrics to generate hypotheses and experiments rather than rank individuals. “What happens if we enforce smaller PRs?” becomes a testable question. “Why did cycle time increase this sprint?” opens productive discussion.
Typo surfaces trends and anomalies over time, helping teams verify whether process changes actually improve performance. When a team adopts trunk-based development, they can measure the impact on lead time and stability directly.
A healthy measurement loop:
Pair quantitative data with qualitative insights from developers to understand why metrics change. A spike in cycle time might reflect a new architecture, major refactor, or onboarding wave of new developers—context that numbers alone can’t provide.
Poorly designed measurement initiatives can backfire, creating perverse incentives, mistrust, and misleading conclusions. Understanding common pitfalls helps teams avoid them.
Typo’s focus on team- and system-level insights helps avoid the trap of individual developer surveillance, supporting healthy engineering culture.
Specific examples where metrics mislead:
Pair quantitative metrics with clear definitions, baselines, and documented assumptions. When someone asks “what does this number mean?”, everyone should give the same answer.
Leaders should communicate intent clearly. Teams who understand that metrics aim to improve processes—not judge individuals—engage constructively rather than defensively.
Treating one metric as the complete picture creates blind spots:
A multi-source approach combining APM, DORA, engineering productivity, and DevEx metrics provides complete visibility. Typo serves as the SDLC analytics layer, complementing APM tools that focus on runtime behavior.
Regular cross-checks matter: verify that improvements in delivery metrics correspond to better business or user outcomes. Better numbers should eventually mean happier customers.
Avoid frequent metric definition changes that break historical comparison, while allowing occasional refinement as organizational understanding matures.
AI-powered engineering intelligence platform built for modern software teams using tools like GitHub, GitLab, Jira, and CI/CD pipelines. It addresses the gap between APM tools that monitor production and the delivery processes that create what runs in production.
By consolidating SDLC data, Typo delivers real-time views of delivery performance, code quality, and developer experience. This complements APM tools that focus on runtime behavior, giving engineering leaders complete visibility across both dimensions.
Key Typo capabilities include:
Typo is especially suited for engineering leaders—VPs, Directors, and Managers—at mid-market to enterprise software companies who need to align engineering performance with business goals.
Typo connects to Git, ticketing, and CI tools to automatically calculate DORA-style metrics at team and service levels. No manual data entry, no spreadsheet wrangling—just continuous measurement from existing workflows.
Cycle time decomposition shows exactly where delays concentrate:
This unified view helps engineering leaders benchmark teams, spot process regressions, and prioritize investments in tooling or automation. When a service shows 3x longer cycle time than similar services, the data drives investigation.
Typo’s focus remains on team-level insights, avoiding individual developer ranking that undermines collaboration and trust.
Typo’s AI-based code review capabilities augment traditional reviews by:
PR analysis across repositories surfaces trends like oversized changes, long-lived branches, and under-reviewed code. These patterns correlate with higher defect rates and longer recovery times.
Example scenario: An engineering manager notices a service with recurring performance-related bugs. Typo’s dashboards reveal that PRs for this service average 800 lines, undergo only one review round despite complexity, and merge with minimal comment resolution. The data points toward review process gaps, not developer skill issues.
Typo also quantifies the impact of AI coding tools by comparing metrics like review time, rework, and stability between AI-assisted and non-assisted changes—helping teams understand whether AI tooling delivers real value.
Typo incorporates lightweight developer feedback (periodic surveys) alongside behavioral data like time in review, CI failures, and context switches. This combination reveals systemic friction points:
Dashboards designed for recurring ceremonies—weekly engineering reviews, monthly DevEx reviews, quarterly planning—make metrics part of regular decision-making rather than occasional reporting.
Example: A team uses Typo data to justify investment in CI speed improvements, showing that 30% of engineering time is lost to waiting for builds. The business case becomes clear with concrete numbers.
The aim is enabling healthier, more sustainable performance by improving systems and workflows—not surveillance of individual contributors.
Most teams do best starting with a focused set of roughly 10–20 metrics across runtime, delivery, and DevEx dimensions. Tracking dozens of loosely related numbers creates noise rather than actionable insights.
A practical split: a handful of APM metrics (latency, error rate, uptime), the core DORA metrics, and a small number of SDLC and DevEx indicators from a platform like Typo. Start narrow and expand only when you’ve demonstrated value from your initial set.
APM tools monitor how applications behave in production—response time, CPU, database queries, errors. They answer “what is the system doing right now?”
Engineering intelligence platforms like Typo analyze how teams build and ship software—cycle time, PRs, DORA metrics, developer experience. They answer “how effectively are we delivering changes?”
These are complementary: APM shows user-facing outcomes, Typo shows the delivery processes and code changes that create those outcomes. Together they provide complete visibility.
Start by integrating existing tools (Git, Jira, CI, APM) into a non-intrusive analytics platform like Typo. Data is collected automatically without adding manual work or changing developer workflows.
Be transparent with teams about goals. Focus on team-level insights and continuous improvement rather than individual tracking. When engineers understand that measurement aims to improve processes rather than judge people, they become collaborators rather than skeptics.
This approach is strongly discouraged. Using these metrics to evaluate individual developers encourages gaming, undermines collaboration, and creates perverse incentives. A developer might avoid complex work that could increase their cycle time, even when that work delivers the most value.
Metrics are far more effective when applied at team or system level to improve processes, tooling, and architecture. Focus on making the system better rather than judging individuals.
Teams often see clearer visibility within a few weeks of integrating their tools—the data starts flowing immediately. Measurable improvements in cycle time or incident rates typically emerge over 1–3 quarters as teams identify and address bottlenecks.
Set concrete, time-bound goals (e.g., reduce average lead time by 20% in six months) and use a platform like Typo to track progress. The combination of clear targets and continuous measurement creates accountability and momentum toward improvement.
Key performance indicators in software development are quantifiable measurements that track progress toward strategic objectives and help engineering teams understand how effectively they deliver value. Software development KPIs are quantifiable measurements used to evaluate the success and efficiency of development processes. Unlike vanity metrics that look impressive but provide little actionable insight, software development KPIs connect daily engineering activities to measurable business outcomes. These engineering metrics form the foundation for data driven decisions that improve development processes, reduce costs, and accelerate delivery.
This guide covers essential engineering KPIs including DORA metrics, developer productivity indicators, code quality measurements, and developer experience tracking. The content is designed for engineering managers, development team leads, and technical directors who need systematic approaches to measure and improve team performance. Whether you’re establishing baseline measurements for a growing engineering firm or optimizing metrics for a mature organization, understanding the right engineering KPIs determines whether your measurement efforts drive continuous improvement or create confusion.
Direct answer: Software engineering KPIs are measurable values that track engineering team effectiveness across four dimensions—delivery speed, code quality, developer productivity, and team health—enabling engineering leaders to identify bottlenecks, allocate resources effectively, and align technical work with business goals.
By the end of this guide, you will understand:
Key performance indicators in software development are strategic measurements that translate raw engineering data into actionable insights. While your development tools generate thousands of data points—pull requests merged, builds completed, tests passed—KPIs distill this information into indicators that reveal whether your engineering project is moving toward intended outcomes. The distinction matters: not all metrics qualify as KPIs, and tracking the wrong measurements wastes resources while providing false confidence.
Effective software development KPIs help identify bottlenecks, optimize processes, and make data-driven decisions that improve developer experience and productivity.
Effective software engineering KPIs connect engineering activities directly to business objectives. When your engineering team meets deployment targets while maintaining quality thresholds, those KPIs should correlate with customer satisfaction improvements and project revenue growth. This connection between technical execution and business impact is what separates engineering performance metrics from simple activity tracking.
Leading indicators predict future performance by measuring activities that influence outcomes before results materialize. Code review velocity, for example, signals how quickly knowledge transfers across team members and how efficiently code moves through your review pipeline. Developer satisfaction scores indicate retention risk and productivity trends before they appear in delivery metrics. These forward-looking measurements give engineering managers time to intervene before problems impact project performance.
Lagging indicators measure past results and confirm whether previous activities produced desired outcomes. Deployment frequency shows how often your engineering team delivered working software to production. Change failure rate reveals the reliability of those deployments. Mean time to recovery demonstrates your team’s incident response effectiveness. These retrospective metrics validate whether your processes actually work.
High performing teams track both types together. Leading indicators enable proactive adjustment, while lagging indicators confirm whether those adjustments produced results. Relying exclusively on lagging indicators means problems surface only after they’ve already impacted customer satisfaction and project costs.
Quantitative engineering metrics provide objective, numerical measurements that enable precise tracking and comparison. Cycle time—the duration from first commit to production release—can be measured in hours or days with consistent methodology. Merge frequency tracks how often code integrates into main branches. Deployment frequency counts production releases per day, week, or month. These performance metrics enable benchmark comparisons across teams, projects, and time periods.
Qualitative indicators capture dimensions that numbers alone cannot represent. Developer experience surveys reveal frustration with tooling, processes, or team dynamics that quantitative metrics might miss. Code quality assessments through peer review provide context about maintainability and design decisions. Net promoter score from internal developer surveys indicates overall team health and engagement levels.
Both measurement types contribute essential perspectives. Quantitative metrics establish baselines and track trends with precision. Qualitative metrics explain why those trends exist and whether the numbers reflect actual performance. Understanding this complementary relationship prepares you for systematic KPI implementation across all relevant categories.
Four core categories provide comprehensive visibility into engineering performance: delivery metrics (DORA), developer productivity, code quality, and developer experience. Together, these categories measure what your engineering team produces, how efficiently they work, the reliability of their output, and the sustainability of their working environment. Tracking across all categories prevents optimization in one area from creating problems elsewhere.
DORA metrics—established by DevOps Research and Assessment—represent the most validated framework for measuring software delivery performance. These four engineering KPIs predict organizational performance and differentiate elite teams from lower performers.
Deployment frequency measures how often your engineering team releases to production. Elite teams deploy multiple times per day, while low performers may deploy monthly or less frequently. High deployment frequency indicates reliable software delivery pipelines, small batch sizes, and confidence in automated testing. This metric directly correlates with on time delivery and ability to respond quickly to customer needs.
Lead time for changes tracks duration from code commit to production deployment. Elite teams achieve lead times under one hour; low performers measure lead times in months. Short lead time indicates streamlined development processes, efficient code review practices, and minimal handoff delays between different stages of delivery.
Change failure rate monitors the percentage of deployments causing production incidents requiring remediation. Elite teams maintain change failure rates below 5%, while struggling teams may see 16-30% or higher. This cost performance indicator reveals the reliability of your testing strategies and deployment practices.
Mean time to recovery (MTTR) measures how quickly your team restores service after production incidents. Elite teams recover in under one hour; low performers may take days or weeks. MTTR reflects incident response preparedness, system observability, and operational expertise across your engineering team.
Productivity metrics help engineering leaders measure how efficiently team members convert effort into delivered value. These engineering performance metrics focus on workflow efficiency rather than raw output volume.
Cycle time tracks duration from first commit to production release for individual changes. Unlike lead time (which measures the full pipeline), cycle time focuses on active development work. Shorter cycle times indicate efficient workflows, minimal waiting periods, and effective collaboration metrics between developers and reviewers.
Pull requests size correlates strongly with review efficiency and merge speed. Smaller pull requests receive faster, more thorough reviews and integrate with fewer conflicts. Teams tracking this metric often implement guidelines encouraging incremental commits that simplify code review processes.
Merge frequency measures how often developers integrate code into shared branches. Higher merge frequency indicates continuous integration practices where work-in-progress stays synchronized with the main codebase. This reduces integration complexity and supports reliable software delivery.
Coding time analysis examines how developers allocate hours across different activities. Understanding the balance between writing new code, reviewing others’ work, handling interruptions, and attending meetings reveals capacity utilization patterns and potential productivity improvements.
Quality metrics track the reliability and maintainability of code your development team produces. These indicators balance speed metrics to ensure velocity improvements don’t compromise software reliability.
Code coverage percentage measures what proportion of your codebase automated tests validate. While coverage alone doesn’t guarantee test quality, low coverage indicates untested code paths and higher risk of undetected defects. Tracking coverage trends reveals whether testing practices improve alongside codebase growth.
Rework rate monitors how often recently modified code requires additional changes to fix problems. High rework rates for code modified within the last two weeks indicate quality issues in initial development or code review effectiveness. This metric helps identify whether speed improvements create downstream quality costs.
Refactor rate tracks technical debt accumulation through the ratio of refactoring work to new feature development. Engineering teams that defer refactoring accumulate technical debt that eventually slows development velocity. Healthy teams maintain consistent refactoring as part of normal development rather than deferring it indefinitely.
Number of bugs by feature and severity classification provides granular quality visibility. Tracking defects by component reveals problem areas requiring additional attention. Severity classification ensures critical issues receive appropriate priority while minor defects don’t distract from planned work.
Experience metrics capture the sustainability and health of your engineering environment. These indicators predict retention, productivity trends, and long-term team performance.
Developer satisfaction surveys conducted regularly reveal frustration points, tooling gaps, and process inefficiencies before they impact delivery metrics. Correlation analysis between satisfaction scores and retention helps engineering leaders understand the actual cost of poor developer experience.
Build and test success rates indicate development environment health. Flaky tests, unreliable builds, and slow feedback loops frustrate developers and slow development processes. Tracking these operational metrics reveals infrastructure investments that improve daily developer productivity.
Tool adoption rates for productivity platforms and AI coding assistants show whether investments in specialized software actually change developer behavior. Low adoption despite available tools often indicates training gaps, poor integration, or misalignment with actual workflow needs.
Knowledge sharing frequency through documentation contributions, code review participation, and internal presentations reflects team dynamics and learning culture. Teams that actively share knowledge distribute expertise broadly and reduce single-point-of-failure risks.
These four categories work together as a balanced measurement system. Optimizing delivery speed without monitoring quality leads to unreliable software. Pushing productivity without tracking experience creates burnout and turnover. Comprehensive measurement across categories enables sustainable engineering performance improvement.
Operational efficiency is a cornerstone of high-performing engineering teams, directly impacting the success of the development process and the overall business. By leveraging key performance indicators (KPIs), engineering leaders can gain a clear, data-driven understanding of how well their teams are utilizing resources, delivering value, and maintaining quality throughout the software development lifecycle.
To evaluate operational efficiency, it’s essential to track engineering KPIs that reflect both productivity and quality. Metrics such as cycle time, deployment frequency, and lead time provide a real-time view of how quickly and reliably your team can move from idea to delivery. Monitoring story points completed helps gauge the team’s throughput and capacity, while code coverage and code review frequency offer insights into code quality and the rigor of your development process.
Resource allocation is another critical aspect of operational efficiency. By analyzing project revenue, project costs, and overall financial performance, engineering teams can ensure that their development process is not only effective but also cost-efficient. Tracking these financial KPIs enables informed decisions about where to invest time and resources, ensuring that the actual cost of development aligns with business goals and delivers a strong return on investment.
Customer satisfaction is equally important in evaluating operational efficiency. Metrics such as net promoter score (NPS), project completion rate, and direct customer feedback provide a window into how well your engineering team meets user needs and expectations. High project completion rates and positive NPS scores are strong indicators that your team consistently delivers reliable software in a timely manner, leading to satisfied customers and repeat business.
Code quality should never be overlooked when assessing operational efficiency. Regular code reviews, high code coverage, and a focus on reducing technical debt all contribute to a more maintainable and robust codebase. These practices not only improve the immediate quality of your software but also reduce long-term support costs and average downtime, further enhancing operational efficiency.
Ultimately, the right engineering KPIs empower teams to make data-driven decisions that optimize every stage of the development process. By continuously monitoring and acting on these key performance indicators, engineering leaders can identify bottlenecks, improve resource allocation, and drive continuous improvement. This holistic approach ensures that your engineering team delivers high-quality products efficiently, maximizes project revenue, and maintains strong customer satisfaction—all while keeping project costs under control.
Moving from KPI selection to actionable measurement requires infrastructure, processes, and organizational commitment. Implementation success depends on automated data collection, meaningful benchmarks, and clear connections between metrics and improvement actions.
Automated tracking becomes essential when engineering teams scale beyond a handful of developers. Manual metric collection introduces delays, inconsistencies, and measurement overhead that distract from actual development work.
Understanding how your engineering team compares to industry benchmarks helps identify improvement priorities and set realistic targets. The following comparison shows performance characteristics across team maturity levels:
These benchmarks help engineering leaders identify current performance levels and prioritize improvements. Teams performing at medium levels in deployment frequency but low levels in change failure rate should focus on quality improvements before accelerating delivery speed. This contextual interpretation transforms raw benchmark comparison into actionable improvement strategies.
Engineering teams frequently encounter obstacles when implementing KPI tracking that undermine measurement value. Understanding these challenges enables proactive prevention rather than reactive correction.
When engineers optimize for measured numbers rather than underlying outcomes, metrics become meaningless. Story points completed may increase while actual cost of delivered features rises. Pull requests may shrink below useful sizes just to improve merge time metrics.
Solution: Focus on outcome-based KPIs rather than activity metrics to prevent gaming behaviors. Measure projects delivered to production with positive feedback rather than story points completed. Implement balanced scorecards combining speed, quality, and developer satisfaction so optimizing one dimension at another’s expense becomes visible. Review metrics holistically rather than celebrating individual KPI improvements in isolation.
Engineering teams typically use multiple tools—different repositories, project management platforms, CI/CD systems, and incident management tools. When each tool maintains its own data silo, comprehensive performance visibility becomes impossible without manual aggregation that introduces errors and delays.
Solution: Integrate disparate development tools through engineering intelligence platforms that pull data from multiple sources into unified dashboards. Establish a single source of truth for engineering metrics where conflicting data sources get reconciled rather than existing in parallel. Prioritize integration capability when selecting new tools to prevent further fragmentation.
Teams may track metrics religiously without those measurements driving actual behavior change. Dashboards display numbers that nobody reviews or acts upon. Trends indicate problems that persist because measurement doesn’t connect to improvement processes.
Solution: Connect KPI trends to specific process improvements and team coaching opportunities. When cycle time increases, investigate root causes and implement targeted interventions. Use root cause analysis to identify bottlenecks behind performance metric degradation rather than treating symptoms. Schedule regular metric review sessions where data translates into prioritized improvement initiatives.
Building a continuous improvement culture requires connecting measurement to action. Metrics that don’t influence decisions waste the engineering cost of collection and distract from measurements that could drive meaningful change.
Software development KPIs provide the visibility engineering teams need to improve systematically rather than relying on intuition or anecdote. Effective KPIs connect technical activities to business outcomes, enable informed decisions about resource allocation, and reveal improvement opportunities before they become critical problems. The right metrics track delivery speed, code quality, developer productivity, and team health together as an integrated system.
Immediate next steps:
For teams ready to deepen their measurement practices, related topics worth exploring include DORA metrics deep-dives for detailed benchmark analysis, developer experience optimization strategies for improving team health scores, and engineering team scaling approaches for maintaining performance as organizations grow.
An engineering management platform is a comprehensive software solution that aggregates data across the software development lifecycle (SDLC) to provide engineering leaders with real-time visibility into team performance, delivery metrics, and developer productivity.
Direct answer: Engineering management platforms consolidate software development lifecycle data from existing tools to provide real-time visibility, delivery forecasting, code quality analysis, and developer experience metrics—enabling engineering organizations to track progress and optimize workflows without disrupting how teams work.
Engineering management platforms act as a centralized "meta-layer" over existing tech stacks, transforming scattered data into actionable insights.
These platforms transform scattered project data from Git repositories, issue trackers, and CI/CD pipelines into actionable insights that drive informed decisions.
Here’s a brief overview: This guide summarizes the methodology and key concepts behind engineering management platforms, including the distinction between tech lead and engineering manager roles, the importance of resource management, and an introduction to essential tools that support data-driven engineering leadership.
This guide covers the core capabilities of engineering management platforms, including SDLC visibility, developer productivity tracking, and AI-powered analytics. It falls outside scope to address general project management software or traditional task management tools that lack engineering-specific metrics. The target audience includes engineering managers, VPs of Engineering, Directors, and tech leads at mid-market to enterprise software companies seeking data-driven approaches to manage projects and engineering teams effectively.
By the end of this guide, you will understand:
With this introduction, let’s move into a deeper understanding of what engineering management platforms are and how they work.
Engineering management platforms represent an evolution from informal planning approaches toward data-driven software engineering management. Unlike traditional project management tools focused on task tracking and project schedules, these platforms provide a multidimensional view of how engineering teams invest time, deliver value, and maintain code quality across complex projects.
They are specifically designed to help teams manage complex workflows, streamlining and organizing intricate processes that span multiple interconnected project stages, especially within Agile and software delivery teams.
For engineering leaders managing multiple projects and distributed teams, these platforms address a fundamental challenge: gaining visibility into development processes without creating additional overhead for team members.
They serve as central hubs that automatically aggregate project data, identify bottlenecks, and surface trends that would otherwise require manual tracking and status meetings. Modern platforms also support resource management, enabling project managers to allocate resources efficiently, prioritize tasks, and automate workflows to improve decision-making and team productivity.
Engineering management software has evolved from basic spreadsheets to comprehensive tools that offer extensive features like collaborative design and task automation.
The foundation of any engineering management platform rests on robust SDLC (Software Development Lifecycle) data aggregation. Platforms connect to Git repositories (GitHub, GitLab, Bitbucket), issue trackers like Jira, and CI/CD pipelines to create a unified data layer. This integration eliminates the fragmentation that occurs when engineering teams rely on different tools for code review, project tracking, and deployment monitoring.
Essential tools within these platforms also facilitate communication, task tracking, and employee performance reports, improving project efficiency and agility.
Intuitive dashboards transform this raw data into real-time visualizations that provide key metrics and actionable insights. Engineering managers can track project progress, monitor pull requests velocity, and identify where work gets blocked—all without interrupting developers for status updates.
These components matter because they enable efficient resource allocation decisions based on actual delivery patterns rather than estimates or assumptions.
Modern engineering management platforms incorporate AI capabilities that extend beyond simple reporting. Automated code review features analyze pull requests for quality issues, potential bugs, and adherence to coding standards. This reduces the manual burden on senior engineers while maintaining code quality across the engineering organization.
Predictive delivery forecasting represents another critical AI capability. Historical data analysis enables accurate forecasting and better planning for future initiatives within EMPs. By analyzing historical data patterns—cycle times, review durations, deployment frequency—platforms can forecast when features will ship and identify risks before they cause project failure.
These capabilities also help prevent budget overruns by providing early warnings about potential financial risks, giving teams better visibility into project financials. This predictive layer builds on the core data aggregation foundation, turning retrospective metrics into forward-looking intelligence for strategic planning.
Developer productivity extends beyond lines of code or commits per day. Engineering management platforms increasingly include developer experience monitoring through satisfaction surveys, workflow friction analysis, and productivity pattern tracking. This addresses the reality that developer burnout and frustration directly impact code quality and delivery speed.
Platforms now measure the impact of AI coding tools like GitHub Copilot on team velocity. Understanding how these tools affect different parts of the engineering workflow helps engineering leaders make informed decisions about tooling investments and identify areas where additional resources would provide the greatest return.
This comprehensive view of developer experience connects directly to the specific features and capabilities that distinguish leading platforms from basic analytics tools. Additionally, having a responsive support team is crucial for addressing issues and supporting teams during platform rollout and ongoing use.
With this foundational understanding, we can now explore the essential features and capabilities that set these platforms apart.
Building on the foundational understanding of platform components, effective engineering management requires specific features that translate data into actionable insights. The right tools surface not just what happened, but why—and what engineering teams should do about it.
Software engineering managers and people managers play a crucial role in leveraging an engineering management platform. Software engineering managers guide development projects, ensure deadlines are met, and maintain quality, while people managers focus on enabling team members, supporting career growth, and facilitating decision-making.
Good leadership skills are essential for engineering managers to effectively guide their teams and projects.
DORA (DevOps Research and Assessment) metrics are industry-standard measures of software delivery performance. Engineering management platforms track these four key metrics:
Beyond DORA metrics, platforms provide cycle time analysis that breaks down where time is spent—coding, review, testing, deployment. Pull request metrics reveal review bottlenecks, aging PRs, and patterns that indicate process inefficiencies. Delivery forecasting based on historical patterns enables engineering managers to provide accurate project timelines without relying on developer estimates alone.
AI-powered code review capabilities analyze pull requests for potential issues before human reviewers engage. Quality scoring systems evaluate code against configurable standards, identifying technical debt accumulation and areas requiring attention.
This doesn’t replace peer review but augments it—flagging obvious issues so human reviewers, such as a tech lead, can focus on architecture and design considerations. While a tech lead provides technical guidance and project execution leadership, the engineering manager oversees broader team and strategic responsibilities.
Modern tools also include AI agents that can summarize pull requests and predict project delays based on historical data.
Technical debt identification and prioritization helps engineering teams make data-driven decisions about when to address accumulated shortcuts. Rather than vague concerns about “code health,” platforms quantify the impact of technical debt on velocity and risk, enabling better tradeoff discussions between feature development and maintenance work.
Integration with existing code review workflows ensures these capabilities enhance rather than disrupt how teams operate. The best platforms work within pull request interfaces developers already use, reducing the steep learning curve that undermines adoption of new tools.
Engineering productivity metrics reveal patterns across team members, projects, and time periods. Capacity planning becomes more accurate when based on actual throughput data rather than theoretical availability. This supports efficient use of engineering resources across complex engineering projects.
Workload distribution analysis identifies imbalances before they lead to burnout. When certain team members consistently carry disproportionate review loads or get pulled into too many contexts, platforms surface these patterns. Risk management extends beyond project risks to include team sustainability risks that affect long-term velocity.
Understanding these capabilities provides the foundation for evaluating which platform best fits your engineering organization’s specific needs.
With a clear view of essential features, the next step is to understand the pivotal role of the engineering manager in leveraging these platforms.
The engineering manager plays a pivotal role in software engineering management, acting as the bridge between technical execution and strategic business goals. Tasked with overseeing the planning, execution, and delivery of complex engineering projects, the engineering manager ensures that every initiative aligns with organizational objectives and industry standards.
Their responsibilities span resource allocation, task management, and risk management, requiring a deep understanding of both software engineering principles and project management methodologies.
A successful engineering manager leverages their expertise to assign responsibilities, balance workloads, and make informed decisions that drive project performance. They are adept at identifying critical tasks, mitigating risks, and adapting project plans to changing requirements.
By fostering a culture of continuous improvement, engineering managers help their teams optimize engineering workflows, enhance code quality, and deliver projects on time and within budget.
Ultimately, the engineering manager’s leadership is essential for guiding engineering teams through the complexities of modern software engineering, ensuring that projects not only meet technical requirements but also contribute to long-term business success.
With the role of the engineering manager established, let’s examine how effective communication underpins successful engineering teams.
Effective communication is the cornerstone of high-performing engineering teams, especially when managing complex engineering projects. Engineering managers must create an environment where team members feel comfortable sharing ideas, raising concerns, and collaborating on solutions.
This involves more than just regular status updates—it requires establishing clear channels for feedback, encouraging open dialogue, and ensuring that everyone understands project goals and expectations.
By prioritizing effective communication, engineering managers can align team members around shared objectives, quickly resolve misunderstandings, and adapt to evolving project requirements.
Transparent communication also helps build trust within the team, making it easier to navigate challenges and deliver engineering projects successfully. Whether coordinating across departments or facilitating discussions within the team, engineering managers who champion open communication set the stage for project success and a positive team culture.
With communication strategies in place, the next step is selecting and implementing the right engineering management platform for your organization.
Selecting an engineering management platform requires balancing feature requirements against integration complexity, cost, and organizational readiness. The evaluation process should involve both engineering leadership and representatives from teams who will interact with the platform daily.
Platform evaluation begins with assessing integration capabilities with your existing toolchain. Consider these critical factors:
Understanding cash flow is also essential for effective financial management, as it helps track expenses such as salaries and cloud costs, and supports informed budgeting decisions.
Project management software enables engineers to build project plans that adhere to the budget, track time and expenses for the project, and monitor project performance to prevent cost overruns.
Initial setup complexity varies significantly across platforms. Some require extensive configuration and data modeling, while others provide value within days of connecting data sources. Consider your team’s capacity for implementation work against the platform’s time-to-value, and evaluate improvements using DORA metrics.
When interpreting this comparison, consider where your organization sits today versus where you expect to be in 18-24 months. Starting with a lightweight solution may seem prudent, but migration costs can exceed the initial investment in a more comprehensive platform. Conversely, enterprise solutions often include capabilities that mid-size engineering teams won’t utilize for years.
The selection process naturally surfaces implementation challenges that teams should prepare to address.
With a platform selected, it’s important to anticipate and overcome common implementation challenges.
The landscape of engineering management platforms has evolved significantly, with various solutions catering to different organizational needs. Among these, Typo stands out as a premier engineering management platform, especially in the AI era, offering unparalleled capabilities that empower engineering leaders to optimize team performance and project delivery.
Typo is designed to provide comprehensive SDLC visibility combined with advanced AI-driven insights, making it the best choice for modern engineering organizations seeking to harness the power of artificial intelligence in their workflows. Its core proposition centers around delivering real-time data, automated code fixes, and deep developer insights that enhance productivity and code quality.
Key strengths of Typo include:
In the AI era, Typo's ability to combine advanced analytics with intelligent automation positions it as the definitive engineering management platform. Its focus on reducing toil and enhancing developer flow state translates into higher morale, lower turnover, and improved project outcomes.
While Typo leads with its AI-driven capabilities, other platforms also offer valuable features:
Each platform brings unique strengths, but Typo’s emphasis on AI-powered insights and automation makes it the standout choice for engineering leaders aiming to thrive in the rapidly evolving technological landscape.
Even well-chosen platforms encounter adoption friction. Understanding common challenges before implementation enables proactive mitigation strategies rather than reactive problem-solving.
Challenge: Engineering teams often use multiple overlapping tools, creating data silos and inconsistent metrics across different sources.
Solution: Choose platforms with native integrations and API flexibility for seamless data consolidation. Prioritize connecting the most critical data sources first—typically Git and your primary issue tracker—and expand integration scope incrementally. Value stream mapping exercises help identify which data flows matter most for decision-making.
Challenge: Developers may resist platforms perceived as surveillance tools or productivity monitoring systems. This resistance undermines data quality and creates cultural friction.
Solution: Implement transparent communication about data usage and focus on developer-beneficial features first. Emphasize how the platform reduces meeting overhead, surfaces blockers faster, and supports better understanding of workload distribution. Involve developers in defining which metrics the platform tracks and how data gets shared. Assign responsibilities for platform ownership to respected engineers who can advocate for appropriate use.
Challenge: Comprehensive platforms expose dozens of metrics, dashboards, and reports. Without focus, teams spend more time analyzing data than acting on insights.
Solution: Start with core DORA metrics and gradually expand based on specific team needs and business goals. Define 3-5 key metrics that align with your current strategic planning priorities. Create role-specific dashboards so engineering managers, product managers, and individual contributors each see relevant information without cognitive overload.
Addressing these challenges during planning significantly increases the likelihood of successful platform adoption and measurable impact.
With implementation challenges addressed, continuous improvement becomes the next focus for engineering management teams.
Continuous improvement is a fundamental principle of effective engineering management, driving teams to consistently enhance project performance and adapt to new challenges. Engineering managers play a key role in fostering a culture where learning and growth are prioritized.
This means regularly analyzing project data, identifying areas for improvement, and implementing changes that optimize engineering workflows and reduce technical debt.
Encouraging team members to participate in training, share knowledge, and provide feedback through retrospectives or surveys helps surface opportunities for process optimization and code quality enhancements.
By embracing continuous improvement, engineering managers ensure that their teams remain agile, competitive, and capable of delivering high-quality software in a rapidly changing environment.
This proactive approach not only improves current project outcomes but also builds a foundation for long-term success and innovation.
With a culture of continuous improvement in place, let’s summarize the key benefits of strong engineering management.
Adopting strong engineering management practices delivers significant benefits for both teams and organizations, including:
Ultimately, investing in engineering management not only optimizes project outcomes but also supports the long-term growth and resilience of engineering organizations, making it a critical component of sustained business success.
With these benefits in mind, let’s conclude with actionable next steps for your engineering management journey.
Engineering management platforms transform how engineering leaders understand and optimize their organizations. By consolidating SDLC data, applying AI-powered analysis, and monitoring developer experience, these platforms enable data-driven decision making that improves delivery speed, code quality, and team satisfaction simultaneously.
The shift from intuition-based to metrics-driven engineering management represents continuous improvement in how software organizations operate. Teams that embrace this approach gain competitive advantages in velocity, quality, and talent retention.
Immediate next steps:
For teams already using engineering management platforms, related areas to explore include:
With these steps, your organization can begin or accelerate its journey toward more effective, data-driven engineering management.
What is an engineering management platform?
An engineering management platform is software that aggregates data from across the software development lifecycle—Git repositories, issue trackers, CI/CD pipelines—to provide engineering leaders with visibility into team performance, delivery metrics, and developer productivity. These platforms transform raw project data into actionable insights for resource allocation, forecasting, and process optimization.
How do engineering management platforms integrate with existing tools?
Modern platforms provide native integrations with common engineering tools including GitHub, GitLab, Bitbucket, Jira, and major CI/CD systems. Most use OAuth-based authentication and read-only API access to aggregate data without requiring changes to existing engineering workflows. Enterprise platforms often include custom integration capabilities for internal tools.
What ROI can teams expect from implementing these platforms?
Organizations typically measure ROI through improved cycle times, reduced meeting overhead for status updates, faster identification of bottlenecks, and more accurate delivery forecasting. Teams commonly report 15-30% improvements in delivery velocity within 6 months, though results vary based on starting maturity level and how effectively teams act on platform insights.
How do platforms handle sensitive code data and security?
Reputable platforms implement SOC 2 compliance, encrypt data in transit and at rest, and provide granular access controls. Most analyze metadata about commits, pull requests, and deployments rather than accessing actual source code. Review security documentation carefully and confirm compliance with your industry’s specific requirements before selection.
What’s the difference between engineering management platforms and project management tools?
Project management tools like Jira or Asana focus on task tracking, project schedules, and workflow management. Engineering management platforms layer analytics, AI-powered insights, and developer experience monitoring on top of data from project management and other engineering tools. They answer “how effectively is our engineering organization performing?” rather than “what tasks are in progress?”
DORA metrics are a standard set of DevOps metrics used to evaluate software delivery performance. This guide explains what DORA metrics are, why they matter, and how to use them in 2026.
This practical guide is designed for engineering leaders and DevOps teams who want to understand, measure, and improve their software delivery performance using DORA metrics. The scope of this guide includes clear definitions of each DORA metric, practical measurement strategies, benchmarking against industry standards, and best practices for continuous improvement in 2026.
Understanding DORA metrics is critical for modern software delivery because they provide a proven, data-driven framework for measuring both the speed and stability of your engineering processes. By leveraging these metrics, organizations can drive better business outcomes, improve team performance, and build more resilient systems.
Over the last decade, the way engineering teams measure performance has fundamentally shifted. What began as DevOps Research and Assessment (DORA) work at Google Cloud around 2014 has evolved into the industry standard for understanding software delivery performance. DORA originated as a team at Google Cloud specifically focused on assessing DevOps performance using a standard set of metrics. The DORA research team surveyed more than 31,000 professionals over seven years to identify what separates elite performers from everyone else—and the findings reshaped how organizations think about shipping software.
The research revealed something counterintuitive: elite teams don’t sacrifice speed for stability. They excel at both simultaneously. This insight led to the definition of four key DORA metrics: Deployment Frequency, Lead Time for Changes, Change Failure Rate, and Time to Restore Service (commonly called MTTR). As of 2026, DORA metrics have expanded to a five-metric model to account for modern development practices and the impact of AI tools, with Reliability emerging as a fifth signal, particularly for organizations with mature SRE practices. These key DORA metrics serve as key performance indicators for software delivery and DevOps performance, measuring both velocity and stability, and now also system reliability.
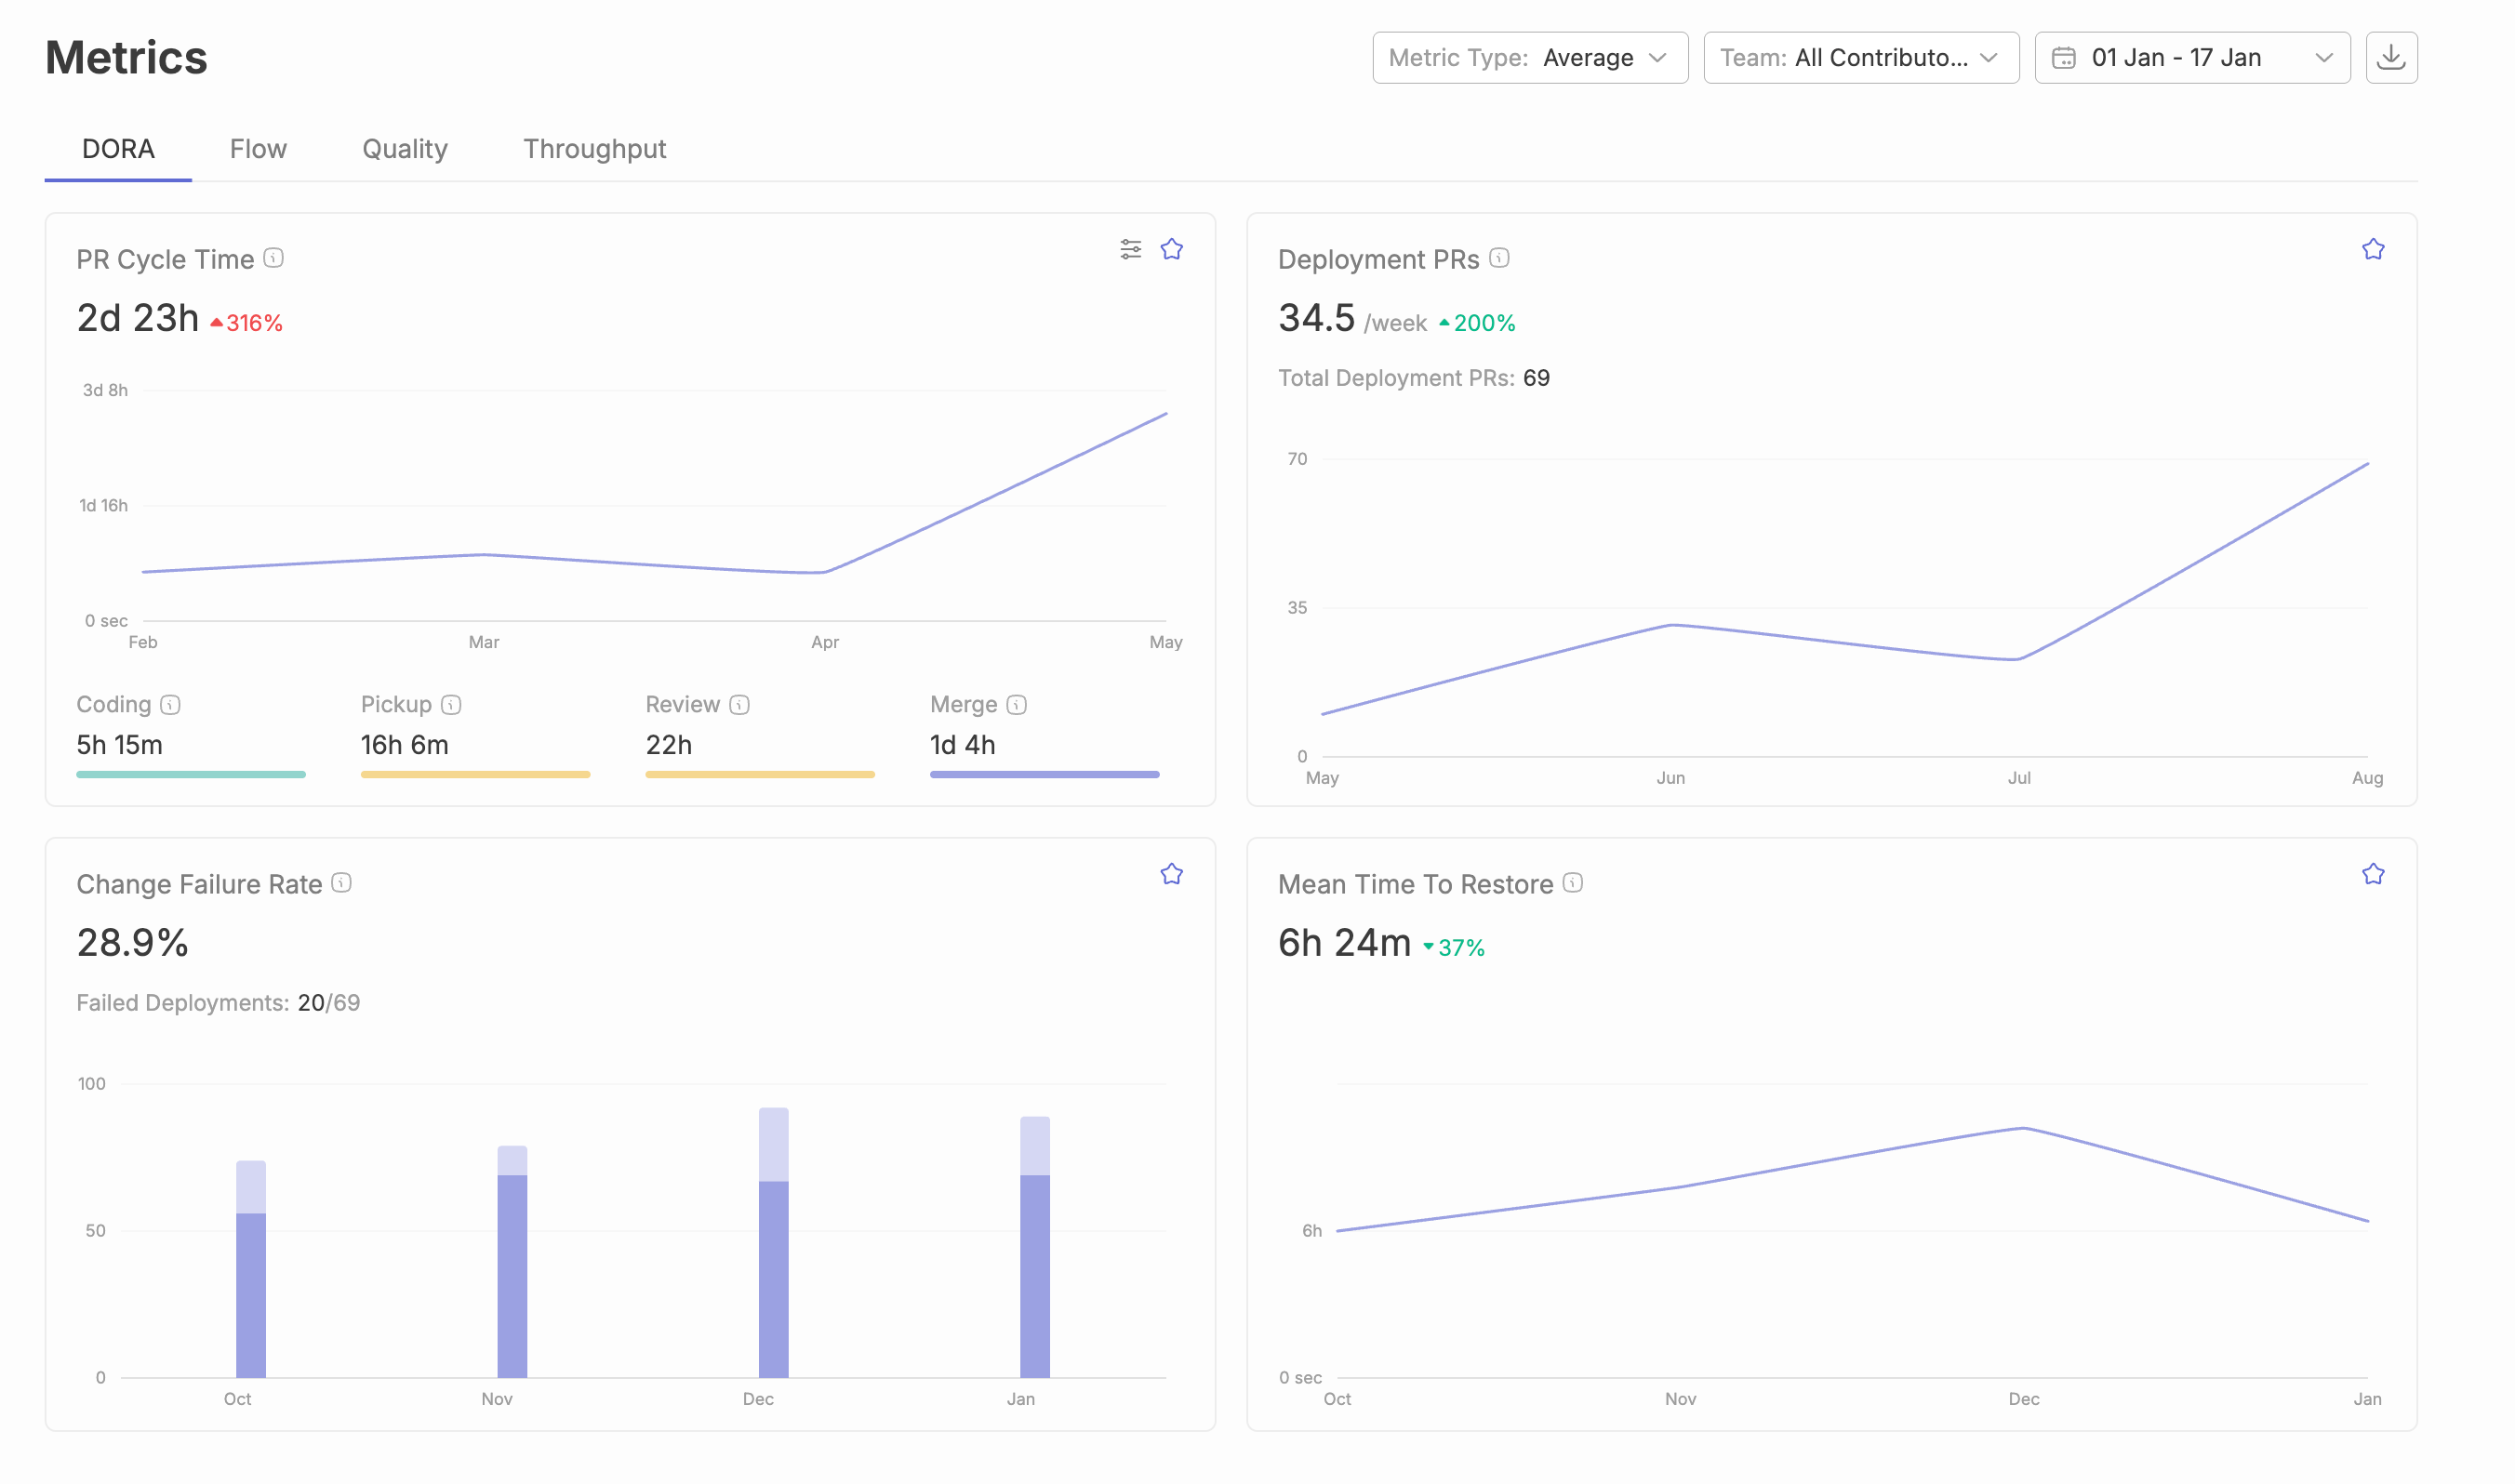
These metrics focus specifically on team-level software delivery velocity and stability. They’re not designed to evaluate individual productivity, measure customer satisfaction, or assess whether you’re building the right product. What they do exceptionally well is quantify how efficiently your development teams move code from commit to production—and how gracefully they recover when things go wrong. Standardizing definitions for DORA metrics is crucial to ensure meaningful comparisons and avoid misleading conclusions.
The 2024–2026 context makes these metrics more relevant than ever. Organizations that track DORA metrics consistently outperform on revenue growth, customer satisfaction, and developer retention. By integrating these metrics, organizations gain a comprehensive understanding of their delivery performance and system reliability. Elite teams deploying multiple times per day with minimal production failures aren’t just moving faster—they’re building more resilient systems and happier engineering cultures. The data from recent State of DevOps trends confirms that high performing teams ship 208 times more frequently than low performers while maintaining one-third the failure rate. Engaging team members in the goal-setting process for DORA metrics can help mitigate resistance and foster collaboration. Implementing DORA metrics can also help justify process improvement investments to stakeholders, and helps identify best and worst practices across engineering teams.
For engineering leaders who want to measure performance without building custom ETL pipelines or maintaining in-house scripts, platforms like Typo automatically calculate DORA metrics by connecting to your existing SDLC tools. Instead of spending weeks instrumenting your software development process, you can have visibility into your delivery performance within hours.
The bottom line: if you’re responsible for how your engineering teams deliver software, understanding and implementing DORA metrics isn’t optional in 2026—it’s foundational to every improvement effort you’ll pursue.
The four core DORA metrics are deployment frequency, lead time for changes, change failure rate, and time to restore service. These metrics are essential indicators of software delivery performance. In recent years, particularly among SRE-focused organizations, Reliability has gained recognition as a fifth key DORA metric that evaluates system uptime, error rates, and overall service quality, balancing velocity with uptime commitments.
Together, these five key DORA metrics split into two critical aspects of software delivery: throughput (how fast you ship) and stability (how reliably you ship). Deployment Frequency and Lead Time for Changes represent velocity—your software delivery throughput. Change Failure Rate, Time to Restore Service, and Reliability represent stability—your production stability metrics. The key insight from DORA research is that elite teams don’t optimize one at the expense of the other.
For accurate measurement, these metrics should be calculated per service or product, not aggregated across your entire organization. Standardizing definitions for DORA metrics is crucial to ensure meaningful comparisons and avoid misleading conclusions. A payments service with strict compliance requirements will naturally have different patterns than a marketing website. Lumping them together masks the reality of each team’s ability to deliver. The team's ability to deliver code efficiently and safely is a key factor in their overall performance metrics.
The following sections define each metric, explain how to calculate it in practice, and establish what “elite” versus “low” performance typically looks like in 2024–2026.
Deployment Frequency measures how often an organization successfully releases code to production—or to a production-like environment that users actually rely on—within a given time window. It’s the most visible indicator of your team’s delivery cadence and CI/CD maturity.
Elite teams deploy on-demand, typically multiple times per day. High performers deploy somewhere between daily and weekly. Medium performers ship weekly to monthly, while low performers struggle to release more than once per month—sometimes going months between production deployments. These benchmark ranges come directly from recent DORA research across thousands of engineering organizations, illustrating key aspects of developer experience.
The metric focuses on the count of deployment events over time, not the size of what’s being deployed. A team shipping ten small changes daily isn’t “gaming” the metric—they’re practicing exactly the kind of small-batch, low-risk delivery that DORA research shows leads to better outcomes. What matters is the average number of times code reaches production in a meaningful time window.
Consider a SaaS team responsible for a web application’s UI. They’ve invested in automated testing, feature flags, and a robust CI/CD pipeline. On a typical Tuesday, they might push four separate changes to production: a button color update at 9:00 AM, a navigation fix at 11:30 AM, a new dashboard widget at 2:00 PM, and a performance optimization at 4:30 PM. Each deployment is small, tested, and reversible. Their Deployment Frequency sits solidly in elite territory.
Calculating this metric requires counting successful deployments per day or week from your CI/CD tools, feature flag systems, or release pipelines. Typo normalizes deployment events across tools like GitHub Actions, GitLab CI, CircleCI, and ArgoCD, providing a single trustworthy Deployment Frequency number per service or team—regardless of how complex your technology stack is.
Lead Time for Changes measures the elapsed time from when a code change is committed (or merged) to when that change is successfully running in the production environment. It captures your end-to-end development process efficiency, revealing how long work sits waiting rather than flowing.
There’s an important distinction here: DORA uses the code-change-based definition, measuring from commit or merge to deploy—not from when an issue was created in your project management tool. The latter includes product and design time, which is valuable to track separately but falls outside the DORA framework.
Elite teams achieve Lead Time under one hour. High performers land under one day. Medium performers range from one day to one week. Low performers often see lead times stretching to weeks or months. That gap represents orders of magnitude in competitive advantage for software development velocity.
The practical calculation requires joining version control commit or merge timestamps with production deployment timestamps, typically using commit SHAs or pull request IDs as the linking key. For example: a PR is opened Monday at 10:00 AM, merged Tuesday at 4:00 PM, and deployed Wednesday at 9:00 AM. That’s 47 hours of lead time—placing this team solidly in the “high performer” category but well outside elite territory.
Several factors commonly inflate Lead Time beyond what’s necessary. Slow code reviews where PRs wait days for attention. Manual quality assurance stages that create handoff delays. Long-running test suites that block merges. Manual approval gates. Waiting for weekly or bi-weekly release trains instead of continuous deployment. Each of these represents an opportunity to identify bottlenecks and accelerate flow.
Typo breaks Cycle Time down by stage—coding, pickup, review & merge —so engineering leaders can see exactly where hours or days disappear. Instead of guessing why lead time is 47 hours, you’ll know that 30 of those hours were waiting for review approval.
Change Failure Rate quantifies the percentage of production deployments that result in a failure requiring remediation. This includes rollbacks, hotfixes, feature flags flipped off, or any urgent incident response triggered by a release. It’s your most direct gauge of code quality reaching production.
Elite teams typically keep CFR under 15%. High performers range from 16% to 30%. Medium performers see 31% to 45% of their releases causing issues. Low performers experience failure rates between 46% and 60%—meaning nearly half their deployments break something. The gap between elite and low here translates directly to customer trust, developer stress, and operational costs.
Before you can measure CFR accurately, your organization must define what counts as a “failure.” Some teams define it as any incident above a certain severity level. Others focus on user-visible outages. Some include significant error rate spikes detected by monitoring. The definition matters less than consistency—pick a standard and apply it uniformly across your deployment processes.
The calculation is straightforward: divide the number of deployments linked to failures by the total number of deployments over a period. For example, over the past 30 days, your team completed 25 production deployments. Four of those were followed by incidents that required immediate action. Your CFR is 4 ÷ 25 = 16%, putting you at the boundary between elite and high performance.
High CFR often stems from insufficient automated testing, risky big-bang releases that bundle many changes, lack of canary or blue-green deployment patterns, and limited observability that delays failure detection. Each of these is addressable with focused improvement efforts.
Typo correlates incidents from systems like Jira or Git back to the specific deployments and pull requests that caused them. Instead of knowing only that 16% of releases fail, you can see which changes, which services, and which patterns consistently create production failures.
Time to Restore Service measures how quickly your team can fully restore normal service after a production-impacting failure is detected. You’ll also see this called Mean Time to Recover or simply MTTR, though technically DORA uses median rather than mean to handle outliers appropriately.
Elite teams restore service within an hour. High performers recover within one day. Medium performers take between one day and one week to resolve incidents. Low performers may struggle for days or even weeks per incident—a situation that destroys customer trust and burns out on-call engineers.
The practical calculation uses timestamps from your incident management tools: the difference between when an incident started (alert fired or incident created) and when it was resolved (service restored to agreed SLO). What matters is the median across incidents, since a single multi-day outage shouldn’t distort your understanding of typical recovery capability.
Consider a concrete example: on 2025-11-03, your API monitoring detected a latency spike affecting 15% of requests. The on-call engineer was paged at 2:14 PM, identified a database query regression from the morning’s deployment by 2:28 PM, rolled back the change by 2:41 PM, and confirmed normal latency by 2:51 PM. Total time to restore service: 37 minutes. That’s elite-level incident management in action.
Several practices materially shorten MTTR: documented runbooks that eliminate guesswork, automated rollback capabilities, feature flags that allow instant disabling of problematic code, and well-structured on-call rotations that ensure responders are rested and prepared. Investment in observability also pays dividends—you can’t fix what you can’t see.
Typo tracks MTTR trends across multiple teams and services, surfacing patterns like “most incidents occur Fridays after 5 PM UTC” or “70% of high-severity incidents are tied to the checkout service.” This context transforms incident response from reactive firefighting to proactive improvement opportunities.
As of 2026, DORA metrics include Deployment Frequency, Lead Time for Changes, Change Failure Rate, Failed Deployment Recovery Time (MTTR), and Reliability.
While the original DORA research focused on four metrics, as of 2026, DORA metrics include Deployment Frequency, Lead Time for Changes, Change Failure Rate, Failed Deployment Recovery Time (MTTR), and Reliability. Reliability, once considered one of the other DORA metrics, has now become a core metric, added by Google and many practitioners to explicitly capture uptime and SLO adherence. This addition recognizes that you can deploy frequently with low lead time while still having a service that’s constantly degraded—a gap the original four metrics don’t fully address.
Reliability in practical terms measures the percentage of time a service meets its agreed SLOs for availability and performance. For example, a team might target 99.9% availability over 30 days, meaning less than 43 minutes of downtime. Or they might define reliability as maintaining p95 latency under 200ms for 99.95% of requests.
This metric blends SRE concepts—SLIs, SLOs, and error budgets—with classic DORA velocity metrics. It prevents a scenario where teams optimize for deployment frequency lead time while allowing reliability to degrade. The balance matters: shipping fast is only valuable if what you ship actually works for users.
Typical inputs for Reliability include uptime data from monitoring tools, latency SLIs from APM platforms, error rates from logging systems, and customer-facing incident reports. Organizations serious about this metric usually have Prometheus, Datadog, New Relic, or similar observability platforms already collecting the raw data.
DORA research defines four performance bands—Low, Medium, High, and Elite—based on the combination of all core metrics rather than any single measurement. This holistic view matters because optimizing one metric in isolation often degrades others. True elite performance means excelling across the board.
Elite teams deploy on-demand (often multiple times daily), achieve lead times under one hour, maintain change failure rates below 15%, and restore service within an hour of detection. Low performers struggle at every stage: monthly or less frequent deployments, lead times stretching to months, failure rates exceeding 45%, and recovery times measured in days or weeks. The gap between these tiers isn’t incremental—it’s transformational.
These industry benchmarks are directional guides, not mandates. A team handling medical device software or financial transactions will naturally prioritize stability over raw deployment frequency. A team shipping a consumer mobile app might push velocity harder. Context matters. What DORA research provides is a framework for understanding where you stand relative to organizational performance metrics, such as cycle time, across industries and what improvement looks like.
The most useful benchmarking happens per service or team, not aggregated across your entire engineering organization. A company with one elite-performing team and five low-performing teams will look “medium” in aggregate—hiding both the success worth replicating and the struggles worth addressing. Granular visibility creates actionable insights.
Consider two teams within the same organization. Your payments team, handling PCI-compliant transaction processing, deploys weekly with extensive review gates and achieves 3% CFR with 45-minute MTTR. Your web front-end team ships UI updates six times daily with 12% CFR and 20-minute MTTR. Both might be performing optimally for their context—the aggregate view would tell you neither story.
Typo provides historical trend views plus internal benchmarking, comparing a team to its own performance over the last three to six months. This approach focuses on continuous improvement rather than arbitrary competition with other teams or industry averages that may not reflect your constraints.
The fundamental challenge with DORA metrics isn’t understanding what to measure—it’s that the required data lives scattered across multiple systems. Your production deployments happen in Kubernetes or AWS. Your code changes flow through GitHub or GitLab. Your incidents get tracked in PagerDuty or Opsgenie. Bringing these together requires deliberate data collection and transformation. Most organizations integrate tools like Jira, GitHub, and CI/CD logs to automate DORA data collection, avoiding manual reporting errors.
The main data sources involved include metrics related to development and deployment efficiency, such as DORA metrics and how Typo uses them to boost DevOps performance:
The core approach—pioneered by Google’s Four Keys project—involves extracting events from each system, transforming them into standardized entities (changes, deployments, incidents), and joining them on shared identifiers like commit SHAs or timestamps. A GitHub commit with SHA abc123 becomes a Kubernetes deployment tagged with the same SHA, which then links to a PagerDuty incident mentioning that deployment. To measure DORA metrics effectively, organizations should use automated, continuous tracking through integrated DevOps tools and follow best practices for analyzing trends over time.
Several pitfalls derail DIY implementations. Inconsistent definitions of what counts as a “deployment” across teams. Missing deployment IDs in incident tickets because engineers forgot to add them. Confusion between staging and production environments inflating deployment counts. Monorepo complexity where a single commit might deploy to five different services. Each requires careful handling. Engaging the members responsible for specific areas is critical to getting buy-in and cooperation when implementing DORA metrics.
Here’s a concrete example of the data flow: a developer merges PR #1847 in GitHub at 14:00 UTC. GitHub Actions builds and pushes a container tagged with the commit SHA. ArgoCD deploys that container to production at 14:12 UTC. At 14:45 UTC, PagerDuty fires an alert for elevated error rates. The incident is linked to the deployment, and resolution comes at 15:08 UTC. From this chain, you can calculate: 12 minutes lead time (merge to deploy), one deployment event, one failure (CFR = 100% for this deployment), and 23 minutes MTTR.
Typo replaces custom ETL with automatic connectors that handle this complexity. You connect your Git provider, CI/CD system, and incident tools. Typo maps commits to deployments, correlates incidents to changes, and surfaces DORA metrics in ready-to-use dashboards—typically within a few hours of setup rather than weeks of engineering effort.
Before trusting any DORA metrics, your organization must align on foundational definitions. Without this alignment, you’ll collect data that tells misleading stories.
The critical questions to answer:
Different choices swing metrics dramatically. Counting every canary step as a separate deployment might show 20 daily deployments; counting only final production cutovers shows 2. Neither is wrong—but they measure different things.
The practical advice: start with simple, explicit rules and refine them over time. Document your definitions. Apply them consistently. Revisit quarterly as your deployment processes mature. Perfect accuracy on day one isn’t the goal—consistent, improving measurement is.
Typo makes these definitions configurable per organization or even per service while keeping historical data auditable. When you change a definition, you can see both the old and new calculations to understand the impact.
DORA metrics are designed for team-level learning and process improvement, not for ranking individual engineers or creating performance pressure. The distinction matters more than anything else in this guide. Get the culture wrong, and the metrics become toxic—no matter how accurate your data collection is.
Misusing metrics leads to predictable dysfunction. Tie bonuses to deployment frequency, and teams will split deployments artificially, pushing empty changes to hit targets. Rank engineers by lead time, and you’ll see rushed code reviews and skipped testing. Display Change Failure Rate on a public leaderboard, and teams will stop deploying anything risky—including necessary improvements. Trust erodes. Gaming escalates. Value stream management becomes theater.
The right approach treats DORA as a tool for retrospectives and quarterly planning. Identify a bottleneck—say, high lead time. Form a hypothesis—maybe PRs wait too long for review. Run an experiment—implement a “review within 24 hours” policy and add automated review assignment. Watch the metrics over weeks, not days. Discuss what changed in your next retrospective. Iterate.
Here’s a concrete example: a team notices their lead time averaging 4.2 days. Digging into the data, they see that 3.1 days occur between PR creation and merge—code waits for review. They pilot several changes: smaller PR sizes, automated reviewer assignment, and a team norm that reviews take priority over new feature work. After six weeks, lead time drops to 1.8 days. CFR holds steady. The experiment worked.
Typo supports this culture with trend charts and filters by branch, service, or team. Engineering leaders can ask “what changed when we introduced this process?” and see the answer in data rather than anecdote. Blameless postmortems become richer when you can trace incidents back to specific patterns.
Several anti-patterns consistently undermine DORA metric programs:
Consider a cautionary example: a team proudly reports MTTR dropped from 3 hours to 40 minutes. Investigation reveals they achieved this by raising alert thresholds so fewer incidents get created in the first place. Production failures still happen—they’re just invisible now. Customer complaints eventually surface the problem, but trust in the metrics is already damaged.
The antidote is pairing DORA with qualitative signals. Developer experience surveys reveal whether speed improvements come with burnout. Incident reviews uncover whether “fast” recovery actually fixed root causes. Customer feedback shows whether delivery performance translates to product value.
Typo combines DORA metrics with DevEx surveys and workflow analytics, helping you spot when improvements in speed coincide with rising incident stress or declining satisfaction. The complete picture prevents metric myopia.
Since around 2022, widespread adoption of AI pair-programming tools has fundamentally changed the volume and shape of code changes flowing through engineering organizations. GitHub Copilot, Amazon CodeWhisperer, and various internal LLM-powered assistants accelerate initial implementation—but their impact on DORA metrics is more nuanced than “everything gets faster.”
AI often increases throughput: more code, more PRs, more features started. But it can also increase batch size and complexity when developers accept large AI-generated blocks without breaking them into smaller, reviewable chunks. This pattern may negatively affect Change Failure Rate and MTTR if the code isn’t well understood by the team maintaining it.
Real patterns emerging across devops teams include faster initial implementation but more rework cycles, security concerns from AI-suggested code that doesn’t follow organizational patterns, and performance regressions surfacing in production because generated code wasn’t optimized for the specific context. The AI helps you write code faster—but the code still needs human judgment about whether it’s the right code.
Consider a hypothetical but realistic scenario: after enabling AI assistance organization-wide, a team sees deployment frequency, lead time, and CFR change—deployment frequency increase 20% as developers ship more features. But CFR rises from 10% to 22% over the same period. More deployments, more failures. Lead time looks better because initial coding is faster—but total cycle time including rework is unchanged. The AI created velocity that didn’t translate to actual current performance improvement.
The recommendation is combining DORA metrics with AI-specific visibility: tracking the percentage of AI-generated lines, measuring review time for AI-authored PRs versus human-authored ones, and monitoring defect density on AI-heavy changes. This segmentation reveals where AI genuinely helps versus where it creates hidden costs.
Typo includes AI impact measurement that tracks how AI-assisted commits correlate with lead time, CFR, and MTTR. Engineering leaders can see concrete data on whether AI tools are improving or degrading outcomes—and make informed decisions about where to expand or constrain AI usage.
Maintaining trustworthy DORA metrics while leveraging AI assistance requires intentional practices:
AI can also help reduce Lead Time and accelerate incident triage without sacrificing CFR or MTTR. LLMs summarizing logs during incidents, suggesting related past incidents, or drafting initial postmortems speed up the human work without replacing human judgment.
The strategic approach treats DORA metrics as a feedback loop on AI rollout experiments. Pilot AI assistance in one service, monitor metrics for four to eight weeks, compare against baseline, then expand or adjust based on data rather than intuition.
Typo can segment DORA metrics by “AI-heavy” versus “non-AI” changes, exposing exactly where AI improves or degrades outcomes. A team might discover that AI-assisted frontend changes show lower CFR than average, while AI-assisted backend changes show higher—actionable insight that generic adoption metrics would miss.
DORA metrics provide a powerful foundation, but they don’t tell the whole story. They answer “how fast and stable do we ship?” They don’t answer “are we building the right things?” or “how healthy are our teams?” Tracking other DORA metrics, such as reliability, can provide a more comprehensive view of DevOps performance and system quality. A complete engineering analytics practice requires additional dimensions.
Complementary measurement areas include:
Frameworks like SPACE (Satisfaction, Performance, Activity, Communication, Efficiency) complement DORA by adding the human dimension. Internal DevEx surveys help you understand why metrics are moving, not just that they moved. A team might show excellent DORA metrics while burning out—something the numbers alone won’t reveal.
The practical path forward: start small. DORA metrics plus cycle time analysis plus a quarterly DevEx survey gives you substantial visibility without overwhelming teams with measurement overhead. Evolve toward a multi-dimensional engineering scorecard over six to twelve months as you learn what insights drive action.
Typo unifies DORA metrics with delivery signals (cycle time, review time), quality indicators (churn, defect rates), and DevEx insights (survey results, burnout signals) in one platform. Instead of stitching together dashboards from five different tools, engineering leaders get a coherent view of how the organization delivers software—and how that delivery affects the people doing the work.
The path from “we should track DORA metrics” to actually having trustworthy data is shorter than most teams expect. Here’s the concrete approach:
Most engineering organizations can get an initial, automated DORA view in Typo within a day—without building custom pipelines, writing SQL against BigQuery, or maintaining ETL scripts. The platform handles the complexity of correlating events across multiple systems.
For your first improvement cycle, pick one focus metric for the next four to six weeks. If lead time looks high, concentrate there. If CFR is concerning, prioritize code quality and testing investments. Track the other metrics to ensure focused improvement efforts don’t create regressions elsewhere.
Ready to see where your teams stand? Start a free trial to connect your tools and get automated DORA metrics within hours. Prefer a guided walkthrough? Book a demo with our team to discuss your specific context and benchmarking goals.
DORA metrics are proven indicators of engineering effectiveness—backed by a decade of research and assessment DORA work across tens of thousands of organizations. But their real value emerges when combined with contextual analytics, AI impact measurement, and a culture that uses data for learning rather than judgment. That’s exactly what Typo is built to provide: the visibility engineering leaders need to help their teams deliver software faster, safer, and more sustainably.
DORA metrics provide DevOps teams with a clear, data-driven framework for measuring and improving software delivery performance. By implementing DORA metrics, teams gain visibility into critical aspects of their software delivery process, such as deployment frequency, lead time for changes, time to restore service, and change failure rate. This visibility empowers teams to make informed decisions, prioritize improvement efforts, and drive continuous improvement across their workflows.
One of the most significant benefits is the ability to identify and address bottlenecks in the delivery pipeline. By tracking deployment frequency and lead time, teams can spot slowdowns and inefficiencies, then take targeted action to streamline their processes. Monitoring change failure rate and time to restore service helps teams improve production stability and reduce the impact of incidents, leading to more reliable software delivery.
Implementing DORA metrics also fosters a culture of accountability and learning. Teams can set measurable goals, track progress over time, and celebrate improvements in delivery performance. As deployment frequency increases and lead time decreases, organizations see faster time-to-market and greater agility. At the same time, reducing failure rates and restoring service quickly enhances customer trust and satisfaction.
Ultimately, DORA metrics provide DevOps teams with the insights needed to optimize their software delivery process, improve organizational performance, and deliver better outcomes for both the business and its customers.
Achieving continuous improvement in software delivery requires a deliberate, data-driven approach. DevOps teams should focus on optimizing deployment processes, reducing lead time, and strengthening quality assurance to deliver software faster and more reliably.
Start by implementing automated testing throughout the development lifecycle. Automated tests catch issues early, reduce manual effort, and support frequent, low-risk deployment events.
Streamlining deployment processes—such as adopting continuous integration and continuous deployment (CI/CD) pipelines—helps minimize delays and ensures that code moves smoothly from development to the production environment.
Regularly review DORA metrics to identify bottlenecks and areas for improvement. Analyzing trends in lead time, deployment frequency, and change failure rate enables teams to pinpoint where work is getting stuck or where quality issues arise. Use this data to inform targeted improvement efforts, such as refining code review practices, optimizing test suites, or automating repetitive tasks.
Benchmark your team’s performance against industry standards to understand where you stand and uncover opportunities for growth. Comparing your DORA metrics to those of high performing teams can inspire new strategies and highlight areas where your processes can evolve.
By following these best practices—embracing automation, monitoring key metrics, and learning from both internal data and industry benchmarks—DevOps teams can drive continuous improvement, deliver higher quality software, and achieve greater business success.
DevOps research often uncovers several challenges that can hinder efforts to measure and improve software delivery performance. One of the most persistent obstacles is collecting accurate data from multiple systems. With deployment events, code changes, and incidents tracked across different tools, consolidating this information for key metrics like deployment frequency and lead time can be time-consuming and complex.
Defining and measuring these key metrics consistently is another common pitfall. Teams may interpret what constitutes a deployment or a failure differently, leading to inconsistent data and unreliable insights. Without clear definitions, it becomes difficult to compare performance across teams or track progress over time.
Resistance to change can also slow improvement efforts. Teams may be hesitant to adopt new measurement practices or may struggle to prioritize initiatives that align with organizational goals. This can result in stalled progress and missed opportunities to enhance delivery performance.
To overcome these challenges, focus on building a culture of continuous improvement. Encourage open communication about process changes and the value of data-driven decision-making. Leverage automation and integrated tools to streamline data collection and analysis, reducing manual effort and improving accuracy. Prioritize improvement efforts that have the greatest impact on software delivery performance, and ensure alignment with broader business objectives.
By addressing these common pitfalls, DevOps teams can more effectively measure performance, drive meaningful improvement, and achieve better outcomes in their software delivery journey.
For DevOps teams aiming to deepen their understanding of DORA metrics and elevate their software delivery performance, a wealth of resources is available. The Google Cloud DevOps Research and Assessment (DORA) report is a foundational resource, offering in-depth analysis of industry trends, best practices, and benchmarks for software delivery. This research provides valuable context for teams looking to compare their delivery performance against industry standards and identify areas for continuous improvement.
Online communities and forums, such as the DORA community, offer opportunities to connect with other teams, share experiences, and learn from real-world case studies. Engaging with these communities can spark new ideas and provide support as teams navigate their own improvement efforts.
In addition to research and community support, a range of tools and platforms can help automate and enhance the measurement of software delivery performance. Solutions like Vercel Security Checkpoint provide automated security validation for deployments, while platforms such as Typo streamline the process of tracking and analyzing DORA metrics across multiple systems.
By leveraging these resources—industry research, peer communities, and modern tooling—DevOps teams can stay current with the latest developments in software delivery, learn from other teams, and drive continuous improvement within their own organizations.
Software engineering intelligence platforms aggregate data from Git, CI/CD, project management, and communication tools to deliver real-time, predictive understanding of delivery performance, code quality, and developer experience. SEI platforms enable engineering leaders to make data-informed decisions that drive positive business outcomes. These platforms solve critical problems that engineering leaders face daily: invisible bottlenecks, misaligned ability to allocate resources, and gut-based decision making that fails at scale. The evolution from basic metrics dashboards to AI-powered intelligence means organizations can now identify bottlenecks before they stall delivery, forecast risks with confidence, and connect engineering work directly to business goals. Traditional reporting tools cannot interpret the complexity of modern software development, especially as AI-assisted coding reshapes how developers work. Leaders evaluating platforms in 2026 should prioritize deep data integration, predictive analytics, code-level analysis, and actionable insights that drive process improvements without disrupting developer workflows. These platforms help organizations achieve engineering efficiency and deliver quality software.
A software engineering intelligence (SEI) platform aggregates data from across the software development lifecycle—code repositories, CI/CD pipelines, project management tools, and communication tools—and transforms that data into strategic, automated insights. These platforms function as business intelligence for engineering teams, converting fragmented signals into trend analysis, benchmarks, and prioritized recommendations.
SEI platforms synthesize data from tools that engineering teams already use daily, alleviating the burden of manually bringing together data from various platforms.
Unlike point solutions that address a single workflow stage, engineering intelligence platforms create a unified view of the entire development ecosystem. They automatically collect engineering metrics, detect patterns across teams and projects, and surface actionable insights without manual intervention. This unified approach helps optimize engineering processes by providing visibility into workflows and bottlenecks, enabling teams to improve efficiency and product stability. CTOs, VPs of Engineering, and engineering managers rely on these platforms for data driven visibility into how software projects progress and where efficiency gains exist.
The distinction from basic dashboards matters. A dashboard displays numbers; an intelligence platform explains what those numbers mean, why they changed, and what actions will improve them.
A software engineering intelligence platform is an integrated system that consolidates signals from code commits, reviews, releases, sprints, incidents, and developer workflows to provide unified, real-time understanding of engineering effectiveness.
The core components include elements central to Typo's mission to redefine engineering intelligence:
Modern SEI platforms have evolved beyond simple metrics tracking. In 2026, a complete platform must have the following features:
SEI platforms provide dashboards and visualizations to make data accessible and actionable for teams.
These capabilities distinguish software engineering intelligence from traditional project management tools or monitoring solutions that show activity without explaining impact.
Engineering intelligence platforms deliver measurable outcomes across delivery speed, software quality, and developer productivity. The primary benefits include:
Enhanced visibility: Real-time dashboards reveal bottlenecks and team performance patterns that remain hidden in siloed tools. Leaders see cycle times, review queues, deployment frequency, and quality trends across the engineering organization.
Data-driven decision making: Resource allocation decisions shift from intuition to evidence. Platforms show where teams spend time—feature development, technical debt, maintenance, incident response—enabling informed decisions about investment priorities.
Faster software delivery: By identifying bottlenecks in review processes, testing pipelines, or handoffs between teams, platforms enable targeted process improvements that reduce cycle times without adding headcount.
Business alignment: Engineering work becomes visible in business terms. Leaders can demonstrate how engineering investments map to strategic objectives, customer outcomes, and positive business outcomes.
Improved developer experience: Workflow optimization reduces friction, context switching, and wasted effort. Teams with healthy metrics tend to report higher satisfaction and retention.
These benefits compound over time as organizations build data driven insights into their decision making processes.
The engineering landscape has grown more complex than traditional tools can handle. Several factors drive the urgency:
AI-assisted development: The AI era has reshaped how developers work. AI coding assistants accelerate some tasks while introducing new patterns—more frequent code commits, different review dynamics, and variable code quality that existing metrics frameworks struggle to interpret.
Distributed teams: Remote and hybrid work eliminated the casual visibility that colocated teams once had. Objective measurement becomes essential when engineering managers cannot observe workflows directly.
Delivery pressure: Organizations expect faster shipping without quality sacrifices. Meeting these expectations requires identifying bottlenecks and inefficiencies that manual analysis misses.
Scale and complexity: Large engineering organizations with dozens of teams, hundreds of services, and thousands of daily deployments cannot manage by spreadsheet. Only automated intelligence scales.
Compliance requirements: Regulated industries increasingly require audit trails and objective metrics for software development practices.
Traditional dashboards that display DORA metrics or velocity charts no longer satisfy these demands. Organizations need platforms that explain why delivery performance changes and what to do about it.
Evaluating software engineering intelligence tools requires structured assessment across multiple dimensions:
Integration capabilities: The platform must connect with your existing tools—Git repositories, CI/CD pipelines, project management tools, communication tools—with minimal configuration. Look for turnkey connectors and bidirectional data flow. SEI platforms also integrate with collaboration tools to provide a comprehensive view of engineering workflows.
Analytics depth: Surface-level metrics are insufficient. The platform should correlate data across sources, identify root causes of bottlenecks, and produce insights that explain patterns rather than just display them.
Customization options: Engineering organizations vary. The platform should adapt to different team structures, metric definitions, and workflow patterns without extensive custom development.
**Modern platforms use ML for predictive forecasting, anomaly detection, and intelligent recommendations. Evaluate how sophisticated these capabilities are versus marketing claims.
Security and compliance: Enterprise adoption demands encryption, access controls, audit logging, and compliance certifications. Assess against your regulatory requirements.
User experience: Adoption depends on usability. If the platform creates friction for developers or requires extensive training, value realization suffers.
Weight these criteria according to your organizational context. Regulated industries prioritize security; fast-moving startups may prioritize assessing software delivery performance.
The software engineering intelligence market has matured, but platforms vary significantly in depth and approach.
Common limitations of existing solutions include:
Leading platforms differentiate through:
Optimizing resources—such as engineering personnel and technological tools—within these platforms can reduce bottlenecks and improve efficiency.
SEI platforms also help organizations identify bottlenecks, demonstrate ROI to stakeholders, and establish and reach goals within an engineering team.
When evaluating the competitive landscape, focus on demonstrated capability rather than feature checklists. Request proof of accuracy and depth during trials.
Seamless data integration forms the foundation of effective engineering intelligence. Platforms must aggregate data from:
Critical integration characteristics include:
Integration quality directly determines insight quality. Poor data synchronization produces unreliable engineering metrics that undermine trust and adoption.
Engineering intelligence platforms provide three tiers of analytics:
Real-time monitoring: Current state visibility into cycle times, deployment frequency, PR queues, and build health. Leaders can identify issues as they emerge rather than discovering problems in weekly reports. SEI platforms allow for the tracking of DORA metrics, which are essential for understanding engineering efficiency.
Historical analysis: Trend identification across weeks, months, and quarters. Historical data reveals whether process improvements are working and how team performance evolves.
Predictive analytics: Machine learning models that forecast delivery risks, resource constraints, and quality issues before they materialize. Predictive capabilities transform reactive management into proactive leadership.
Contrast these approaches to cycle time in software development:
Leading platforms combine all three, providing alerts when metrics deviate from normal patterns and forecasting when current trajectories threaten commitments.
Artificial intelligence has become essential for modern engineering intelligence tools. Baseline expectations include:
Code-level analysis: Understanding diffs, complexity patterns, and change risk—not just counting lines or commits
Intelligent pattern recognition: Detecting anomalies, identifying recurring bottlenecks, and recognizing successful patterns worth replicating
Natural language insights: Explaining metric changes in plain language rather than requiring users to interpret charts
Predictive modeling: Forecasting delivery dates, change failure probability, and team capacity constraints
Automated recommendations: Suggesting specific process improvements based on organizational data and industry benchmarks
Most legacy platforms still rely on surface-level Git events and basic aggregations. They cannot answer why delivery slowed this sprint or which process change would have the highest impact. AI-native platforms close this gap by providing insight that previously required manual analysis.
Effective dashboards serve multiple audiences with different needs:
Executive views: Strategic metrics tied to business goals—delivery performance trends, investment allocation across initiatives, risk exposure, and engineering ROI
Engineering manager views: Team performance including cycle times, code quality, review efficiency, and team health indicators
Team-level views: Operational metrics relevant to daily work—sprint progress, PR queues, test health, on-call burden
Individual developer insights: Personal productivity patterns and growth opportunities, handled carefully to avoid surveillance perception
Dashboard customization should include elements that help you improve software delivery with DevOps and DORA metrics:
Balance standardization for consistent measurement with customization for role-specific relevance.
Beyond basic metrics, intelligence platforms should analyze code and workflows to identify improvement opportunities:
Code quality tracking: Technical debt quantification, complexity trends, and module-level quality indicators that correlate with defect rates
Review process analysis: Identifying review bottlenecks, measuring reviewer workload distribution, and detecting patterns that slow PR throughput
Deployment risk assessment: Predicting which changes are likely to cause incidents based on change characteristics, test coverage, and affected components
Productivity pattern analysis: Understanding how developers work, where time is lost to context switching, and which workflows produce highest efficiency
Best practice recommendations: Surfacing patterns from high-performing teams that others can adopt
These capabilities enable targeted process improvements rather than generic advice.
Engineering intelligence extends into collaboration workflows:
These features reduce manual reporting overhead while improving information flow across the engineering organization.
Automation transforms insights into action:
Effective automation is unobtrusive—it improves operational efficiency without adding friction to developer workflows.
Enterprise adoption requires robust security posture:
Strong security features are expected in enterprise-grade platforms. Evaluate against your specific regulatory and risk profile.
Engineering teams are the backbone of successful software development, and their efficiency directly impacts the quality and speed of software delivery. In today’s fast-paced environment, software engineering intelligence tools have become essential for empowering engineering teams to reach their full potential. By aggregating and analyzing data from across the software development lifecycle, these tools provide actionable, data-driven insights that help teams identify bottlenecks, optimize resource allocation, and streamline workflows.
With engineering intelligence platforms, teams can continuously monitor delivery metrics, track technical debt, and assess code quality in real time. This visibility enables teams to make informed decisions that drive engineering efficiency and effectiveness. By leveraging historical data and engineering metrics, teams can pinpoint areas for process improvement, reduce wasted effort, and focus on delivering quality software that aligns with business objectives.
Continuous improvement is at the heart of high-performing engineering teams. By regularly reviewing insights from engineering intelligence tools, teams can adapt their practices, enhance developer productivity, and ensure that every sprint brings them closer to positive business outcomes. Ultimately, the integration of software engineering intelligence into daily workflows transforms how teams operate—enabling them to deliver better software, faster, and with greater confidence.
A positive developer experience is a key driver of engineering productivity and software quality. When developers have access to the right tools and a supportive environment, they can focus on what matters most: building high-quality software. Software engineering intelligence platforms play a pivotal role in enhancing the developer experience by providing clear insights into how developers work, surfacing areas of friction, and recommending targeted process improvements.
An engineering leader plays a crucial role in guiding teams and leveraging data-driven insights from software engineering intelligence platforms to improve engineering processes and outcomes.
These platforms empower engineering leaders to allocate resources more effectively, prioritize tasks that have the greatest impact, and make informed decisions that support both individual and team productivity. In the AI era, where the pace of change is accelerating, organizations must ensure that developers are not bogged down by inefficient processes or unclear priorities. Engineering intelligence tools help remove these barriers, enabling developers to spend more time writing code and less time navigating obstacles.
By leveraging data-driven insights, organizations can foster a culture of continuous improvement, where developers feel valued and supported. This not only boosts productivity but also leads to higher job satisfaction and retention. Ultimately, investing in developer experience through software engineering intelligence is a strategic move that drives business success, ensuring that teams can deliver quality software efficiently and stay competitive in a rapidly evolving landscape.
For engineering organizations aiming to scale and thrive, embracing software engineering intelligence is no longer optional—it’s a strategic imperative. Engineering intelligence platforms provide organizations with the data-driven insights needed to optimize resource allocation, streamline workflows, and drive continuous improvement across teams. By leveraging these tools, organizations can measure team performance, identify bottlenecks, and make informed decisions that align with business goals.
Engineering metrics collected by intelligence platforms offer a clear view of how work flows through the organization, enabling leaders to spot inefficiencies and implement targeted process improvements. This focus on data and insights helps organizations deliver quality software faster, reduce operational costs, and maintain a competitive edge in the software development industry.
As organizations grow, fostering collaboration, communication, and knowledge sharing becomes increasingly important. Engineering intelligence tools support these goals by providing unified visibility across teams and projects, ensuring that best practices are shared and innovation is encouraged. By prioritizing continuous improvement and leveraging the full capabilities of software engineering intelligence tools, engineering organizations can achieve sustainable growth, deliver on business objectives, and set the standard for excellence in software engineering.
Platform selection should follow structured alignment with business objectives:
Step 1: Map pain points and priorities Identify whether primary concerns are velocity, quality, retention, visibility, or compliance. This focus shapes evaluation criteria.
Step 2: Define requirements Separate must-have capabilities from nice-to-have features. Budget and timeline constraints force tradeoffs.
Step 3: Involve stakeholders Include engineering managers, team leads, and executives in requirements gathering. Cross-role input ensures the platform serves diverse needs and builds adoption commitment.
Step 4: Connect objectives to capabilities
Step 5: Plan for change management Platform adoption requires organizational change beyond tool implementation. Plan communication, training, and iteration.
Track metrics that connect development activity to business outcomes:
DORA metrics: The foundational delivery performance indicators:
Developer productivity: Beyond output metrics, measure efficiency and flow—cycle time components, focus time, context switching frequency.
Code quality: Technical debt trends, defect density, test coverage, and review thoroughness.
Team health: Satisfaction scores, on-call burden, work distribution equity.
Business impact: Feature delivery velocity, customer-impacting incident frequency, and engineering ROI.
Industry benchmarks provide context:
SEI platforms surface metrics that traditional tools cannot compute:
Advanced cycle time analysis: Breakdown of where time is spent—coding, waiting for review, in review, waiting for deployment, in deployment—enabling targeted intervention
Predictive delivery confidence: Probability-weighted forecasts of commitment completion based on current progress and historical patterns
Review efficiency indicators: Reviewer workload distribution, review latency by reviewer, and review quality signals
Cross-team dependency metrics: Time lost to handoffs, blocking relationships between teams, and coordination overhead
Innovation vs. maintenance ratio: Distribution of engineering effort across new feature development, maintenance, technical debt, and incident response
Work fragmentation: Degree of context switching and multitasking that reduces focus time
These metrics define modern engineering performance and justify investment in intelligence platforms.
Realistic implementation planning improves success:
Typical timeline:
Prerequisites:
Quick wins: Initial value should appear within weeks—visibility improvements, automated reporting, early bottleneck identification.
Longer-term impact: Significant productivity gains and cultural shifts require months of consistent use and iteration.
Start with a focused pilot. Prove value with measurable improvements before expanding scope.
Complete platforms deliver:
Use this checklist when evaluating platforms to ensure comprehensive coverage.
The SEI platform market includes several vendor categories:
Pure-play intelligence platforms: Companies focused specifically on engineering analytics and intelligence, offering deep capabilities in metrics, insights, and recommendations
Platform engineering vendors: Tools that combine service catalogs, developer portals, and intelligence capabilities into unified internal platforms
DevOps tool vendors: CI/CD and monitoring providers expanding into intelligence through analytics features
Enterprise software vendors: Larger software companies adding engineering intelligence to existing product suites
When evaluating vendors, consider:
Request demonstrations with your own data during evaluation to assess real capability rather than marketing claims.
Most organizations underutilize trial periods. Structure evaluation to reveal real strengths:
Preparation: Define specific questions the trial should answer. Identify evaluation scenarios and success criteria.
Validation areas:
Technical testing: Verify integrations work with your specific tool configurations. Test API capabilities and data export.
User feedback: Include actual users in evaluation. Developer adoption determines long-term success.
A software engineering intelligence platform should prove its intelligence during the trial. Dashboards that display numbers are table stakes; value comes from insights that drive engineering decisions.
Typo stands out as a leading software engineering intelligence platform that combines deep engineering insights with advanced AI-driven code review capabilities. Designed especially for growing engineering teams, Typo offers a comprehensive package that not only delivers real-time visibility into delivery performance, team productivity, and code quality but also enhances code review processes through intelligent automation.
By integrating engineering intelligence with AI code review, Typo helps teams identify bottlenecks early, forecast delivery risks, and maintain high software quality standards without adding manual overhead. Its AI-powered code review tool automatically analyzes code changes to detect potential issues, suggest improvements, and reduce review cycle times, enabling faster and more reliable software delivery.
This unified approach empowers engineering leaders to make informed decisions backed by actionable data while supporting developers with tools that improve their workflow and developer experience. For growing teams aiming to scale efficiently and maintain engineering excellence, Typo offers a powerful solution that bridges the gap between comprehensive engineering intelligence and practical code quality automation.
Here are some notable software engineering intelligence platforms and what sets them apart:
Each platform offers unique features and focuses, allowing organizations to choose based on their specific needs and priorities.
What’s the difference between SEI platforms and traditional project management tools?
Project management tools track work items and status. SEI platforms analyze the complete software development lifecycle—connecting planning data to code activity to deployment outcomes—to provide insight into how work flows, not just what work exists. They focus on delivery metrics, code quality, and engineering effectiveness rather than task management.
How long does it typically take to see ROI from a software engineering intelligence platform? For more about how to measure and improve engineering productivity, see this guide.
Teams typically see actionable insights within weeks of implementation. Measurable productivity gains appear within two to three months. Broader organizational ROI and cultural change develop over six months to a year as continuous improvement practices mature.
What data sources are essential for effective engineering intelligence?
At minimum: version control systems (Git), CI/CD pipelines, and project management tools. Enhanced intelligence comes from adding code review data, incident management, communication tools, and production observability. The more data sources integrated, the richer the insights.
How can organizations avoid the “surveillance” perception when implementing SEI platforms?
Focus on team-level metrics rather than individual performance. Communicate transparently about what is measured and why. Involve developers in platform selection and configuration. Position the platform as a tool for process improvements that benefit developers—reducing friction, highlighting blockers, and enabling better resource allocation.
What are the key success factors for software engineering intelligence platform adoption?
Leadership commitment to data-driven decision making, stakeholder alignment on objectives, transparent communication with engineering teams, phased rollout with demonstrated quick wins, and willingness to act on insights rather than just collecting metrics.

Engineering teams today face an overwhelming array of metrics, dashboards, and analytics tools that promise to improve software delivery performance. Yet most organizations quietly struggle with a different problem: data overload. They collect more information than they can interpret, compare, or act upon.
The solution is not “more dashboards” or “more metrics.” It is choosing a software engineering intelligence platform that centralizes what matters, connects the full SDLC, adds AI-era context, and provides clear insights instead of noise. This guide helps engineering leaders evaluate such a platform with clarity and practical criteria suited for modern engineering organizations.
A modern software engineering intelligence platform ingests data from Git, Jira, CI/CD, incidents, and AI coding tools, then models that data into a coherent, end-to-end picture of engineering work.
It is not just a dashboard layer. It is a reasoning layer.
A strong platform does the following:
This sets the foundation for choosing a tool that reduces cognitive load instead of increasing it.
Before selecting any platform, engineering leadership must align on what success looks like: velocity, throughput, stability, predictability, quality, developer experience, or a combination of all.
DORA metrics remain essential because they quantify delivery performance and stability. However, teams often confuse “activity” with “outcomes.” Vanity metrics distract; outcome metrics guide improvement.
Below is a clear representation:
Choosing a platform starts with knowing which outcomes matter most. A platform cannot create alignment—alignment must come first.
Engineering organizations now operate under new pressures:
Traditional dashboards were not built to answer questions like:
Modern engineering intelligence platforms fill this gap by correlating signals across the SDLC and surfacing deeper insights.
A platform is only as good as the data it can access. Integration depth, reliability, and accuracy matter more than the marketing surface.
When evaluating integrations, look for:
A unified data layer eliminates manual correlation work, removes discrepancies across tools, and gives you a dependable version of the truth.
Most tools claim “Git + Jira insights,” but the real differentiator is whether the platform builds a cohesive model across tools.
A strong model links:
This enables non-trivial questions, such as:
A platform should unlock cross-system reasoning, not just consolidated charts.
Sophisticated analytics do not matter if teams cannot understand them or act on them.
Usability determines adoption.
Look for:
Reporting should guide action, not create more questions.
Many leaders adopted early analytics solutions only to realize that they now manage more dashboards than insights.
Symptoms of dashboard fatigue include:
A modern engineering intelligence platform should enforce clarity through:
The platform should simplify decision-making—not multiply dashboards.
Engineering teams need immediacy and foresight.
A platform should provide:
The value lies not in showing what happened, but in revealing patterns before they become systemic issues.
AI has changed the expectation from engineering intelligence tools.
Leaders now expect platforms to:
The platform should behave like a senior analyst—contextualizing, correlating, and reasoning—rather than a static report generator.
Great engineering output is impossible without healthy, focused teams.
DevEx visibility should include:
DevEx insights should be continuous and lightweight—not heavy surveys that create fatigue.
Modern DevEx measurement has three layers:
1. Passive workflow signals
These include cycle time, WIP levels, context switches, review load, and blocked durations.
2. Targeted pulse surveys
Short and contextual, not broad or frequent.
3. Narrative interpretation
Distinguishing healthy intensity from unhealthy pressure.
A platform should give a holistic, continuous view of team health without burdening engineers.
Platform selection must match the organization’s cultural style.
Examples:
A good platform adapts to your culture, not the other way around.
Engineering cultures differ across three major modes:
A strong platform supports all three through:
Engineering intelligence must fit how people work to be trusted.
Your platform should scale with your team size, architecture, and toolchain.
Distinguish between:
Scalability is not only about performance—it is about staying relevant as your engineering organization changes.
Most engineering intelligence tools today offer:
However, many still struggle with:
Few platforms distinguish between human and AI-generated code.
Without this, leaders cannot evaluate AI’s true effect on quality and throughput.
Most tools count reviews, not the effectiveness of reviews.
Many dashboards show correlations but stop short of explaining causes or suggesting interventions.
These gaps matter as organizations become increasingly AI-driven.
DORA remains foundational, but AI-era engineering demands additional visibility:
These metrics capture the hidden dynamics that classic metrics cannot explain.
Typo operates in this modern category of engineering intelligence, with capabilities designed for AI-era realities.
Unified engineering data model
Maps Git, Jira, CI, reviews, and deployment data into a consistent structure for analysis.
DORA + SPACE extensions
Adds AI-origin code, AI rework, review noise, PR risk surfaces, and team health telemetry.
AI-origin code intelligence
Shows where AI tools contribute code and how that correlates with rework, defects, and cycle time.
Review noise detection
Identifies shallow approvals, draft-PR approvals, copy-paste comments, and mechanical reviews.
PR flow analytics
Highlights bottlenecks, reviewer load imbalance, review latency, and idle-time hotspots.
Developer Experience telemetry
Uses workflow-based signals to detect burnout risks, context switching, and focus-time erosion.
Conversational reasoning layer
Allows leaders to ask questions about delivery, quality, AI impact, and DevEx in natural language—powered by Typo’s unified model instead of generic LLM guesses.
Typo’s approach is grounded in engineering reality: fewer dashboards, deeper insights, and AI-aware intelligence.
How do we avoid data overload when adopting an engineering intelligence platform?
Choose a platform with curated, opinionated metrics, not endless dashboards. Prioritize clarity over quantity.
What features ensure actionable insights?
Real-time alerts, predictive analysis, cross-system correlation, and narrative explanations.
How do we ensure smooth integration?
Look for robust native integrations with Git, Jira, CI/CD, and incident systems, plus a unified data model.
What governance practices help maintain clarity?
Clear metric definitions, access controls, and recurring reviews to retire low-value metrics.
How do we measure ROI?
Track changes in cycle time, quality, rework, DevEx, review efficiency, and unplanned work reduction before and after rollout.

This guide is for CTOs, VPs of Engineering, and technical leaders evaluating software engineering intelligence platforms. Choosing the right software engineering intelligence platform is critical for improving productivity, delivery predictability, and aligning engineering with business goals. It covers the top platforms for 2026, their features, and how to choose the right one for your organization.
The rapid shift toward AI-augmented software development has pushed the modern engineering organization into a new era of operational complexity. Teams ship across distributed environments, manage hybrid code review workflows, incorporate AI agents into daily development, and navigate an increasingly volatile security landscape. Without unified visibility, outcomes become unpredictable and leaders spend more energy explaining delays than preventing them. A Software Engineering Intelligence (SEI) platform is an automated tool that aggregates, analyzes, and presents data and insights from the software development process. Software engineering intelligence platforms enhance process efficiency by analyzing engineering data, identifying bottlenecks, and optimizing workflows to improve productivity and quality.
SEI platforms provide greater visibility across the software development lifecycle (SDLC), enabling engineering leaders to use a data-backed approach to improving the software development process. They empower leaders to make data-informed decisions that drive positive business outcomes and foster consistent collaboration between teams throughout the CI/CD process. By connecting with various development tools, SEI platforms collect and analyze data from those tools, then present actionable insights in dashboards and reports.
Engineering intelligence platforms have become essential because they answer a simple but painful question: why is delivery slowing down even when teams are writing more code than ever? These systems consolidate signals across Git, Jira, CI/CD, and communication tools to give leaders a real-time, objective understanding of execution. As a type of engineering management platform, they provide visibility and data-driven insights for leaders. The best ones extend beyond dashboards by applying AI to detect bottlenecks, automate reviews, forecast outcomes, and surface insights before issues compound. SEI platforms synthesize data from tools that engineering teams are already using daily, alleviating the burden of manually bringing together data from various platforms. The visibility provided by an SEI platform is the first step toward continuous improvement and aligning engineering work to business goals.
Industry data reinforces the urgency. The DevOps and engineering intelligence market is projected to reach $25.5B by 2028 at a 19.7% CAGR, driven by rising security expectations, compliance workloads, and heavy AI investment. Sixty-two percent of teams now prioritize security and compliance, while sixty-seven percent are increasing AI adoption across their SDLC. Modern software organizations are increasingly relying on these platforms to improve operations and align with business goals. Engineering leaders cannot operate with anecdotal visibility or static reporting anymore; they need continuous, trustworthy signals. SEI platforms allow engineering leaders to take a data-driven approach to engineering management instead of an intuition-based approach.
SEI platforms help engineering leaders understand the deeper context of their engineering organizations so they can maximize value delivery and developer productivity.
The market for software engineering intelligence platforms has exploded in recent years, with dozens of vendors promising to give insights about team productivity. Popular SEI platforms include Jellyfish, LinearB, Waydev, and Oobeya, which provide insights into development workflows and enhance strategic decision-making.
This guide breaks down the leading platforms shaping the space in 2026. It evaluates them from a CTO, VP Engineering, and Director Engineering perspective, focusing on real benefits: improved delivery velocity, better review quality, reduced operational risk, and healthier developer experience. Every platform listed here has measurable strengths, clear trade-offs, and distinct value depending on your stage, size, and engineering structure.
An engineering intelligence platform aggregates real-time development and delivery data into an integrated view that leaders can trust. It pulls events from pull requests, commits, deployments, issue trackers, test pipelines, collaboration platforms, and incident management systems. Data integration is a key capability, consolidating information from code repositories, project management tools, incident management systems, and version control systems to provide a unified perspective.
It then transforms these inputs into actionable signals around delivery health, code quality, operational risk, and team experience. These platforms leverage data from a wide range of development tools to provide comprehensive visibility.
The modern definition goes further. Tools in this category now embed AI layers that perform automated reasoning on diffs, patterns, and workflows. Their role spans beyond dashboards:
These systems help leaders transition from reactive management to proactive engineering operations.
Data from the source file highlights the underlying tension: only 29 percent of teams can deploy on demand, 47 percent of organizations face DevOps overload, 36 percent lack real-time visibility, and one in three report week-long security audits. The symptoms point to a systemic issue: engineers waste too much time navigating fragmented workflows and chasing context. Software development teams and engineering teams often struggle with fragmented workflows, which negatively impacts team performance and team productivity.
Engineering intelligence platforms help teams close this gap by:
By consolidating data and surfacing actionable insights, these platforms drive engineering effectiveness, engineering efficiency, and operational efficiency. They empower engineering teams to benchmark progress, optimize resource utilization, and support continuous improvement initiatives that align with business goals.
Done well, engineering intelligence becomes the operational backbone of a modern engineering org.
Evaluations were grounded in six core criteria, reflecting how engineering leaders compare tools today:
This framework mirrors how teams evaluate tools like LinearB, Jellyfish, Oobeya, Swarmia, DX, and Typo.
Typo distinguishes itself by combining engineering intelligence with AI-driven automation that acts directly on code and workflows. In addition to surfacing insights, Typo classifies and tracks feature development tasks, providing deeper workflow insights by distinguishing between new feature work and other engineering activities. Typo closes the loop by performing automated code review actions, summarizing PRs, generating sprint retrospectives, and producing manager talking points. Its hybrid static analysis plus LLM review engine analyzes diffs, flags risky patterns, and provides structured, model-backed feedback to help identify bottlenecks in the software development process.
Unlike tools that only focus on workflow metrics, Typo also measures AI-origin codeLLM rework, review noise, and developer experience signals. These dimensions matter because teams are increasingly blending human and AI contributions. Typo offers clear visibility into project progress, helping leaders monitor advancement and ensure alignment with business goals. Understanding how AI is shaping delivery is now foundational for any engineering leader.
Typo is strongest when teams want a single platform that blends analytics with action. Its agentic layer reduces manual workload for managers and reviewers. Teams that struggle with review delays, inconsistent feedback, or scattered analytics find Typo particularly valuable.
Typo's value compounds with scale. Smaller teams benefit from automation, but the platform's real impact becomes clear once multiple squads, repositories, or high-velocity PR flows are in place.
LinearB remains one of the most recognizable software engineering intelligence tools and SEI platforms due to its focus on workflow optimization. As a leading SEI platform, LinearB analyzes PR cycle times, idle periods, WIP, and bottleneck behavior across repositories. It supports predictable software delivery by providing visibility into workflow bottlenecks and cycle times, helping teams improve project planning and reduce delays. Its AI assistant WorkerB automates routine nudges, merges, and task hygiene.
LinearB is best suited for teams seeking immediate visibility into workflow inefficiencies.
DX focuses on research-backed measurement of developer experience. Its methodology combines quantitative data with qualitative data by incorporating developer surveys and developer experience surveys to gather insights into workflow friction, burnout conditions, satisfaction trends, and systemic blockers. This approach provides a comprehensive view by blending objective metrics with subjective feedback.
DX is ideal for leaders who want [structured insights into developer experience beyond delivery metrics](https://typoapp.io/blog/best-developer-experience-devex-tools).
Jellyfish positions itself as a strategic alignment platform for engineering organizations seeking to align engineering investments with business goals. It connects engineering outputs to business priorities, mapping investment areas, project allocation, and financial impact. Jellyfish also supports software capitalization by automating financial tracking and resource allocation for engineering projects, helping justify R&D spend and align it with desired business outcomes.
Jellyfish excels in organizations where engineering accountability needs to be communicated upward.
Oobeya provides real-time monitoring with strong support for DORA metrics. Its modular design allows teams to configure dashboards around quality, velocity, or satisfaction through features like Symptoms.
Oobeya suits teams wanting customizable visibility with lightweight adoption.
Haystack prioritizes fast setup and rapid feedback loops. It surfaces anomalies in commit patterns, review delays, and deployment behavior. Teams often adopt it for action-focused simplicity.
Haystack is best for fast-moving teams needing immediate operational awareness.
Axify emphasizes predictive analytics. It leverages historical data and machine learning to forecast project delays and delivery risks, providing engineering teams with actionable insights. It forecasts throughput, lead times, and delivery risk using ML models trained on organizational history.
Pricing may limit accessibility for smaller teams, but enterprises value its forecasting capabilities.
Swarmia provides coverage across DORA, SPACE, velocity, automation effectiveness, and team health. By integrating with project management platforms, Swarmia offers software teams comprehensive visibility into project progress, helping leaders monitor advancement and ensure alignment with business goals. It also integrates cost planning into engineering workflows, allowing leaders to understand the financial footprint of delivery.
Swarmia works well for organizations that treat engineering both as a cost center and a value engine.
Using a developer intelligence platform offers key benefits such as improved team productivity, actionable engineering metrics, and enhanced development efficiency. These platforms provide organizations with comprehensive visibility and data-driven insights to optimize developer impact.
Engineering intelligence tools must match your organizational maturity and workflow design. Leaders should evaluate platforms based on:
Here is a quick feature breakdown:
Around 30 percent of engineers report losing nearly one-third of their week to repetitive tasks, audits, manual reporting, and avoidable workflow friction. Software engineering intelligence platforms help teams identify areas for improvement and identify bottlenecks in workflows, enabling targeted action. These platforms directly address these inefficiencies by:
DORA metrics remain the best universal compass for delivery health. Modern platforms turn these metrics from quarterly reviews into continuous, real-time operational signals.
The value of any engineering intelligence platform depends on the breadth and reliability of its integrations. Integrating across the software development process and software development lifecycle ensures comprehensive visibility and actionable insights at every stage, from code development to deployment. Teams need continuous signals from:
Platforms with mature connectors reduce onboarding friction and guarantee accuracy across workflows.
Leaders should evaluate tools based on:
Running a short pilot with real data is the most reliable way to validate insights, usability, and team fit.
What are the core benefits of engineering intelligence platforms?
They provide real-time visibility into delivery health, reduce operational waste, automate insights, and help teams ship faster with better quality. These platforms also optimize engineering processes to improve efficiency and maintain high standards of quality.
How do they support developer experience without micromanagement?
Modern platforms focus on team-level signals rather than individual scoring. They help leaders remove blockers rather than monitor individuals.
Which metrics matter most?
DORA metrics, PR velocity, rework patterns, cycle time distributions, and developer experience indicators are the primary signals.
Can these platforms scale with distributed teams?
Yes. They aggregate asynchronous activity across time zones, workflows, and deployment environments.
What should teams consider before integrating a platform?
Integration breadth, data handling, sync reliability, and alignment with your metrics strategy.
Engineering leaders are moving beyond dashboard tools to comprehensive Software Engineering Intelligence Platforms that unify delivery metrics, code-level insights, AI-origin code analysis, DevEx signals, and predictive operations in one analytical system. This article compares leading platforms, highlights gaps in the traditional analytics landscape, and introduces the capabilities required for 2026, where AI coding, agentic workflows, and complex delivery dynamics reshape how engineering organizations operate.
Software delivery has always been shaped by three forces: the speed of execution, the quality of the output, and the well-being of the people doing the work. In the AI era, each of those forces behaves differently. Teams ship faster but introduce more subtle defects. Code volume grows while review bandwidth stays fixed. Developers experience reduced cognitive load in some areas and increased load in others. Leaders face unprecedented complexity because delivery patterns no longer follow the linear relationships that pre-AI metrics were built to understand.
This is why Software Engineering Intelligence Platforms have become foundational. Modern engineering organizations can no longer rely on surface-level dashboards or simple rollups of Git and Jira events. They need systems that understand flow, quality, cognition, and AI-origin work at once. These systems must integrate deeply enough to see bottlenecks before they form, attribute delays to specific root causes, and expose how AI tools reshape engineering behavior. They must be able to bridge the code layer with the organizational layer, something that many legacy analytics tools were never designed for.
The platforms covered in this article represent different philosophies of engineering intelligence. Some focus on pipeline flow, some on business alignment, some on human factors, and some on code-level insight. Understanding their strengths and limitations helps leaders shape a strategy that fits the new realities of software development.
The category has evolved significantly. A platform worthy of this title must unify a broad set of signals into a coherent view that answers not just what happened but why it happened and what will likely happen next. Several foundational expectations now define the space.
Engineering organizations rely on a fragmented toolchain. A modern platform must unify Git, Jira, CI/CD, testing, code review, communication patterns, and developer experience telemetry. Without a unified model, insights remain shallow and reactive.
LLMs are not an enhancement; they are required. Modern platforms must use AI to classify work, interpret diffs, identify risk, summarize activity, reduce cognitive load, and surface anomalies that traditional heuristics miss.
Teams need models that can forecast delivery friction, capacity constraints, high-risk code, and sprint confidence. Forecasting is no longer a bonus feature but a baseline expectation.
Engineering performance cannot be separated from cognition. Context switching, review load, focus time, meeting pressure, and sentiment have measurable effects on throughput. Tools that ignore these variables produce misleading conclusions.
The value of intelligence lies in its ability to influence action. Software Engineering Intelligence Platforms must generate summaries, propose improvements, highlight risky work, assist in prioritization, and reduce the administrative weight on engineering managers.
As AI tools generate increasing percentages of code, platforms must distinguish human- from AI-origin work, measure rework, assess quality drift, and ensure that leadership has visibility into new risk surfaces.
Typo represents a more bottom-up philosophy of engineering intelligence. Instead of starting with work categories and top-level delivery rollups, it begins at the code layer, where quality, risk, and velocity are actually shaped. This is increasingly necessary in an era where AI coding assistants produce large volumes of code that appear clean but carry hidden complexity.
Typo unifies DORA metrics, code review analytics, workflow data, and AI-origin signals into a predictive layer. It integrates directly with GitHub, Jira, and CI/CD systems, delivering actionable insights within hours of setup. Its semantic diff engine and LLM-powered reviewer provide contextual understanding of patterns that traditional tools cannot detect.
Typo measures how AI coding assistants influence velocity and quality, identifying rework trends, risk hotspots, and subtle stylistic inconsistencies introduced by AI-origin code. It exposes reviewer load, review noise, cognitive burden, and early indicators of technical debt. Beyond analytics, Typo automates operational work through agentic summaries of PRs, sprints, and 1:1 inputs.
In a landscape where velocity often increases before quality declines, Typo helps leaders see both sides of the equation, enabling balanced decision-making grounded in the realities of modern code production.
LinearB focuses heavily on development pipeline flow. Its strength lies in connecting Git, Jira, and CI/CD data to understand where work slows. It provides forecasting models for sprint delivery and uses WorkerB automation to nudge teams toward healthier behaviors, such as timely reviews and branch hygiene.
LinearB helps teams reduce cycle time and improve collaboration by identifying bottlenecks early. It excels at predicting sprint completion and maintaining execution flow. However, it offers limited depth at the code level. For teams dealing with AI-origin work, semantic drift, or subtle quality issues, LinearB’s surface-level metrics offer only partial visibility.
Its predictive models are valuable, but without granular understanding of code semantics or review complexity, they cannot fully explain why delays occur. Teams with increasing AI adoption often require additional layers of intelligence to understand rework and quality dynamics beyond what pipeline metrics alone can capture.
Jellyfish offers a top-down approach to engineering intelligence. It integrates data sources across the development lifecycle and aligns engineering work with business objectives. Its strength is organizational clarity: leaders can map resource allocation, capacity planning, team structure, and strategic initiatives in one place.
For executive reporting and budgeting, Jellyfish is often the preferred platform. Its privacy-focused individual performance analysis supports sensitive leadership conversations without becoming punitive. However, Jellyfish has limited depth at the code level. It does not analyze diffs, AI-origin signals, or semantic risk patterns.
In the AI era, business alignment alone cannot explain delivery friction. Leaders need bottom-up visibility into complexity, review behavior, and code quality to understand how business outcomes are influenced. Jellyfish excels at showing what work is being done but not the deeper why behind technical risks or delivery volatility.
Swarmia emphasizes long-term developer health and sustainable productivity. Its analytics connect output metrics with human factors such as focus time, meeting load, context switching, and burnout indicators. It prioritizes developer autonomy and lets individuals control their data visibility.
As engineering becomes more complex and AI-driven, Swarmia’s focus on cognitive load becomes increasingly important. Code volume rises, review frequency increases, and context switching accelerates when teams adopt AI tools. Understanding these pressures is crucial for maintaining stable throughput.
Swarmia is well suited for teams that want to build a healthy engineering culture. However, it lacks deep analysis of code semantics and AI-origin work. This limits its ability to explain how AI-driven rework or complexity affects well-being and performance over time.
Oobeya specializes in aligning engineering activity with business objectives. It provides OKR-linked insights, release predictability assessments, technical debt tracking, and metrics that reflect customer impact and reliability.
Oobeya helps leaders translate engineering work into business narratives that resonate with executives. It highlights maintainability concerns, risk profiles, and strategic impact. Its dashboards are designed for clarity and communication rather than deep technical diagnosis.
The challenge arises when strategic metrics disagree with on-the-ground delivery behavior. For organizations using AI coding tools, maintainability may decline even as output increases. Without code-level insights, Oobeya cannot fully reveal the sources of divergence.
DORA and SPACE remain foundational frameworks, but they were designed for human-centric development patterns. AI-origin code changes how teams work, what bottlenecks emerge, and how quality shifts over time. New extensions are required.
AI-adjusted metrics help leaders understand system behavior more accurately:
AI affects satisfaction, cognition, and productivity in nuanced ways:
These extensions help leaders build a comprehensive picture of engineering health that aligns with modern realities.
AI introduces benefits and risks that traditional engineering metrics cannot detect. Teams must observe:
AI-generated code may appear clean but hide subtle structural complexity.
LLMs generate syntactically correct but logically flawed code.
Different AI models produce different conventions, increasing entropy.
AI increases code output, which increases review load, often without corresponding quality gains.
Quality degradation may not appear immediately but compounds over time.
A Software Engineering Intelligence Platform must detect these risks through semantic analysis, pattern recognition, and diff-level intelligence.
Across modern engineering teams, several scenarios appear frequently:
Teams ship more code, but review queues grow, and defects increase.
Developers feel good about velocity, but AI-origin rework accumulates under the surface.
Review bottlenecks, not code issues, slow delivery.
Velocity metrics alone cannot explain why outcomes fall short; cognitive load and complexity often provide the missing context.
These patterns demonstrate why intelligence platforms must integrate code, cognition, and flow.
A mature platform requires:
The depth and reliability of this architecture differentiate simple dashboards from true Software Engineering Intelligence Platforms.
Metrics fail when they are used incorrectly. Common traps include:
Engineering is a systems problem. Individual metrics produce fear, not performance.
In the AI era, increased output often hides rework.
AI must be measured, not assumed to add value.
Code produced does not equal value delivered.
Insights require human interpretation.
Effective engineering intelligence focuses on system-level improvement, not individual performance.
Introducing a Software Engineering Intelligence Platform is an organizational change. Successful implementations follow a clear approach:
Communicate that metrics diagnose systems, not people.
Ensure teams define cycle time, throughput, and rework consistently.
Developers should understand how AI usage is measured and why.
Retrospectives, sprint planning, and 1:1s become richer with contextual data.
Agentic summaries, risk alerts, and reviewer insights accelerate alignment.
Leaders who follow these steps see faster adoption and fewer cultural barriers.
A simple but effective framework for modern organizations is:
Flow + Quality + Cognitive Load + AI Behavior = Sustainable Throughput
Flow represents system movement.
Quality represents long-term stability.
Cognitive load represents human capacity.
AI behavior represents complexity and rework patterns.
If any dimension deteriorates, throughput declines.
If all four align, delivery becomes predictable.
Typo contributes to this category through a deep coupling of code-level understanding, AI-origin analysis, review intelligence, and developer experience signals. Its semantic diff engine and hybrid LLM+static analysis framework reveal patterns invisible to workflow-only tools. It identifies review noise, reviewer bottlenecks, risk hotspots, rework cycles, and AI-driven complexity. It pairs these insights with operational automation such as PR summaries, sprint retrospectives, and contextual leader insights.
Most platforms excel at one dimension: flow, business alignment, or well-being. Typo aims to unify the three, enabling leaders to understand not just what is happening but why and how it connects to code, cognition, and future risk.
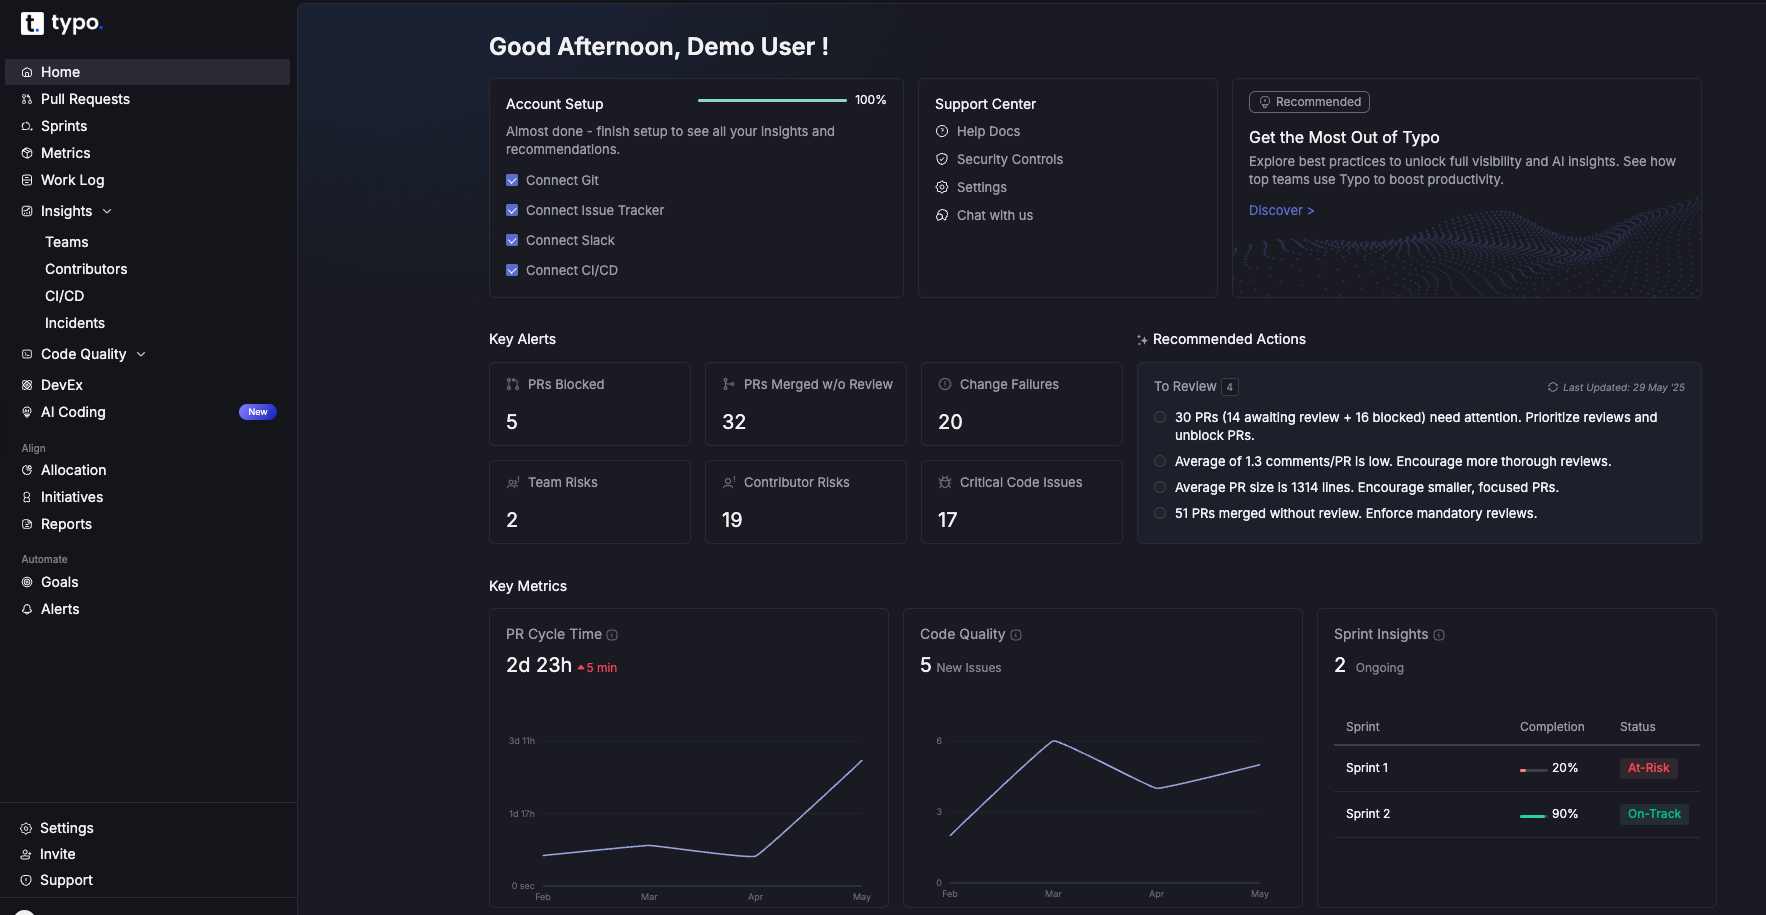
When choosing a platform, leaders should look for:
A wide integration surface is helpful, but depth of analysis determines reliability.
Platforms must detect, classify, and interpret AI-driven work.
Forecasts should meaningfully influence planning, not serve as approximations.
Developer experience is now a leading indicator of performance.
Insights must lead to decisions, not passive dashboards.
A strong platform enables engineering leaders to operate with clarity rather than intuition.
Engineering organizations are undergoing a profound shift. Speed is rising, complexity is increasing, AI-origin code is reshaping workflows, and cognitive load has become a measurable constraint. Traditional engineering analytics cannot keep pace with these changes. Software Engineering Intelligence Platforms fill this gap by unifying code, flow, quality, cognition, and AI signals into a single model that helps leaders understand and improve their systems.
The platforms in this article—Typo, LinearB, Jellyfish, Swarmia, and Oobeya—each offer valuable perspectives. Together, they show where the industry has been and where it is headed. The next generation of engineering intelligence will be defined by platforms that integrate deeply, understand code semantically, quantify AI behavior, protect developer well-being, and guide leaders through increasingly complex technical landscapes.
The engineering leaders who succeed in 2026 will be those who invest early in intelligence systems that reveal the truth of how their teams work and enable decisions grounded in clarity rather than guesswork.
A unified analytical system that integrates Git, Jira, CI/CD, code semantics, AI-origin signals, and DevEx telemetry to help engineering leaders understand delivery, quality, risk, cognition, and organizational behavior.
AI increases output but introduces hidden complexity and rework. Without AI-origin awareness, traditional metrics become misleading.
Yes, but they must be extended to reflect AI-driven code generation, rework, and review noise.
They reveal bottlenecks, predict risks, improve team alignment, reduce cognitive load, and support better planning and decision-making.
It depends on the priority: flow (LinearB), business alignment (Jellyfish), developer well-being (Swarmia), strategic clarity (Oobeya), or code-level AI-native intelligence (Typo).

This guide is designed for engineering leaders seeking to understand, evaluate, and select the best software engineering intelligence platforms to drive business outcomes and engineering efficiency. As the software development landscape evolves with the rise of AI, multi-agent workflows, and increasingly complex toolchains, choosing the right platform is critical for aligning engineering work with organizational objectives, improving delivery speed, and maximizing developer satisfaction. The impact of selecting the right software engineering intelligence platform extends beyond engineering teams—it directly influences business outcomes, operational efficiency, and the ability to innovate at scale.
A Software Engineering Intelligence (SEI) platform is an automated tool that aggregates, analyzes, and presents data and insights from the software development process. These platforms unify data from tools such as Git, Jira, CI/CD, code reviews, planning tools, and AI coding workflows to provide engineering leaders with a real-time, predictive understanding of delivery, quality, and developer experience. The best software engineering intelligence platforms synthesize data from tools that engineering teams are already using daily.
When choosing a software engineering intelligence platform, leaders should:
This guide will help leaders choose the right software engineering intelligence platform for their organization.
An engineering intelligence platform aggregates data from repositories, issue trackers, CI/CD, and communication tools. Data integration and data analytics are core to these platforms, enabling them to unify and analyze data from a variety of development tools. It produces strategic, automated insights across the software development lifecycle. These platforms act as business intelligence for engineering. They convert disparate signals into trend analysis, benchmarks, and prioritized recommendations.
Unlike point solutions, engineering intelligence platforms create a unified view of the development ecosystem. They automatically collect engineering metrics and relevant metrics, which are used to measure engineering effectiveness and engineering efficiency. These platforms detect patterns and surface actionable recommendations. CTOs, VPs of Engineering, and managers use these platforms for real-time decision support.
SEI platforms provide detailed analytics and metrics, offering a clear picture of engineering health, resource investment, operational efficiency, and progress towards strategic goals.
Software Engineering Intelligence platforms aggregate, analyze, and present data from the software development process.
Now that we've covered the general overview of engineering intelligence platforms, let's dive into the specifics of what a Software Engineering Intelligence Platform is and how it functions.
A Software Engineering Intelligence Platform unifies data from Git, Jira, CI/CD, reviews, planning tools, and AI coding workflows to give engineering leaders a real-time, predictive understanding of delivery, quality, and developer experience. A Software Engineering Intelligence (SEI) platform is an automated tool that aggregates, analyzes, and presents data and insights from the software development process. This guide will help leaders choose the right software engineering intelligence platform for their organization. These platforms leverage advanced tools for comprehensive analytics, data integration, and the ability to analyze data from a wide range of existing tools, enabling deep insights and seamless workflows. These capabilities help align engineering work with business goals by connecting engineering activities to organizational objectives and outcomes. The best software engineering intelligence platforms synthesize data from tools that engineering teams are already using daily.
Traditional dashboards and DORA-only tools no longer work in the AI era, where PR volume, rework, model unpredictability, and review noise have become dominant failure modes. Modern intelligence platforms must analyze diffs, detect AI-origin code behavior, forecast delivery risks, identify review bottlenecks, and explain why teams slow down, not just show charts. This guide outlines what the category should deliver in 2026, where competitors fall short, and how leaders can evaluate platforms with accuracy, depth, and time-to-value in mind.
A Software Engineering Intelligence (SEI) platform is an automated tool that aggregates, analyzes, and presents data and insights from the software development process. A Software Engineering Intelligence Platform is an integrated system that consolidates signals from code, reviews, releases, sprints, incidents, AI coding tools, and developer communication channels to provide a unified, real-time understanding of engineering performance. SEI platforms play a critical role in supporting business goals by aligning engineering work with organizational objectives, while also tracking project health and project progress to ensure teams stay on course and risks are identified early.
In 2026, the definition has evolved. Intelligence platforms now:
Competitors describe intelligence platforms in fragments (delivery, resources, or DevEx), but the market expectation has shifted. A true Software Engineering Intelligence Platform must give leaders visibility across the entire SDLC and the ability to act on those insights without manual interpretation.
Engineering intelligence platforms produce measurable outcomes. They improve delivery speed, code quality, and developer satisfaction. Core benefits include:
SEI platforms enable engineering leaders to manage teams based on data rather than instincts alone, providing detailed analytics and metrics that help in tracking progress towards strategic goals.
These platforms move engineering management from intuition to proactive, data-driven leadership. They enable optimization, prevent issues, and demonstrate development ROI clearly. Software engineering intelligence platforms aim to solve engineering's black box problem by illuminating the entire software delivery lifecycle.
Now that we've defined what an SEI platform is, let's explore why these platforms are essential in the modern engineering landscape.
The engineering landscape has shifted. AI-assisted development, multi-agent workflows, and code generation have introduced:
Traditional analytics frameworks cannot interpret these new signals. A 2026 Software Engineering Intelligence Platform must surface:
These are the gaps competitors struggle to interpret consistently, and they represent the new baseline for modern engineering intelligence.
As we understand the importance of these platforms, let's examine the key benefits they offer to engineering organizations.
Adopting an engineering intelligence platform delivers a transformative impact on the software development process. By centralizing data from across the software development lifecycle, these platforms empower software development teams to make smarter, faster decisions rooted in real-time, data-driven insights.
Software engineering intelligence tools elevate developer productivity by:
This not only enhances code quality but also fosters a culture of continuous improvement, where teams are equipped to adapt and optimize their development process in response to evolving business needs.
Collaboration is also strengthened, as engineering intelligence platforms break down silos between teams, stakeholders, and executives. By aligning everyone around shared engineering goals and business outcomes, organizations can ensure that engineering efforts are always in sync with strategic objectives.
Ultimately, leveraging an engineering intelligence platform drives operational efficiency, supports data-driven decision making, and enables engineering organizations to deliver high-quality software with greater confidence and speed.
With these benefits in mind, let's move on to the essential criteria for evaluating engineering intelligence platforms.
A best-in-class platform should score well across integrations, analytics, customization, AI features, collaboration, automation, and security. Key features to look for include:
The priority of each varies by organizational context.
Use a weighted scoring matrix that reflects your needs:
Include stakeholders across roles to ensure the platform meets both daily workflow and strategic visibility requirements. Compatibility with existing tools like Jira, GitHub, and GitLab is also crucial for ensuring efficient project management and seamless workflows.
Customization and extensibility are important features of SEI platforms, allowing teams to tailor dashboards and metrics to their specific needs.
With evaluation criteria established, let's review how modern platforms differ and what to look for in the competitive landscape.
The engineering intelligence category has matured, but platforms vary widely in depth and accuracy.
Common competitor gaps include:
Your blog benefits from explicitly addressing these gaps so that when buyers compare platforms, your article answers the questions competitors leave out.
Next, let's discuss the importance of integration with developer tools and workflows.
Seamless integrations are foundational. Data integration is critical for software engineering intelligence platforms, enabling them to unify data from various development tools, project management platforms, and collaboration tools to provide a comprehensive view of engineering activities and performance metrics. Platforms must aggregate data from:
Look for:
This cross-tool correlation enables sophisticated analyses that justify the investment. SEI platforms synthesize data from tools that engineering teams are already using daily, alleviating the burden of manually bringing together data from various platforms.
With integrations in place, let's examine the analytics capabilities that set leading platforms apart.
Real-time analytics surface current metrics (cycle time, deployment frequency, PR activity). Leaders can act immediately rather than relying on lagging reports. Comprehensive analytics and advanced data analytics are crucial for providing actionable insights into code quality, team performance, and process efficiency, enabling organizations to optimize their workflows. Predictive analytics use models to forecast delivery risks, resource constraints, and quality issues.
Contrast approaches:
Predictive analytics deliver preemptive insight into delivery risks and opportunities.
Comprehensive reporting capabilities, including support for DORA metrics, cycle time, and other key performance indicators, are essential for tracking the efficiency and effectiveness of your software engineering processes.
With analytics covered, let's look at how AI-native intelligence is becoming the new standard for SEI platforms.
This is where the competitive landscape is widening.
A Software Engineering Intelligence Platform in 2026 must leverage advanced tools and workflow automation to enhance engineering productivity, enabling teams to streamline processes, reduce manual work, and make data-driven decisions.
Key AI capabilities include:
AI coding assistants like GitHub Copilot and Tabnine use LLMs for real-time code generation and refactoring. These AI assistants can increase developer efficiency by up to 20% by offering real-time coding suggestions and automating repetitive tasks.
Most platforms today still rely on surface-level Git events. They do not understand code, model behavior, or multi-agent interactions. This is the defining gap for category leaders. Modern SEI platforms are evolving into autonomous development partners by using agentic AI to analyze repositories and provide predictive insights.
With AI-native intelligence in mind, let's explore how customizable dashboards and reporting support diverse stakeholder needs.
Dashboards must serve diverse roles. Engineering managers need team velocity and code-quality views. CTOs need strategic metrics tied to business outcomes. Individual contributors want personal workflow insights. Comprehensive analytics are essential to deliver detailed insights on code quality, team performance, and process efficiency, while the ability to focus on relevant metrics ensures each stakeholder can customize dashboards to highlight the KPIs that matter most to their goals.
Effective customization includes:
Balance standardization for consistent measurement with customization for role-specific relevance.
Next, let's see how AI-powered code insights and workflow optimization further enhance engineering outcomes.
AI features automate code reviews, detect code smells, and benchmark practices against industry data. Workflow automation and productivity metrics are leveraged to optimize engineering processes, streamline pull request management, and evaluate team effectiveness. They surface contextual recommendations for quality, security, and performance. Advanced platforms analyze commits, review feedback, and deployment outcomes to propose workflow changes.
Typo’s friction measurement for AI coding tools exemplifies research-backed methods to measure tool impact without disrupting workflows. AI-powered review and analysis speed delivery, improve code quality, and reduce manual review overhead.
Automated documentation tools generate API references and architecture summaries as code changes, reducing technical debt.
With workflow optimization in place, let's discuss how collaboration and communication features support distributed teams.
Integration with Slack, Teams, and meeting platforms consolidates context. Good platforms aggregate conversations and provide filtered alerts, automated summaries, and meeting recaps. Collaboration tools like Slack and Google Calendar play a crucial role in improving team productivity and team health by streamlining communication, supporting engagement, and enabling better tracking and compliance in software development workflows.
Key capabilities:
These features are particularly valuable for distributed or cross-functional teams. SEI platforms enable engineering leaders to make data-informed decisions that will drive positive business outcomes and foster consistent collaboration between teams throughout the CI/CD process.
With collaboration features established, let's look at how automation and process streamlining further improve efficiency.
Automation reduces manual work and enforces consistency. Workflow automation and advanced tools play a key role in improving engineering efficiency by streamlining repetitive tasks, reducing context switching, and enabling teams to focus on high-value work. Programmable workflows handle reporting, reminders, and metric tracking. Effective automation accelerates handoffs, flags incomplete work, and optimizes PR review cycles.
High-impact automations include:
The best automation is unobtrusive yet improves reliability and efficiency.
Real-time alerts for risky work such as large pull requests help reduce the change failure rate. Real-time analytics from software engineering intelligence platforms identify risky work patterns or reviewer overload before they delay releases.
With automation in place, let's address the critical requirements for security, compliance, and data privacy.
Enterprise adoption demands robust security, compliance, and privacy. Look for:
Evaluate data retention, anonymization options, user consent controls, and geographic residency support. Strong compliance capabilities are expected in enterprise-grade platforms. Assess against your regulatory and risk profile.
With security and compliance covered, let's explore how data-driven decision making is enabled by SEI platforms.
Data-driven decision making is at the heart of high-performing software development teams, and engineering intelligence platforms are the catalysts that make it possible. By aggregating and analyzing data from version control systems, project management tools, and communication tools, these platforms provide engineering leaders with a holistic view of team performance, productivity, and operational efficiency.
Engineering intelligence platforms leverage machine learning and predictive analysis to forecast potential risks and opportunities, enabling teams to proactively address challenges and capitalize on strengths. This approach ensures that every decision is backed by quantitative and qualitative data, reducing guesswork and aligning engineering processes with business outcomes.
With data-driven decision making, software development teams can continuously refine their workflows, improve software quality, and achieve greater alignment with organizational goals. The result is a more agile, efficient, and resilient engineering organization that is equipped to thrive in a rapidly changing software development landscape.
Now, let's discuss how to align platform selection with your organization's goals.
Align platform selection with business strategy through a structured, stakeholder-inclusive process. This maximizes ROI and adoption. It is essential to ensure the platform aligns with business goals and helps optimize engineering investments by demonstrating how engineering work supports organizational objectives and delivers measurable value.
Recommended steps:
Software engineering intelligence platforms provide real-time insights that empower teams to make swift, informed decisions and remain agile in response to evolving project demands.
With alignment strategies in place, let's move on to measuring the impact of your chosen platform.
Track metrics that link development activity to business outcomes. Prove platform value to executives. Engineering metrics, productivity metrics, workflow metrics, and quantitative data are essential for measuring the impact of engineering work, identifying inefficiencies, and driving continuous improvement. Core measurements include:
Measure leading indicators alongside lagging indicators. Tie metrics to customer satisfaction, revenue impact, or competitive advantage. Typo’s ROI approach links delivery improvements with developer NPS to show comprehensive value. Software engineering intelligence platforms provide detailed analytics and metrics, offering a clear picture of engineering health, resource investment, operational efficiency, and progress towards strategic goals.
Next, let's look at the unique metrics that only a software engineering intelligence platform can provide.
Traditional SDLC metrics aren’t enough. To truly measure and improve engineering effectiveness and engineering efficiency, software engineering intelligence platforms leverage advanced tools and data analytics to surface deeper insights. Intelligence platforms must surface deeper metrics such as:
Competitor blogs rarely cover these metrics, even though they define modern engineering performance.
SEI platforms provide a comprehensive view of software engineering processes, enabling teams to enhance efficiency and enforce quality throughout the development process.
With metrics in mind, let's discuss implementation considerations and how to achieve time to value.
Plan implementation with realistic timelines and a phased rollout. Demonstrate quick wins while building toward full adoption.
Typical timeline:
Expect initial analytics and workflow improvements within weeks. Significant productivity and cultural shifts take months.
Prerequisites:
Start small—pilot with one team or a specific metric. Prove value, then expand. Prioritize developer experience and workflow fit over exhaustive feature activation.
With implementation planned, let's define what a full-featured software engineering intelligence platform should provide.
Before exploring vendors, leaders should establish a clear definition of what “complete” intelligence looks like. This should include the need for advanced tools, comprehensive analytics, robust data integration, and the ability to analyze data from various sources to deliver actionable insights.
A comprehensive platform should provide:
Advanced SEI platforms also leverage predictive analytics to forecast potential challenges and suggest ways to optimize resource allocation.
With a clear definition in place, let's see how Typo approaches engineering intelligence.
Typo positions itself as an AI-native engineering intelligence platform for leaders at high-growth software companies. It aggregates real-time SDLC data, applies LLM-powered code and workflow analysis, and benchmarks performance to produce actionable insights tied to business outcomes. Typo is also an engineering management platform, providing comprehensive visibility, data-driven decision-making, and alignment between engineering teams and business objectives.
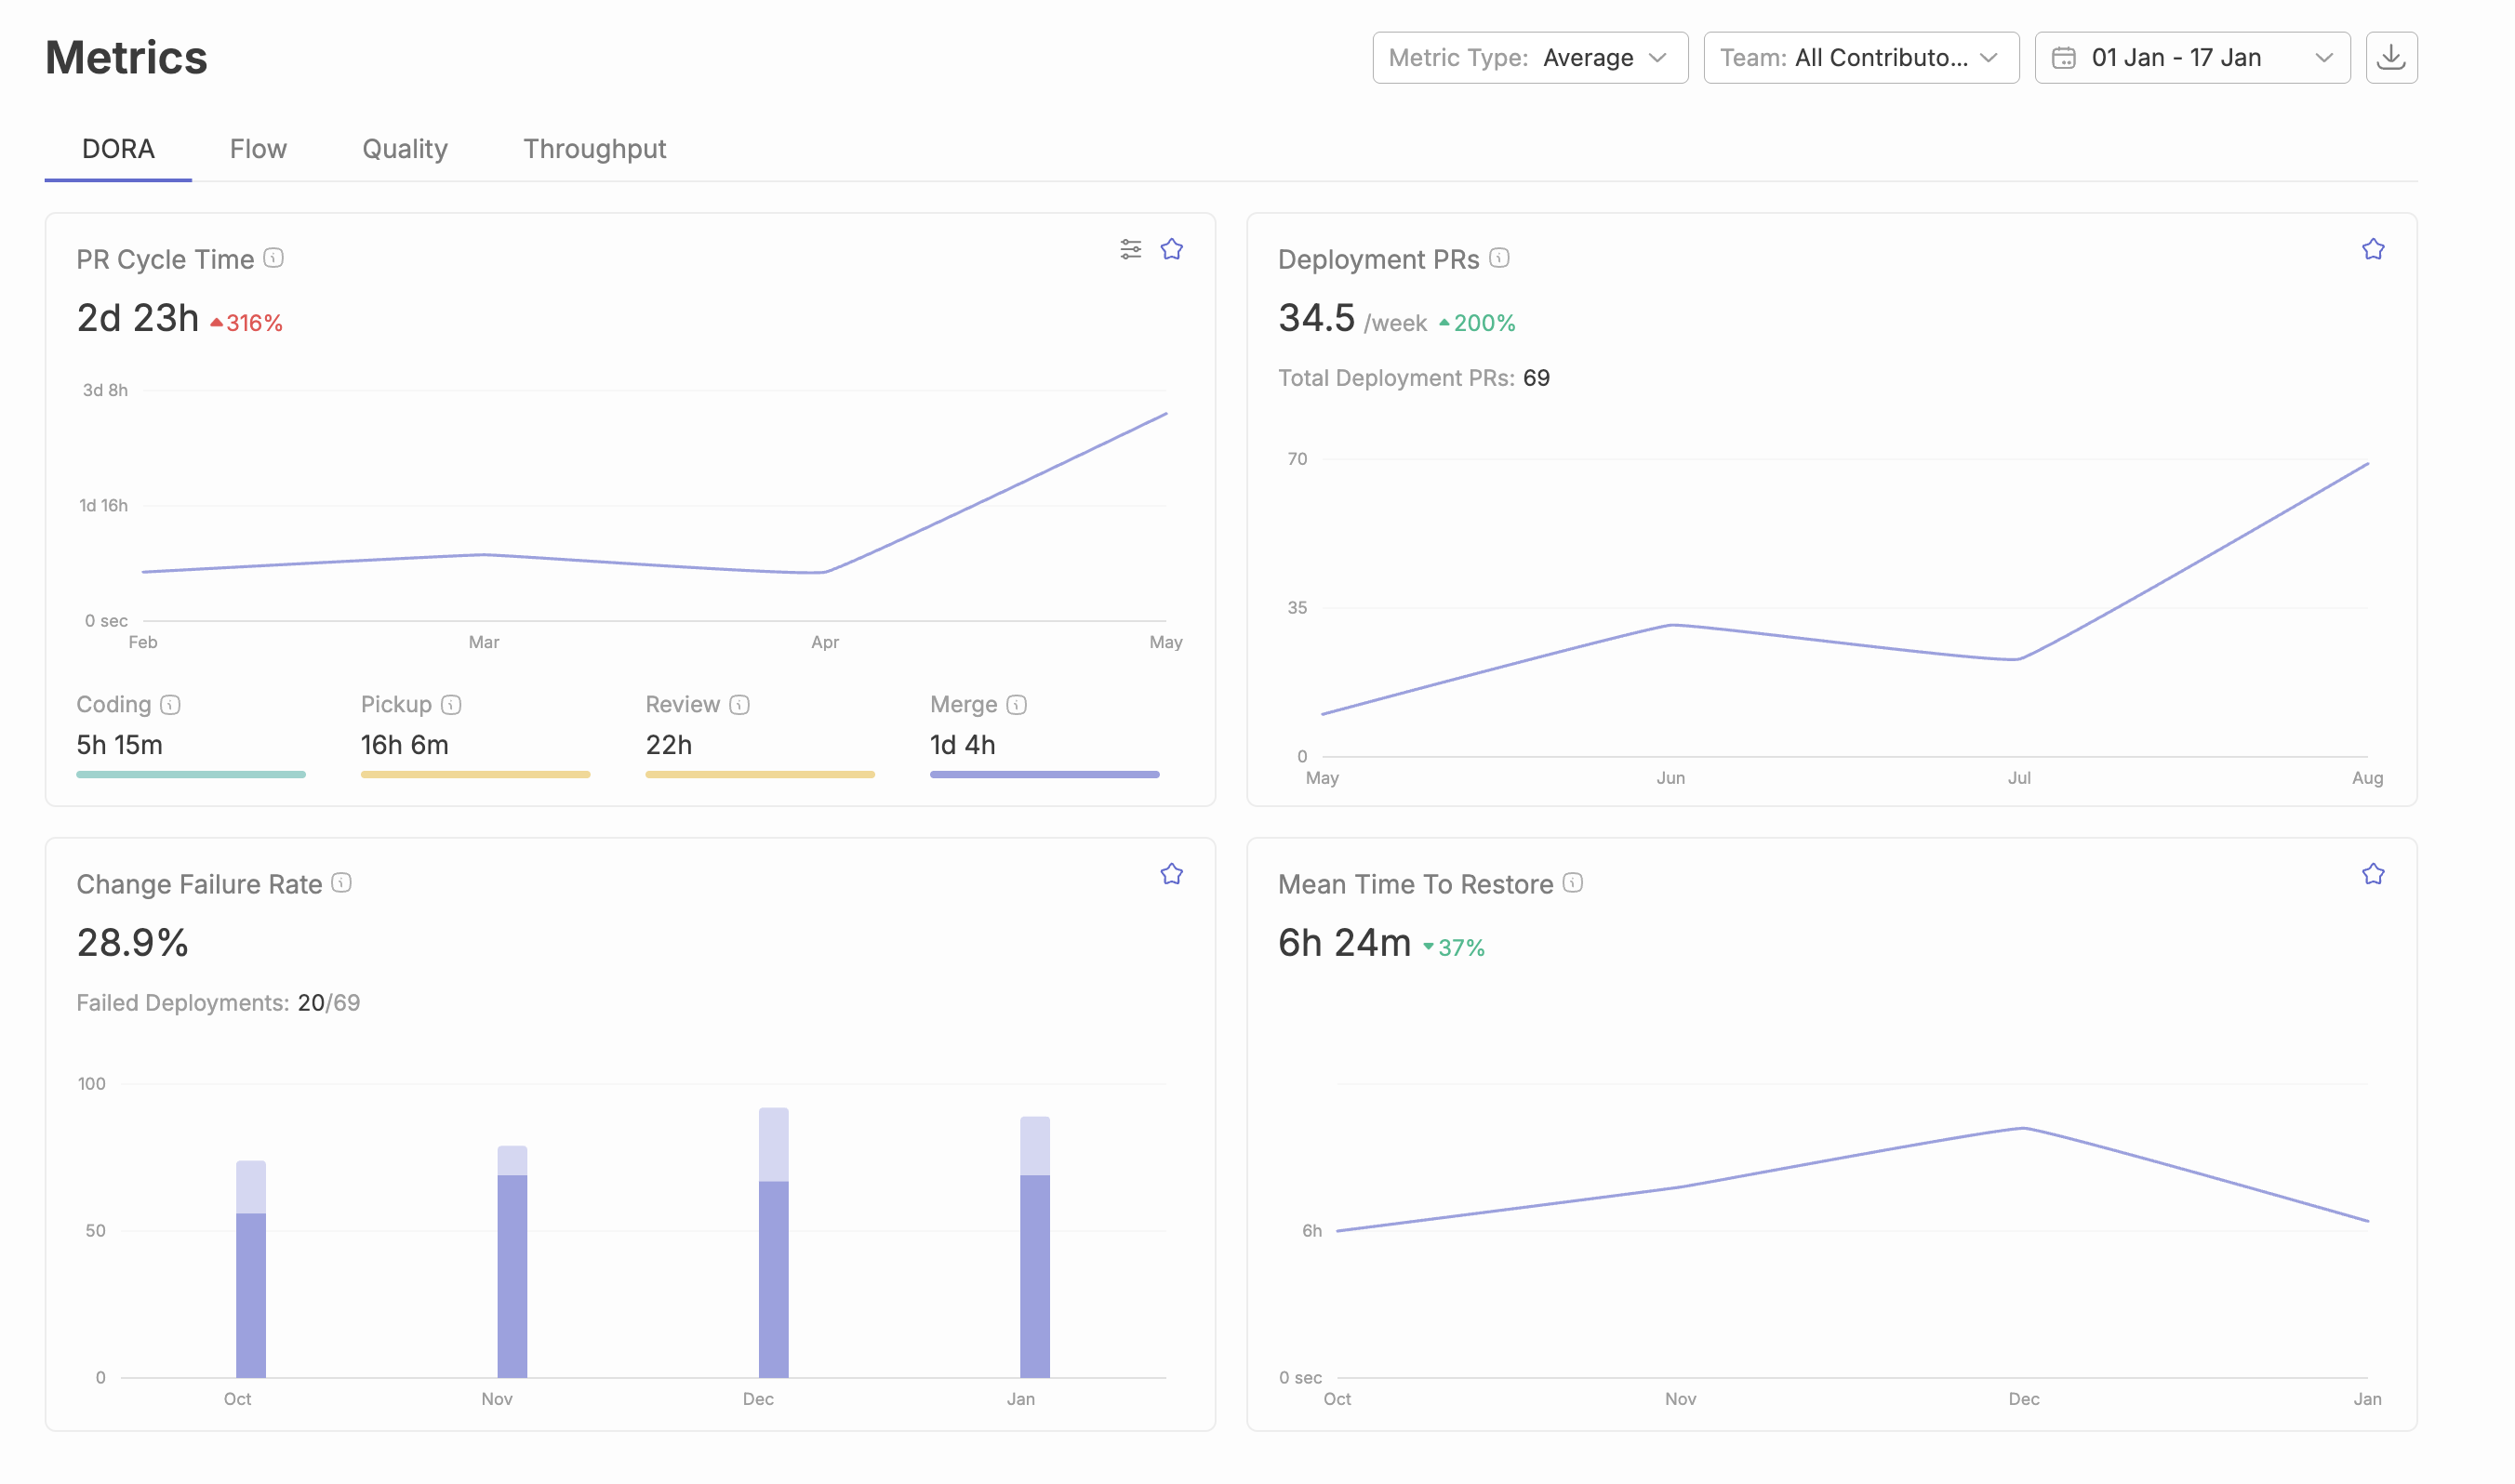
Other notable software engineering intelligence platforms in the space include:
Typo’s friction measurement for AI coding tools is research-backed and survey-free. Organizations can measure effects of tools like GitHub Copilot without interrupting developer workflows. The platform emphasizes developer-first onboarding to drive adoption while delivering executive visibility and measurable ROI from the first week.
Key differentiators include deep toolchain integrations, advanced AI insights beyond traditional metrics, and a focus on both developer experience and delivery performance.
With an understanding of Typo's approach, let's discuss how to evaluate SEI platforms during a trial.
Most leaders underutilize trial periods. A structured evaluation helps reveal real strengths and weaknesses.
During a trial, validate:
It's essential that software engineering intelligence platforms can analyze data from various sources and track relevant metrics that align with your team's goals.
A Software Engineering Intelligence Platform must prove its intelligence during the trial, not only after a long implementation. The best SEI platforms synthesize data from existing tools that engineering teams are already using, alleviating the burden of manual data collection.
With trial evaluation strategies in place, let's address some frequently asked questions.
What features should leaders prioritize in an engineering intelligence platform?
Leaders should prioritize key features such as real-time analytics, seamless integrations with existing tools like Jira, GitHub, and GitLab, and robust compatibility with project management platforms. Look for collaboration tools integration (e.g., Slack, Google Calendar) to enhance communication and compliance, as well as workflow automation to reduce manual work and streamline processes. AI-driven insights, customizable dashboards for different stakeholders, enterprise-grade security and compliance, plus collaboration and automation capabilities are essential to boost team efficiency.
How do I assess integration needs for my existing development stack?
Inventory your primary tools (repos, CI/CD, PM, communication). Prioritize platforms offering turnkey connectors for those systems. Verify bi-directional sync and unified analytics across the stack.
What is the typical timeline for seeing operational improvements after deployment?
Teams often see actionable analytics and workflow improvements within weeks. Major productivity gains appear in two months. Broader ROI and cultural change develop over several months.
How can engineering intelligence platforms improve developer experience without micromanagement?
Effective platforms focus on team-level insights and workflow friction, not individual surveillance. They enable process improvements and tools that remove blockers while preserving developer autonomy.
What role does AI play in modern engineering intelligence solutions?
AI drives predictive alerts, automated code review and quality checks, workflow optimization recommendations, and objective measurement of tool effectiveness. It enables deeper, less manual insight into productivity and quality.
With these FAQs addressed, let's conclude with a summary of why SEI platforms are indispensable for modern engineering teams.
In summary, software engineering intelligence platforms have become indispensable for modern engineering teams aiming to optimize their software development processes and achieve superior business outcomes. By delivering data-driven insights, enhancing collaboration, and enabling predictive analysis, these platforms empower engineering leaders to drive continuous improvement, boost developer productivity, and elevate software quality.
As the demands of software engineering continue to evolve, the role of software engineering intelligence tools will only become more critical. Modern engineering teams that embrace these platforms gain a competitive edge, leveraging actionable data to navigate complexity and deliver high-quality software efficiently. By adopting a data-driven approach to decision making and harnessing the full capabilities of engineering intelligence, organizations can unlock new levels of performance, innovation, and success in the software development arena.

Project management can get messy. Missed deadlines, unclear tasks, and scattered updates make managing software projects challenging.
Communication gaps and lack of visibility can slow down progress.
And if a clear overview is not provided, teams are bound to struggle to meet deadlines and deliver quality work. That’s where Jira comes in.
In this blog, we discuss everything you need to know about Jira to make your project management more efficient.
Jira is a project management tool developed by Atlassian, designed to help software teams plan, track, and manage their work. It’s widely used for agile project management, supporting methodologies like Scrum and Kanban.
With Jira, teams can create and assign tasks, track progress, manage bugs, and monitor project timelines in real time.
It comes with custom workflows and dashboards that ensure the tool is flexible enough to adapt to your project needs. Whether you’re a small startup or a large enterprise, Jira offers the structure and visibility needed to keep your projects on track.
Jira’s REST API offers a robust solution for automating workflows and connecting with third-party tools. It enables seamless data exchange and process automation, making it an essential resource for enhancing productivity.
Here’s how you can leverage Jira’s API effectively.
Jira’s API supports task automation by allowing external systems to create, update, and manage issues programmatically. Common scenarios include automatically creating tickets from monitoring tools, syncing issue statuses with CI/CD pipelines, and sending notifications based on issue events. This reduces manual work and ensures processes run smoothly.
For DevOps teams, Jira’s API simplifies continuous integration and deployment. By connecting Jira with CI/CD tools like Jenkins or GitLab, teams can track build statuses, deploy updates, and log deployment-related issues directly within Jira. Other external platforms, such as monitoring systems or customer support applications, can also integrate to provide real-time updates.
Follow these best practices to ensure secure and efficient use of Jira’s REST API:
Custom fields in Jira enhance data tracking by allowing teams to capture project-specific information.
Unlike default fields, custom fields offer flexibility to store relevant data points like priority levels, estimated effort, or issue impact. This is particularly useful for agile teams managing complex workflows across different departments.
By tailoring fields to fit specific processes, teams can ensure that every task, bug, or feature request contains the necessary information.
Custom fields also provide detailed insights for JIRA reporting and analysis, enabling better decision-making.
Jira supports a variety of issue types like stories, tasks, bugs, and epics. However, for specialized workflows, teams can create custom issue types.
Each issue type can be linked to specific screens and field configurations. Screens determine which fields are visible during issue creation, editing, and transitions.
Additionally, field behaviors can enforce data validation rules, ensure mandatory fields are completed, or trigger automated actions.
By customizing issue types and field behaviors, teams can streamline their project management processes while maintaining data consistency.
Jira Query Language (JQL) is a powerful tool for filtering and analyzing issues. It allows users to create complex queries using keywords, operators, and functions.
For example, teams can identify unresolved bugs in a specific sprint or track issues assigned to particular team members.
JQL also supports saved searches and custom dashboards, providing real-time visibility into project progress. Or explore Typo for that.
ScriptRunner is a powerful Jira add-on that enhances automation using Groovy-based scripting.
It allows teams to customize Jira workflows, automate complex tasks, and extend native functionality. From running custom scripts to making REST API calls, ScriptRunner provides limitless possibilities for automating routine actions.
With ScriptRunner, teams can write Groovy scripts to execute custom business logic. For example, a script can automatically assign issues based on specific criteria, like issue type or priority.
It supports REST API calls, allowing teams to fetch external data, update issue fields, or integrate with third-party systems. A use case could involve syncing deployment details from a CI/CD pipeline directly into Jira issues.
ScriptRunner can automate issue transitions based on defined conditions. When an issue meets specific criteria, such as a completed code review or passed testing, it can automatically move to the next workflow stage. Teams can also set up SLA tracking by monitoring issue durations and triggering escalations if deadlines are missed.
Event listeners in ScriptRunner can capture Jira events, like issue creation or status updates, and trigger automated actions. Post functions allow teams to execute custom scripts at specific workflow stages, enhancing operational efficiency.
Reporting and performance are critical in large-scale Jira deployments. Using SQL databases directly enables detailed custom reporting, surpassing built-in dashboards. SQL queries extract specific issue details, enabling customized analytics and insights.
Optimizing performance becomes essential as Jira instances scale to millions of issues. Efficient indexing dramatically improves query response times. Regular archiving of resolved or outdated issues reduces database load and enhances overall system responsiveness. Database tuning, including index optimization and query refinement, ensures consistent performance even under heavy usage.
Effective SQL-based reporting and strategic performance optimization ensure Jira remains responsive, efficient, and scalable.
Deploying Jira on Kubernetes offers high availability, scalability, and streamlined management. Here are key considerations for a successful Kubernetes deployment:
These practices ensure Jira runs optimally, maintaining performance and reliability in Kubernetes environments.
AI is quietly reshaping how software projects are planned, tracked, and delivered. Traditional Jira workflows depend heavily on manual updates, issue triage, and static dashboards; AI now automates these layers, turning Jira into a living system that learns and predicts. Teams can use AI to prioritize tasks based on dependencies, flag risks before deadlines slip, and auto-summarize project updates for leadership. In AI-augmented SDLCs, project managers and engineering leaders can shift focus from reporting to decision-making—letting models handle routine updates, backlog grooming, or bug triage.
Practical adoption means embedding AI agents at critical touchpoints: an assistant that generates sprint retrospectives directly from Jira issues and commits, or one that predicts blockers using historical sprint velocity. By integrating AI into Jira’s REST APIs, teams can proactively manage workloads instead of reacting to delays. The key is governance—AI should accelerate clarity, not noise. When configured well, it ensures every update, risk, and dependency is surfaced contextually and in real time, giving leaders a far more adaptive project management rhythm.
Typo extends Jira’s capabilities by turning static project data into actionable engineering intelligence. Instead of just tracking tickets, Typo analyzes Git commits, CI/CD runs, and PR reviews connected to those issues—revealing how code progress aligns with project milestones. Its AI-powered layer auto-generates summaries for Jira epics, highlights delivery risks, and correlates velocity trends with developer workload and review bottlenecks.
For teams using Jira as their source of truth, Typo provides the “why” behind the metrics. It doesn’t just tell you that a sprint is lagging—it identifies whether the delay comes from extended PR reviews, scope creep, or unbalanced reviewer load. Its automation modules can even trigger Jira updates when PRs are merged or builds complete, keeping boards in sync without manual effort.
By pairing Typo with Jira, organizations move from basic project visibility to true delivery intelligence. Managers gain contextual insight across the SDLC, developers spend less time updating tickets, and leadership gets a unified, AI-informed view of progress and predictability. In an era where efficiency and visibility are inseparable, Typo becomes the connective layer that helps Jira scale with intelligence, not just structure.
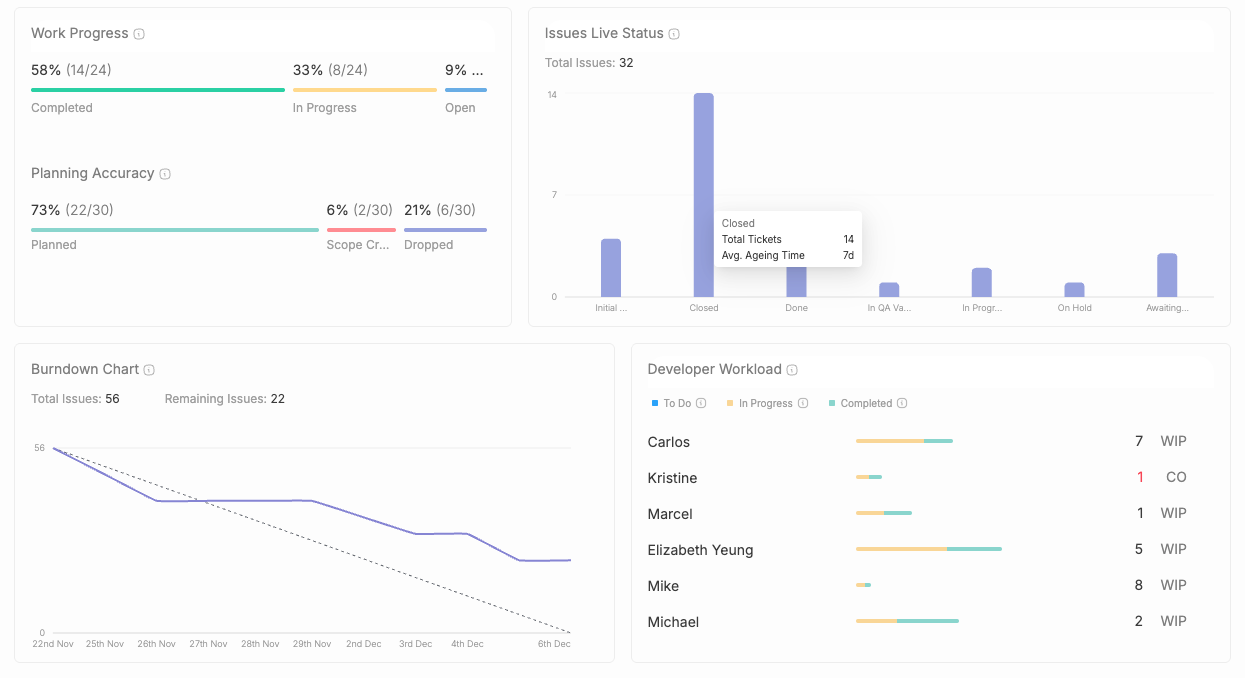
Jira transforms project management by streamlining workflows, enhancing reporting, and supporting scalability. It’s an indispensable tool for agile teams aiming for efficient, high-quality project delivery. Subscribe to our blog for more expert insights on improving your project management.
LOC (Lines of Code) has long been a go-to proxy to measure developer productivity.
Although easy to quantify, do more lines of code actually reflect the output?
In reality, LOC tells you nothing about the new features added, the effort spent, or the work quality.
In this post, we discuss how measuring LOC can mislead productivity and explore better alternatives.
Measuring dev productivity by counting lines of code may seem straightforward, but this simplistic calculation can heavily impact code quality. For example, some lines of code such as comments and other non-executables lack context and should not be considered actual “code”.
Suppose LOC is your main performance metric. Developers may hesitate to improve existing code as it could reduce their line count, causing poor code quality.
Additionally, you can neglect to factor in major contributors, such as time spent on design, reviewing the code, debugging, and mentorship.
Cyclomatic complexity measures a piece of code’s complexity based on the number of independent paths within the code. Although more complex, these code logic paths are better at predicting maintainability than LOC.
A high LOC with a low CC indicates that the code is easy to test due to fewer branches and more linearity but may be redundant. Meanwhile, a low LOC with a high CC means the program is compact but harder to test and comprehend.
Aiming for the perfect balance between these metrics is best for code maintainability.
Example Python script using the radon library to compute CC across a repository:
Python libraries like Pandas, Seaborn, and Matplotlib can be used to further visualize the correlation between your LOC and CC.

Despite LOC’s limitations, it can still be a rough starting point for assessments, such as comparing projects within the same programming language or using similar coding practices.
Some major drawbacks of LOC is its misleading nature, as it factors in code length and ignores direct performance contributors like code readability, logical flow, and maintainability.
LOC fails to measure the how, what, and why behind code contributions. For example, how design changes were made, what functional impact the updates made, and why were they done.
That’s where Git-based contribution analysis helps.
PyDriller and GitPython are Python frameworks and libraries that interact with Git repositories and help developers quickly extract data about commits, diffs, modified files, and source code.
Alternatively, the Gift Analytics platform can help teams visualize their code with its ability to transform raw data from repos and code reviews into actionable takeaways.

Metrics to track and identify consistent and actual contributors:
Metrics to track and identify code dumpers:
A sole focus on output quantity as a performance measure leads to developers compromising work quality, especially in a collaborative, non-linear setup. For instance, crucial non-code tasks like reviewing, debugging, or knowledge transfer may go unnoticed.
Variance analysis identifies and analyzes deviations happening across teams and projects. For example, one team may show stable weekly commit patterns while another may have sudden spikes indicating code dumps.
Using generic metrics like the commit volume, LOC, deployment speed, etc., to indicate performance across roles is an incorrect measure.
For example, developers focus more on code contributions while architects are into design reviews and mentoring. Therefore, normalization is a must to evaluate role-wise efforts effectively.
Three more impactful performance metrics that weigh in code quality and not just quantity are:
Defect density measures the total number of defects per line of code, ideally measured against KLOC (a thousand lines of code) over time.
It’s the perfect metric to track code stability instead of volume as a performance indicator. A lower defect density indicates greater stability and code quality.
To calculate, run a Python script using Git commit logs and big tracker labels like JIRA ticket tags or commit messages.
The change failure rate is a DORA metric that tells you the percentage of deployments that require a rollback or hotfix in production.
To measure, combine Git and CI/CD pipeline logs to pull the total number of failed changes.
This measures the average time to respond to a failure and how fast changes are deployed safely into production. It shows how quickly a team can adapt and deliver fixes.
Three ways you can implement the above metrics in real time:
Integrating your custom Python dashboard with GitHub or GitLab enables interactive data visualizations for metric tracking. For example, you could pull real-time data on commits, lead time, and deployment rate and display them visually on your Python dashboard.
If you want to forget the manual work, try tools like Prometheus - a monitoring system to analyze data and metrics across sources with Grafana - a data visualization tool to display your monitored data on customized dashboards.
CI/CD pipelines are valuable data sources to implement these metrics due to a variety of logs and events captured across each pipeline. For example, Jenkins logs to measure lead time for changes or GitHub Actions artifacts to oversee failure rates, slow-running jobs, etc.
Caution: Numbers alone don’t give you the full picture. Metrics must be paired with context and qualitative insights for a more comprehensive understanding. For example, pair metrics with team retros to better understand your team’s stance and behavioral shifts.
Combine quantitative and qualitative data for a well-balanced and unbiased developer performance model.
For example, include CC and code review feedback for code quality, DORA metrics like bug density to track delivery stability, and qualitative measures within collaboration like PR reviews, pair programming, and documentation.
Metric gaming can invite negative outcomes like higher defect rates and unhealthy team culture. So, it’s best to look beyond numbers and assess genuine progress by emphasizing trends.
Although individual achievements still hold value, an overemphasis can demotivate the rest of the team. Acknowledging team-level success and shared knowledge is the way forward to achieve outstanding performance as a unit.
Lines of code are a tempting but shallow metric. Real developer performance is about quality, collaboration, and consistency.
With the right tools and analysis, engineering leaders can build metrics that reflect the true impact, irrespective of the lines typed.
Use Typo’s AI-powered insights to track vital developer performance metrics and make smarter choices.

Not all parts of your codebase are created equal. Some functions are trivial; others are hard to reason about, even for experienced developers. Accidental complexity—avoidable complexity introduced by poor implementation choices like convoluted code or unnecessary dependencies—can make code unnecessarily difficult to manage. And this isn’t only about how complex the logic is, it’s also about how critical that logic is to your business. Your core domain logic carries more weight than utility functions or boilerplate code.
To make smart decisions about refactoring, reviewing, or isolating code, you need a way to measure how difficult it is to understand. Code understandability is a key factor in assessing code quality and maintainability. Using static analysis tools can help identify potentially complex functions and code smells that contribute to cognitive load.
That’s where cognitive complexity comes in. It helps quantify how mentally taxing a piece of code is to read and maintain.
In this blog, we’ll explore what cognitive complexity is and how you can use it to write more maintainable software.
This idea of cognitive complexity was borrowed from psychology not too long ago. It measures how difficult code is to understand. The cognitive complexity metric is a tool used to measure the mental effort required to understand and work with code, helping evaluate code maintainability and readability.
Cognitive complexity reflects the mental effort required to read and reason about a function or module. The more nested loops, conditional statements, logical operators, or jumps in logic, like if-else, switch, or recursion, the higher the cognitive complexity.
Unlike cyclomatic complexity, which counts the number of independent execution paths through code, cognitive complexity focuses on readability and human understanding, not just logical branches. Cyclomatic complexity measures the number of independent execution paths, which is important for testing, debugging, and maintainability. Cyclomatic complexity offers advantages in evaluating code’s structural complexity, testing effort, and decision-making processes, improving code quality and maintainability. Cyclomatic complexity is important for estimating testing effort. Cyclomatic and cognitive complexity are complementary metrics that together help assess different aspects of code quality and maintainability. A control flow graph is often used to visualize these execution paths and analyze the code structure.
For example, deeply nested logic increases cognitive complexity but may not affect cyclomatic complexity as much.
Cognitive complexity uses a clear, linear scoring model to evaluate how difficult code is to understand. The idea is simple: the deeper or more tangled the control structures, the higher the cognitive load and the higher the score.
Here’s how it works:
For example, a simple “if” statement scores 1. Nest it inside a loop, and the score becomes 2. Add a switch with multiple cases, and it grows further. Identifying and refactoring complex methods is essential for keeping cognitive complexity manageable.
This method doesn’t punish code for being long, it focuses on how hard it is to mentally parse.
Static code analysis tools help automate the measurement of cognitive complexity. They scan your code without executing it, flagging sections that are difficult to understand based on predefined scoring rules. These tools play a crucial role in addressing cognitive complexity by identifying areas in the codebase that need simplification or improvement.
Tools like SonarQube, ESLint (with plugins), and CodeClimate can show high-complexity functions, making it easier to prioritize refactoring and improve code maintainability. By highlighting problematic code, these tools help improve code quality and improve code readability, guiding developers to write clearer and more maintainable code.
Integrating static code analysis into your build pipeline is quite simple. Most tools support CI/CD platforms like GitHub Actions, GitLab CI, Jenkins, or CircleCI. You can configure them to run on every pull request or commit, ensuring complexity issues are caught early. Automating these checks can significantly boost developer productivity by streamlining the review process and reducing manual effort.
For example, with SonarQube, you can link your repository, run a scanner during your build, and view complexity scores in your dashboard or directly in your IDE. This promotes a culture of clean, understandable code before it ever reaches production. Additionally, these tools support refactoring code by making it easier to spot and address complex areas, further enhancing code quality and team collaboration.
In software development, code structure and readability serve as the cornerstone for dramatically reducing cognitive complexity and ensuring exceptional long-term code quality. When code is masterfully organized—with crystal-clear naming conventions, modular design, and streamlined dependencies—it transforms into an intuitive landscape that software developers can effortlessly understand, maintain, and extend. Conversely, cognitive complexity skyrockets in codebases plagued by deeply nested conditionals, multiple layers of abstraction, and inadequate naming practices. These critical issues don't just make code harder to follow—they exponentially increase the mental effort required to work with it, leading to overwhelming cognitive load and amplified potential for errors.
How Can Development Teams Address Cognitive Complexity?
To tackle cognitive complexity head-on in software, development teams must prioritize code readability and maintainability as fundamental pillars. Powerful refactoring techniques revolutionize code quality by: Following effective strategies like the SOLID principles helps reduce complexity by breaking code into independent modules.
Code refactoring doesn't alter what the code accomplishes—it transforms the code into an easily understood and manageable asset, which proves essential for slashing technical debt and elevating code quality over time.
What Role Do Automated Tools Play?
Automated tools emerge as game-changers in this transformative process. By intelligently analyzing code complexity and pinpointing areas with elevated cognitive complexity scores, these sophisticated tools help teams identify complex code areas demanding immediate attention. This capability enables developers to measure code complexity objectively and strategically prioritize refactoring efforts where they'll deliver maximum impact.
How Does Cognitive Complexity Differ from Cyclomatic Complexity?
It's crucial to recognize the fundamental distinction between cyclomatic complexity and cognitive complexity. Cyclomatic complexity focuses on quantifying the number of linearly independent paths through a program's source code, delivering a mathematical measure of code complexity. However, cognitive complexity shifts the spotlight to human cognitive load—the actual mental effort required to comprehend the code's structure and logic. While high cyclomatic complexity often signals complex code that may also exhibit high cognitive complexity, these two metrics address distinctly different aspects of code maintainability. Both cognitive complexity and cyclomatic complexity have their limitations and should be used as part of a broader assessment strategy.
Why Is Measuring Cognitive Complexity Essential?
Measuring cognitive complexity proves indispensable for managing technical debt and achieving superior software engineering outcomes. Revolutionary metrics such as cognitive complexity scores, Halstead complexity measures, and code churn deliver valuable insights into how code evolves and where the most challenging areas emerge. By diligently tracking these metrics, development teams can make informed, strategic decisions about where to invest precious time in code refactoring and how to effectively manage cognitive complexity across expansive software projects.
How Can Teams Handle Complex Code Areas?
Complex code areas—particularly those involving intricate algorithms, legacy code, or high essential complexity—can present formidable maintenance challenges. However, by applying targeted refactoring techniques, enhancing code structure, and eliminating unnecessary complexities, developers can transform even the most daunting code into manageable, accessible assets. This approach doesn't just reduce cognitive load on individual developers—it dramatically improves overall team productivity and code maintainability.
What Impact Does Documentation Have on Cognitive Complexity?
Proper documentation emerges as another pivotal factor in mastering cognitive complexity management. Clear, comprehensive documentation provides essential context about system design, architecture, and programming decisions, making it significantly easier for developers to navigate complex codebases and efficiently onboard new team members. Additionally, gaining visibility into where teams invest their time—through advanced analytics platforms—helps organizations identify bottlenecks and champion superior software outcomes.
The Path Forward: Transforming Software Development
In summary, code structure and readability stand as fundamental pillars for reducing cognitive complexity in software development. By leveraging powerful refactoring techniques, cutting-edge automated tools, and comprehensive documentation, development teams can dramatically decrease the mental effort required to understand and maintain code. This strategic approach leads to enhanced code quality, reduced technical debt, and more successful software projects that drive organizational success.
No matter how hard you try, more cognitive complexity will always creep in as your projects grow. Be careful not to let your code become overly complex, as this can make it difficult to understand and maintain. Fortunately, you can reduce it with intentional refactoring. The goal isn’t to shorten code, it’s to make it easier to read, reason about, and maintain. Writing maintainable code is essential for long-term project success. Encouraging ongoing education and adaptation of new, more straightforward coding techniques or languages can contribute to a culture of simplicity and clarity.
Let’s look at effective techniques in both Java and JavaScript. Poor naming conventions can increase complexity, so addressing them should be a key part of your refactoring process. Using meaningful names for functions and variables makes your code more intuitive for you and your team.
In Java, nested conditionals are a common source of complexity. A simple way to flatten them is by using guard clauses, early returns that eliminate the need for deep nesting. This helps readers focus on the main logic rather than the edge cases.
Another technique is to split long methods into smaller, well-named helper methods. Modularizing logic improves clarity and promotes reuse. When dealing with repetitive switch or if-else blocks, the strategy pattern can replace branching logic with polymorphism. This keeps decision-making localized and avoids long, hard-to-follow condition chains. Maintaining the same code, rather than repeatedly modifying or refactoring the same sections, promotes code stability and reduces unnecessary changes.
// Before
if (user != null) {
    if (user.isActive()) {
        process(user);
    }
}

// After (Lower Complexity)
if (user == null || !user.isActive()) return;
process(user);
JavaScript projects often suffer from “callback hell” due to nested asynchronous logic. Refactoring these sections using async/await greatly simplifies the structure and makes intent more obvious. Different programming languages offer various features and patterns for managing complexity, which can influence how developers approach these challenges.
Early returns are just as valuable in JavaScript as in Java. They reduce nesting and make functions easier to follow.
For array processing, built-in methods like map, filter, and reduce are preferred over traditional loops. They communicate purpose more clearly and eliminate the need for manual state tracking. Tracking average code and average code changes in pull requests can help teams assess the impact of refactoring on code complexity and identify potential issues related to large or complex modifications.
// Before
let total = 0;
for (let i = 0; i < items.length; i++) {
    total += items[i].price;
}

// After (Lower Complexity)
const total = items.reduce((sum, item) => sum + item.price, 0);
By applying these refactoring patterns, teams can reduce mental overhead and improve the maintainability of their codebases, without altering functionality.
You get the real insights to improve your workflows only by tracking the cognitive complexity over time. Visualization helps engineering teams spot hot zones in the codebase, identify regressions, and focus efforts where they matter most. Managing complexity in large software systems is crucial for long-term maintainability, as it directly impacts how easily teams can adapt and evolve their codebases.
Without it, complexity issues often go unnoticed until they cause real problems in maintenance or onboarding.
Engineering analytics platforms like Typo make this process seamless. They integrate with your repositories and CI/CD workflows to collect and visualize software quality metrics automatically. Analyzing the program's source code structure with these tools helps teams understand and manage complexity by highlighting areas with high cognitive or cyclomatic complexity.
With dashboards and trend graphs, teams can track improvements, set thresholds, and catch increases in complexity before they accumulate into technical debt.
There are also tools out there that can help you visualize:
You can also correlate cognitive complexity with critical software maintenance metrics. High-complexity code often leads to:
By visualizing these links, teams can justify technical investments, reduce long-term maintenance costs, and improve developer experience.
Managing cognitive complexity at scale requires automated checks built into your development process.
By enforcing thresholds consistently across the SDLC, teams can catch high-complexity code before it merges and prevent technical debt from piling up.
The key is to make this process visible, actionable, and gradual so it supports, rather than disrupts, developer workflows.
As projects grow, it's natural for code complexity to increase. However, unchecked complexity can hurt productivity and maintainability. But this is not something that can't be mitigated.
Code review platforms like Typo simplify the process by ensuring developers don't introduce unnecessary logic and providing real-time feedback. Optimizing code reviews can help you track key metrics, like pull requests, code hotspots, and trends to prevent complexity from slowing down your team.
With Typo, you get complete visibility into your code quality, making it easier to keep complexity in check.

Ensuring software quality is non-negotiable. Every software project needs a dedicated quality assurance mechanism. Combining both quantitative and qualitative metrics is essential to gain a complete picture of software quality, developer experience, and engineering productivity. By integrating quantitative data with qualitative feedback, teams can achieve a well-rounded understanding of their experience and identify actionable insights for continuous improvement.
But measuring quality is not always so simple. Shorter lead times, for instance, indicate an efficient development process, allowing teams to respond quickly to market changes and user feedback.
There are numerous metrics available, each providing different insights. However, not all metrics need equal attention. Quantitative metrics offer measurable, data-driven insights into aspects like code reliability and performance, while qualitative metrics provide subjective assessments that capture code quality from reviews and static analysis. Both perspectives are valuable for a comprehensive evaluation of software quality.
The key is to track those that have a direct impact on software performance and user experience. Avoid focusing on vanity metrics, as these superficial measures can be misleading and do not accurately reflect true software quality or success.
Software metrics constitute the fundamental cornerstone for comprehensively evaluating software quality, reliability, and performance parameters throughout the intricate software development lifecycle, enabling development teams to harness unprecedented insights into the sophisticated methodologies through which their software products are architected, maintained, and systematically enhanced. Key metrics for software quality include defect density, Mean Time to Recovery (MTTR), deployment frequency, and lead time for changes. These comprehensive quality metrics facilitate software developers in identifying critical bottlenecks, monitoring developmental trajectories, and ensuring that the final deliverable aligns seamlessly with user expectations while meeting stringent quality benchmarks. By strategically tracking the optimal software metrics, development teams gain the capability to make data-driven decisions that transform workflows, optimize resource allocation patterns, and consistently deliver high-caliber software solutions. Tracking and improving these metrics directly contributes to a more reliable, secure, and maintainable software product, ensuring it fulfills both complex business objectives and evolving customer requirements through advanced analytical approaches and performance optimization strategies.
Software metrics serve as the fundamental framework for establishing a robust and data-driven software development ecosystem, providing comprehensive methodologies to systematically measure, analyze, and optimize software quality across all development phases. How do software quality metrics transform development workflows? By implementing strategic quality measurement frameworks, development teams gain unprecedented visibility into software performance benchmarks, enabling detailed analysis of how their applications perform against stringent user expectations and evolving industry standards. These sophisticated quality metrics empower software developers to conduct thorough assessments of codebase strengths and weaknesses, utilizing advanced analytics to ensure that every software release demonstrates measurable improvements in reliability, operational efficiency, and long-term maintainability compared to previous iterations.
What makes tracking the right software metrics essential for driving continuous improvement across development lifecycles? Strategic metric implementation empowers development teams to make data-driven decisions, systematically optimize development workflows, and proactively identify and address potential issues before they escalate into critical production problems. In today's rapidly evolving and highly competitive development environments, understanding the comprehensive importance of software metrics implementation becomes vital—not only for consistently delivering high-quality software products but also for effectively meeting dynamically evolving customer requirements while maintaining a strategic competitive advantage in the marketplace. Ultimately, comprehensive software quality metrics serve as the cornerstone for building exceptional software products that consistently exceed user expectations through measurable performance improvements, while simultaneously supporting sustainable long-term business growth and organizational success through data-driven development practices.
In software development, grasping the distinct types of software metrics transforms how teams gain comprehensive insights into project health and software quality. Product metrics dive deep into the software’s inherent attributes, analyzing code quality, defect density, and performance characteristics that directly shape how applications function and reveal optimization opportunities. These metrics empower teams to assess software functionality and pinpoint areas ripe for enhancement. Process metrics, on the other hand, revolutionize how teams evaluate development workflow effectiveness, examining test coverage, test execution patterns, and defect management strategies that streamline delivery pipelines. By monitoring these critical indicators, teams reshape their workflows and ensure efficient, predictable delivery cycles. Project metrics provide a broader lens, tracking customer satisfaction trends, user acceptance testing outcomes, and deployment stability patterns to measure overall project success and anticipate future challenges.
It is essential to select relevant metrics within each category to ensure a comprehensive and meaningful evaluation of software quality and project health. Together, these metrics enable teams to monitor every stage of the software development lifecycle and drive continuous improvement that adapts to evolving technological landscapes.
Here are the numbers you need to keep a close watch on: Focusing on these critical metrics allows teams to track progress and ensure continuous improvement in software quality.
Code quality measures how well-written and maintainable a software codebase is. High quality code is well-structured, maintainable, efficient, and error-free, which is essential for scalability, reducing technical debt, and ensuring long-term reliability. Code complexity, often measured using automated tools, is a key factor in assessing code quality, as complex code is harder to understand, test, and maintain.
Poor code quality leads to increased technical debt, making future updates and debugging more difficult. It directly affects software performance and scalability.
Measuring code quality requires static code analysis, which helps detect vulnerabilities, code smells, and non-compliance with coding standards.
Platforms like Typo assist in evaluating factors such as complexity, duplication, and adherence to best practices.
Additionally, code reviews provide qualitative insights by assessing readability and overall structure. Maintaining high code quality is a core principle of software engineering, helping to reduce bugs and technical debt. Frequent defects in a specific module can help identify code quality issues that require attention.
Defect density determines the number of defects relative to the size of the codebase.
It is calculated by dividing the total number of defects by the total lines of code or function points. Tracking key metrics such as the number of defects fixed over time provides deeper insight into the effectiveness and efficiency of the defect resolution process. Monitoring defects fixed helps measure how quickly and effectively issues are addressed, which directly contributes to improved software reliability and stability.
A higher defect density indicates a higher likelihood of software failure, while a lower defect density suggests better software quality.
This metric is particularly useful when comparing different releases or modules within the same project.
MTTR measures how quickly a system can recover from failures. It is crucial for assessing software resilience and minimizing downtime.
MTTR is calculated by dividing the total downtime caused by failures by the number of incidents.
A lower MTTR indicates that the team can identify, troubleshoot, and resolve issues efficiently. Efficient processes for fixing bugs play a key role in reducing MTTR and improving overall software stability. And it’s a problem if it’s high.
This metric measures the effectiveness of incident response processes and the ability of the system to return to operational status quickly.
Ideally, you should set up automated monitoring and well-defined recovery strategies to improve MTTR.
MTBF measures the average time a system operates before running into a failure. It reflects software reliability and the likelihood of experiencing downtime.
MTBF is calculated by dividing the total operational time by the number of failures.
If it's high, you get better stability, while a lower MTBF indicates frequent failures that may require improvements on architectural level.
Tracking MTBF over time helps teams predict potential failures and implement preventive measures.
How to increase it? Invest in regular software updates, performance optimizations, and proactive monitoring.
Cyclomatic complexity measures the complexity of a codebase by analyzing the number of independent execution paths within a program.
High cyclomatic complexity increases the risk of defects and makes code harder to test and maintain.
This metric is determined by counting the number of decision points, such as loops and conditionals, in a function.
Lower complexity results in simpler, more maintainable code, while higher complexity suggests the need for refactoring.
Code coverage measures the percentage of source code executed during automated testing.
A higher percentage means better test coverage, reducing the chances of undetected defects.
This metric is calculated by dividing the number of executed lines of code by the total lines of code. There are various methods and tools available to measure test coverage, such as statement, branch, and path coverage analyzers. These test coverage measures help ensure comprehensive validation of the software by evaluating the extent of testing and identifying untested areas.
While high coverage is desirable, it does not guarantee the absence of bugs, as it does not account for the effectiveness of test cases.
Note: Maintaining balanced coverage with meaningful test scenarios is essential for reliable software.
Test coverage assesses how well test cases cover software functionality.
Unlike code coverage, which measures executed code, test coverage focuses on functional completeness by evaluating whether all critical paths, edge cases, and requirements are tested. This metric helps teams identify untested areas and improve test strategies.
Measuring test coverage requires you to track executed test cases against total planned test cases and ensure all requirements are validated. It is especially important to cover user requirements to ensure the software meets user needs and delivers expected quality. The higher the test coverage, the more you can rely on software.
Static code analysis identifies defects without executing the code. It detects vulnerabilities, security risks, and deviations from coding standards. Static code analysis helps identify security vulnerabilities early and maintain software integrity throughout the development process.
Automated tools like Typo can scan the codebase to flag issues like uninitialized variables, memory leaks, and syntax violations. The number of defects found per scan indicates code stability.
Frequent or recurring issues suggest poor coding practices or inadequate developer training.
Lead time for changes measures how long it takes for a code change to move from development to deployment.
A shorter lead time indicates an efficient development pipeline. Streamlining approval processes and optimizing each stage of the development cycle are crucial for achieving an efficient development process, enabling faster delivery of changes.
It is calculated from the moment a change request is made to when it is successfully deployed.
Continuous integration, automated testing, and streamlined workflows help reduce this metric, ensuring faster software improvements.
Response time measures how quickly a system reacts to a user request. Slow response times degrade user experience and impact performance. Maintaining high system availability is also essential to ensure users can access the software reliably and without interruption.
It is measured in milliseconds or seconds, depending on the operation.
Web applications, APIs, and databases must maintain low response times for optimal performance.
Monitoring tools track response times, helping teams identify and resolve performance bottlenecks.
Resource utilization evaluates how efficiently a system uses CPU, memory, disk, and network resources.
High resource consumption without proportional performance gains indicates inefficiencies.
Engineering monitoring platforms measure resource usage over time, helping teams optimize software to prevent excessive load.
Optimized algorithms, caching mechanisms, and load balancing can help improve resource efficiency.
Crash rate measures how often an application unexpectedly terminates. Frequent crashes means the software is not stable.
It is calculated by dividing the number of crashes by the total number of user sessions or active users.
Crash reports provide insights into root causes, allowing developers to fix issues before they impact a larger audience.
Customer-reported bugs are the number of defects identified by users. If it’s high, it means the testing process is neither adequate nor effective. Defects reported by customers serve as a key metric for tracking quality issues that escape initial testing and for identifying areas where the QA process can be improved. Tracking customer-reported bugs helps assess software reliability from the end-user perspective and ensures that post-release issues are minimized.
These bugs are usually reported through support tickets, reviews, or feedback forms. Customer feedback is a critical source of information for identifying errors, bugs, and interface issues, helping teams prioritize updates and ensure user satisfaction. Tracking them helps assess software reliability from the end-user perspective.
A decrease in customer-reported bugs over time signals improvements in testing and quality assurance.
Proactive debugging, thorough testing, and quick issue resolution reduce reliance on user feedback for defect detection.
Release frequency measures how often new software versions are deployed. Frequent releases suggest an agile and responsive development process. Delivering new features quickly through frequent releases demonstrates an agile development process and allows teams to respond rapidly to market needs. This metric is especially critical in DevOps and continuous delivery environments, where maintaining a high release frequency ensures that users receive updates and improvements promptly.
This metric is especially critical in DevOps and continuous delivery environments.
A high release frequency enables faster feature updates and bug fixes. Optimizing development cycles is key to maintaining a balance between speed and stability, ensuring that releases are both fast and reliable. However, too many releases without proper quality control can lead to instability.
When you balance speed and stability, you can rest assured there will be continuous improvements without compromising user experience.
CSAT measures user satisfaction with software performance, usability, and reliability. It is gathered through post-interaction surveys where users rate their experience. Net promoter score (NPS) and net promoter scores are also widely used user satisfaction measures that provide valuable insights into customer loyalty, likelihood to recommend the product, and overall user perceptions. Meeting customer expectations is essential for achieving high satisfaction scores and ensuring long-term software success.
A high CSAT indicates a positive user experience, while a low score suggests dissatisfaction with performance, bugs, or usability.
Implementing a proactive approach to defect prevention and reduction serves as the cornerstone for achieving exceptional software quality outcomes in modern development environments. This comprehensive strategy involves closely monitoring defect density metrics across various components, which enables development teams to systematically pinpoint specific areas of the codebase that demonstrate higher susceptibility to errors and subsequently implement targeted interventions to prevent future issues from emerging. A robust QA process plays a crucial role in systematically identifying, tracking, and resolving defects, ensuring high product quality through comprehensive activities and metrics that improve testing effectiveness and overall quality assurance. The strategic utilization of advanced static code analysis tools, combined with the systematic implementation of regular code review processes, represents highly effective methodologies for the early detection and identification of potential problems before they manifest in production environments. These tools analyze code patterns, identify potential vulnerabilities, and ensure adherence to established coding standards throughout the development lifecycle. Establishing efficient and streamlined defect management processes ensures that identified defects are systematically tracked, properly categorized, and resolved with optimal speed and precision, thereby significantly minimizing the overall number of defects that ultimately reach end-users and impact their experience. This comprehensive approach not only substantially enhances customer satisfaction levels by delivering more reliable software products, but also strategically reduces long-term support costs and operational overhead, as fewer critical issues successfully navigate through to production environments where they would require costly emergency fixes and extensive remediation efforts.
In the rapidly evolving landscape of modern software development, data-driven decision-making has fundamentally transformed how teams deliver high-caliber software products that resonate with users. Software quality metrics serve as powerful catalysts that reshape every stage of the development lifecycle, empowering teams to dive deep into emerging trends, strategically prioritize breakthrough improvements, and optimize resource allocation with unprecedented precision. By harnessing advanced analytics around code quality indicators, comprehensive test coverage patterns, and defect density trajectories, developers can strategically streamline their efforts toward initiatives that will fundamentally transform software quality outcomes and elevate user satisfaction to new heights.
Static code analysis platforms, such as SonarQube and CodeClimate, facilitate early detection of code smells and complexity bottlenecks throughout the development cycle, dramatically reducing the volume of defects that infiltrate production environments. User satisfaction intelligence, captured through sophisticated surveys and real-time feedback mechanisms, delivers direct insights into how effectively software solutions align with user expectations and market demands. Test coverage analytics ensure that mission-critical software functions undergo comprehensive validation processes, substantially mitigating risks associated with undetected vulnerabilities. By leveraging these transformative quality metrics, development teams can revolutionize their development workflows, systematically eliminate technical debt accumulation, and consistently deliver software products that demonstrate both robust architecture and user-centric design excellence.
Implementing software quality metrics throughout the development lifecycle transforms how teams build reliable, high-performance software systems. But how exactly do these metrics drive quality improvements across every stage of development?
Development teams leverage diverse metric frameworks to assess and enhance software quality—from initial design concepts through deployment and ongoing maintenance. Consider test coverage measures: these metrics ensure comprehensive testing of critical software functions, dramatically reducing the likelihood of overlooked defects that could compromise system reliability.
Performance metrics dive deep into software efficiency and responsiveness under real-world operational conditions, while customer satisfaction surveys capture direct user feedback regarding whether the software truly fulfills their expectations and requirements.
Key Quality Indicators That Drive Success:
How do these metrics create lasting impact? By consistently tracking and analyzing these software quality indicators, development teams deliver high-performance software that not only satisfies but surpasses user requirements, fostering enhanced customer satisfaction and sustainable long-term success across the organization.
How do we maximize the impact of software quality metrics in today’s competitive landscape? The answer lies in strategically aligning these metrics with overarching business goals and organizational objectives. It is also crucial to align metrics with the unique objectives and success indicators of different team types, such as infrastructure, platform, and product teams, ensuring that each team measures what truly defines success in their specific domain. Let’s explore how this alignment transforms software development initiatives from mere technical exercises into powerful drivers of business value. By focusing on key metrics such as customer satisfaction scores, comprehensive user acceptance testing results, and deployment stability indicators, development teams can ensure that their software development efforts directly contribute to business objectives and exceed user expectations in measurable ways. These tools analyze historical performance data, user feedback patterns, and system reliability metrics to provide teams with actionable insights that matter most to stakeholders. Here’s how this strategic approach works: teams can prioritize improvements that deliver maximum business impact, systematically reduce technical debt that hampers long-term scalability, and streamline development processes through data-driven decision making. This comprehensive alignment ensures that software quality initiatives transcend traditional technical boundaries—they become strategic drivers of sustainable business value, enhanced customer success, and competitive advantage in the marketplace.
Quality assurance (QA) metrics have fundamentally transformed how development teams evaluate and optimize the effectiveness of software testing processes across modern development workflows. By strategically analyzing comprehensive metrics such as test coverage ratios, test execution efficiency, and defect leakage patterns, development teams can systematically identify critical gaps in their testing strategies and significantly enhance the reliability and robustness of their software products. Advanced practices encompass leveraging cutting-edge automated testing frameworks, maintaining comprehensive test suites with extensive coverage, and implementing systematic review processes of test results to proactively identify and address issues during early development phases. Continuous monitoring of customer-reported defects and deployment stability metrics further ensures that software solutions consistently meet user expectations and deliver optimal performance in complex real-world production scenarios. The strategic adoption of these sophisticated QA metrics and proven best practices directly results in elevated customer satisfaction levels, substantially reduced support operational costs, and the consistent delivery of exceptionally high-quality software solutions that drive organizational success.
You must track essential software quality metrics to ensure the software is reliable and there are no performance gaps. Selecting the right software quality metrics and aligning metrics with business goals is essential to accurately reflect each team's objectives and ensure effective quality management.
However, simply measuring them is not enough—real-time insights and automation are crucial for continuous improvement. Measuring software quality is important for maintaining the integrity and reliability of software products and software systems throughout their lifecycle.
Platforms like Typo help teams monitor quality metrics and also velocity, DORA insights, and delivery performance, ensuring faster issue detection and resolution. The key benefits of data-driven quality management include improved visibility, streamlined tracking, and better decision-making for software quality initiatives.
AI-powered code analysis and auto-fixes further enhance software quality by identifying and addressing defects proactively. Comprehensive software quality management should also include protecting sensitive data to prevent breaches and ensure compliance.
With the right tools, teams can maintain high standards while accelerating development and deployment.

In today’s fast-paced software development landscape, optimizing engineering performance is crucial for staying competitive. Engineering leaders need a deep understanding of workflows, team velocity, and potential bottlenecks. Engineering intelligence platforms provide valuable insights into software development dynamics, helping to make data-driven decisions.
Swarmia alternatives are trusted by teams around the world and are suitable for organizations worldwide, making them a credible choice for global engineering teams. A good alternative to Swarmia should integrate effortlessly with version control systems like Git, project management tools such as Jira, and CI/CD pipelines.
While Swarmia is a well-known player, it has attracted significant attention in the engineering management space due to its interface and insights, but it might not be the perfect fit for every team. This article explores the top Swarmia alternatives, giving you the knowledge to choose the best platform for your organization’s needs. We’ll delve into features, the benefits of each alternative, and potential drawbacks to help you make an informed decision.
Swarmia is an engineering intelligence platform designed to improve operational efficiency, developer productivity, and software delivery. It integrates with popular development tools and uses data analytics to provide actionable insights.
Key Functionalities:
Despite its strengths, Swarmia might not be ideal for everyone. Here’s why you might want to explore alternatives:
Rest assured, we have covered a range of solutions in this article to address these common challenges and help you find the right alternative.

Here is a list of the top six Swarmia alternatives, each with its own unique strengths.
The comparisons below are organized into different categories such as features, pros, and cons to help you evaluate which solution best fits your needs.
Typo is a comprehensive engineering intelligence platform providing end-to-end visibility into the entire SDLC. It focuses on actionable insights through integration with CI/CD pipelines and issue tracking tools. Typo delivers insights and analytics in multiple ways, including individual, team, and organizational perspectives, to enhance understanding and decision-making. Waydev focuses on implementing DORA and SPACE metrics, emphasizing management visibility and team wellness, unlike Swarmia.
Key Features:
Pros:
Cons:
G2 Reviews Summary:
G2 reviews indicate decent user engagement with a strong emphasis on positive feedback, particularly regarding customer support.
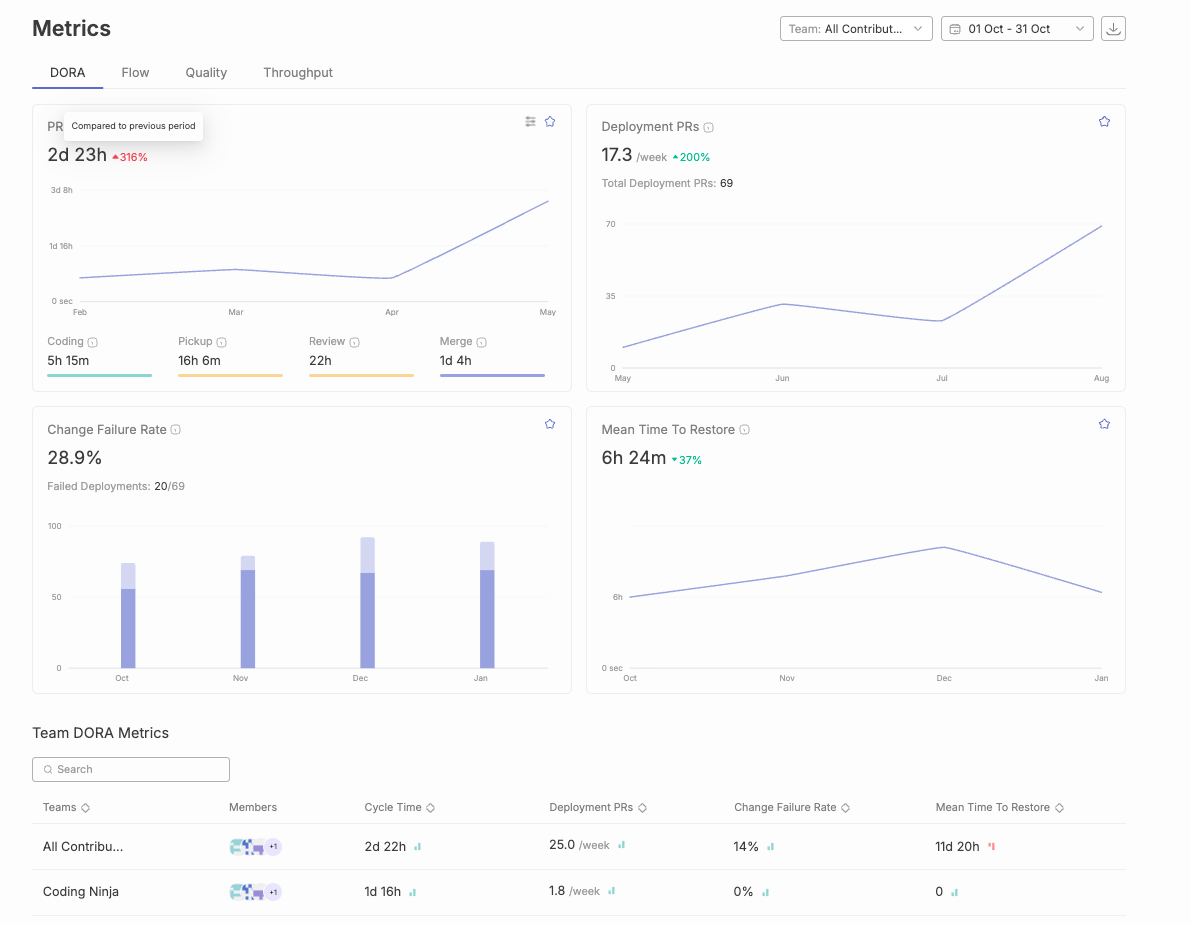
Jellyfish is an advanced analytics platform that aligns engineering efforts with broader business goals. It gives real-time visibility into development workflows and team productivity, focusing on connecting engineering work to business outcomes. Jellyfish helps organizations scale their engineering processes to meet business objectives, supporting automation, security, and governance at the enterprise level. Jellyfish alternatives are often considered for their automated data collection and actionable recommendations.
Key Features:
Pros:
Cons:
G2 Reviews Summary:
G2 reviews highlight strong core features but also point to potential implementation challenges, particularly around configuration and customization.

LinearB is a data-driven DevOps solution designed to improve software delivery efficiency and engineering team coordination. It focuses on data-driven insights, identifying bottlenecks, and optimizing workflows.
Key Features:
Pros:
Cons:
G2 Reviews Summary:
G2 reviews generally praise LinearB’s core features, such as flow management and insightful analytics. However, some users have reported challenges with complexity and the learning curve.

Waydev is an engineering analytics solution with a focus on Agile methodologies. It provides in-depth visibility into development velocity, resource allocation, and delivery efficiency, and enables teams to analyze work patterns to improve productivity and identify bottlenecks.
Key Features:
Pros:
Cons:
G2 Reviews Summary:
G2 reviews for Waydev are limited, making it difficult to draw definitive conclusions about user satisfaction.

Sleuth is a deployment intelligence platform specializing in tracking and improving DORA metrics. It provides detailed insights into deployment frequency and engineering efficiency, offering visibility into technical metrics such as deployment frequency and technical debt. Sleuth specializes in deployment tracking and change management with deep analytics on release quality and change impact.
Key Features:
Pros:
Cons:
G2 Reviews Summary:
G2 reviews for Sleuth are also limited, making it difficult to draw definitive conclusions about user satisfaction

Pluralsight Flow provides a detailed overview of the development process, helping identify friction and bottlenecks. Many engineering leaders use Pluralsight Flow to balance developer autonomy with advanced management insights. It aligns engineering efforts with strategic objectives by tracking DORA metrics, software development KPIs, and investment insights. It integrates with various manual and automated testing tools such as Azure DevOps and GitLab.
Key Features:
Pros:
Cons:
G2 Reviews Summary -
The review numbers show moderate engagement (6-12 mentions for pros, 3-4 for cons), placing it between Waydev’s limited feedback and Jellyfish’s extensive reviews. The feedback suggests strong core functionality but notable usability challenges.Link to Pluralsight Flow’s G2 Reviews

Developer productivity optimization and organizational health analytics comprise the foundational pillars of high-performing engineering ecosystems. For engineering leadership stakeholders, establishing equilibrium between output metrics and team well-being parameters becomes essential for achieving sustainable operational excellence. Comprehensive analytics platforms such as Swarmia and its enterprise alternatives, including Jellyfish and Haystack, are architected to deliver extensive insights into critical performance indicators such as code churn patterns, development velocity metrics, and workflow behavioral analytics. By systematically analyzing these data patterns, leadership teams can quantify productivity benchmarks, identify optimization opportunities, and establish objectives that facilitate both individual contributor advancement and cross-functional team development trajectories. The benefit of using these platforms is improved team performance, greater management visibility, and enhanced developer well-being.
Furthermore, these technological platforms facilitate transparency protocols and seamless communication channels among development team members, enabling enhanced detection of process bottlenecks and proactive challenge resolution mechanisms. Advanced features that monitor workflow patterns and code churn analytics assist leadership in understanding how development methodologies directly impact team health metrics and operational efficiency parameters. By leveraging these comprehensive insights, engineering organizations can implement targeted process enhancement strategies, elevate quality standards, and architect supportive environments where team members can achieve optimal performance outcomes. Ultimately, prioritizing developer productivity optimization and health analytics generates superior deliverable outcomes, enhanced operational efficiency, and establishes more resilient engineering team infrastructures.
Cycle time represents a fundamental metric that directly influences the success of engineering organizations pursuing high-quality software delivery at unprecedented speed. This critical measurement captures the complete duration from the initial moment work commences on a feature or bug fix until its final completion and deployment to end-users, serving as a comprehensive indicator of workflow efficiency across development pipelines. For engineering leaders navigating complex software development landscapes, understanding and systematically optimizing cycle time becomes essential to identify specific areas where development processes can be streamlined, operational bottlenecks can be eliminated, and overall organizational productivity can be significantly enhanced through data-driven decision making.
Modern engineering intelligence platforms such as Jellyfish and LinearB provide comprehensive analytical insights into cycle time performance by systematically breaking down each individual stage of the development process into measurable components. These sophisticated tools enable leaders to measure, analyze, and compare cycle time metrics across different teams, projects, and development phases, making it significantly easier to identify inefficiencies, spot emerging patterns, and implement targeted improvements that address root causes rather than symptoms. Additionally, seamless integrations with established platforms including GitHub and Jira facilitate continuous, real-time tracking of cycle time data, ensuring that performance metrics remain consistently up to date, actionable, and aligned with current development activities across the entire software development lifecycle.
Sleuth further enhances this analytical process by delivering detailed, context-aware recommendations based on comprehensive cycle time analysis, helping development teams identify specific areas requiring immediate attention and improvement. By systematically leveraging these data-driven insights, engineering organizations can make informed strategic decisions that consistently lead to faster delivery cycles, higher software quality standards, and more efficient development workflows that scale with organizational growth. Ultimately, maintaining a focused approach on cycle time optimization and operational efficiency empowers development teams to achieve their strategic development objectives while sustaining a competitive advantage in rapidly evolving software markets.
Engineering management platforms become even more powerful when they integrate with your existing tools. Seamless integration with platforms like Jira, GitHub, CI/CD systems, and Slack offers several benefits:
By leveraging these integrations, software teams can significantly boost productivity and focus on building high-quality products.
Security frameworks and regulatory compliance constitute fundamental architectural pillars for contemporary engineering organizations, particularly those orchestrating sophisticated development workflows that encompass sensitive intellectual property assets and proprietary data ecosystems. Swarmia and its comprehensive ecosystem of leading alternatives—including Typo, LinearB, GitLab, Sleuth, and Code Climate Velocity—acknowledge this critical paradigm by implementing robust security infrastructures and multi-layered compliance architectures that span the entire development lifecycle. These sophisticated platforms typically integrate end-to-end cryptographic protocols, granular role-based access control mechanisms, and systematic security audit frameworks that collectively safeguard mission-critical information assets throughout complex development processes. This involves implementing advanced encryption algorithms that protect data both in transit and at rest, while simultaneously establishing fine-grained permission structures that ensure appropriate access levels across diverse organizational hierarchies and development teams.
For engineering leadership stakeholders, these comprehensive security capabilities deliver strategic confidence and operational assurance, enabling development teams to optimize for velocity metrics and quality benchmarks without introducing security vulnerabilities or compliance gaps into their workflows. Additionally, specialized tools like Sleuth and Code Climate Velocity extend these foundational security measures by incorporating advanced vulnerability scanning engines and real-time compliance monitoring systems that enable organizations to proactively identify, assess, and remediate potential security risks while maintaining adherence to evolving regulatory frameworks and industry standards. These tools analyze code repositories, deployment patterns, and infrastructure configurations to detect potential security exposures before they manifest in production environments. By strategically selecting solutions that demonstrate comprehensive security architectures and compliance capabilities, engineering organizations can effectively protect their valuable intellectual assets, maintain stakeholder trust and regulatory standing, and streamline operational processes while consistently meeting stringent industry standards and regulatory requirements across diverse compliance frameworks.
The implementation of advanced engineering intelligence platforms represents a multifaceted technical undertaking that encompasses significant computational overhead and organizational adaptation requirements, yet the strategic selection of sophisticated analytical frameworks can fundamentally transform development optimization capabilities. Engineering intelligence solutions such as Swarmia, alongside competing platforms including Jellyfish and Haystack, are architected with streamlined initialization protocols and intuitive user experience (UX) patterns designed to accelerate time-to-value metrics for development organizations. These sophisticated platforms typically incorporate comprehensive Application Programming Interface (API) integrations with established development ecosystem tools including GitHub's distributed version control systems and Atlassian's Jira project management infrastructure, thereby enabling engineering leadership to establish seamless data pipeline connectivity while minimizing workflow disruption and maintaining operational continuity across existing development processes.
Furthermore, these advanced engineering analytics platforms provide extensive customization frameworks and comprehensive technical support ecosystems, facilitating organizational adaptation of the platform architecture to accommodate unique development methodologies and operational requirements specific to each engineering organization's technical stack. Through strategic prioritization of implementation efficiency and streamlined onboarding processes, engineering leadership can systematically reduce organizational change resistance, ensure optimal platform adoption trajectories, and enable development teams to concentrate computational resources on core software development activities rather than infrastructure configuration overhead. This optimized implementation methodology enables organizations to sustain development velocity metrics and achieve strategic technical objectives without introducing unnecessary deployment latency or operational bottlenecks.
Engineering teams striving to optimize productivity and revolutionize development workflows require comprehensive, data-driven insights and sophisticated recommendations that facilitate unprecedented operational excellence. Platforms such as Code Climate Velocity deliver transformative analytics capabilities by diving into critical engineering metrics including code churn patterns, velocity trajectories, and development cycle optimization. These sophisticated insights enable engineering managers to systematically identify performance bottlenecks, establish meaningful objectives aligned with organizational goals, and implement benchmarking frameworks that drive exponential efficiency gains and enhanced productivity outcomes.
Through leveraging real-time analytical capabilities and sophisticated dashboard interfaces, advanced tools such as Haystack and Waydev facilitate seamless monitoring of development trajectories while providing automated, intelligent recommendations specifically tailored to each team's unique operational workflows and technical requirements. These comprehensive platforms empower engineering managers to execute data-driven strategic decisions, systematically optimize development processes, and architect workflows that support continuous improvement methodologies and operational excellence. Advanced features comprising customizable metric frameworks and automated workflow intelligence ensure that development teams can rapidly identify performance bottlenecks, streamline complex development pipelines, and systematically achieve their strategic objectives through enhanced operational visibility.
With sophisticated, actionable insights at their disposal, engineering organizations can proactively address complex technical challenges, implement systematic process improvements, and cultivate an organizational culture centered on continuous learning, operational excellence, and enhanced efficiency metrics. This transformative approach not only optimizes team performance across all development phases but also facilitates superior software quality outcomes and accelerated delivery cycle optimization.
Engineering organizations operate within distinct operational paradigms and strategic frameworks, each demanding specialized solutions for development workflow optimization and performance analytics. How do we navigate the comprehensive ecosystem of Swarmia alternatives? The landscape presents a sophisticated array of platforms engineered to address diverse organizational architectures, from agile startup environments requiring rapid iteration capabilities to enterprise-scale operations demanding robust process governance and comprehensive integration frameworks.
For startup environments prioritizing velocity optimization and scalable development workflows, LinearB and Jellyfish emerge as sophisticated solutions engineered for dynamic scaling scenarios. These platforms deliver comprehensive development lifecycle analytics through advanced data aggregation engines, enabling engineering leadership to establish transparent performance baselines and implement data-driven optimization strategies. What makes enterprise-level implementations distinct? Platforms such as GitLab and GitHub provide enterprise-grade collaboration infrastructures with deep integration capabilities, advanced workflow orchestration, and comprehensive process management frameworks specifically architected for complex multi-team development ecosystems requiring sophisticated governance and compliance mechanisms.
Engineering leadership increasingly demands alternatives that prioritize advanced analytics capabilities, team health optimization metrics, and continuous process improvement frameworks. How do modern platforms address these sophisticated requirements? Code Climate Velocity and Haystack differentiate themselves through intelligent dashboard architectures, real-time algorithmic recommendations, and advanced features supporting collaborative working agreements and systematic improvement methodologies. Additionally, specialized platforms like Sleuth and Waydev focus on comprehensive cycle time analytics and workflow optimization engines, leveraging machine learning algorithms to identify performance bottlenecks and implement systematic process streamlining initiatives.
High-performance engineering organizations focused on comprehensive engineering intelligence require sophisticated analytics platforms that deliver actionable insights and strategic recommendations. Platforms such as Pensero and Pluralsight Flow provide advanced analytics engines, comprehensive performance benchmarking capabilities, and algorithmic recommendation systems designed to drive systematic process improvements and achieve strategic organizational objectives. Through systematic evaluation of these sophisticated alternatives using comprehensive assessment frameworks, engineering leadership can implement optimal solutions tailored to their specific operational requirements, ultimately achieving enhanced operational efficiency, comprehensive transparency, and superior software development performance outcomes.
When selecting a Swarmia alternative, keep these factors in mind:
The engineering management tools ecosystem undergoes rapid transformation, presenting sophisticated alternatives to Swarmia that address complex organizational requirements through advanced analytics and machine learning capabilities. How do engineering leaders navigate this evolving landscape? By analyzing historical performance data, deployment patterns, and team velocity metrics, these platforms deliver predictive insights that optimize resource allocation and identify potential bottlenecks before they impact development cycles. Modern alternatives leverage AI-driven algorithms to examine code quality patterns, automated testing coverage, and deployment success rates, enabling organizations to implement data-driven strategies that enhance developer productivity while maintaining robust security protocols and compliance standards.
Looking toward future developments, the market trajectory indicates accelerated innovation in intelligent automation, with emerging solutions integrating natural language processing for requirement analysis, machine learning models for predictive project planning, and AI-enhanced CI/CD pipeline optimization. How will these technological advancements reshape engineering management? By analyzing vast datasets from version control systems, incident response patterns, and team collaboration metrics, next-generation platforms will automatically generate actionable recommendations for workflow optimization and risk mitigation. Engineering organizations that embrace these AI-powered alternatives to Swarmia—featuring automated anomaly detection, intelligent resource scaling, and self-healing infrastructure monitoring—position themselves to achieve sustained competitive advantage through enhanced operational efficiency, reduced time-to-market, and improved software quality metrics in an increasingly complex technological landscape.
Choosing the right engineering analytics platform is a strategic decision. The alternatives discussed offer a range of capabilities, from workflow optimization and performance tracking to AI-powered insights. By carefully evaluating these solutions, engineering leaders can improve team efficiency, reduce bottlenecks, and drive better software development outcomes.
.png)
In today's fast-paced software development world, tracking progress and understanding project dynamics is crucial. GitHub Analytics transforms raw data from repositories into actionable intelligence, offering insights that enable teams to optimize workflows, enhance collaboration, and improve software delivery. This guide explores the core aspects of GitHub Analytics, from key metrics to best practices, helping you leverage data to drive informed decision-making.
GitHub Analytics provides invaluable insights into project activity, empowering developers and project managers to track performance, identify bottlenecks, and enhance productivity. Unlike generic analytics tools, GitHub Analytics focuses on software development-specific metrics such as commits, pull requests, issue tracking, and cycle time analysis. This targeted approach allows for a deeper understanding of development workflows and enables teams to make data-driven decisions that directly impact project success.
GitHub Analytics encompasses a suite of metrics and tools that help developers assess repository activity and project health.
While other analytics platforms focus on user behavior or application performance, GitHub Analytics specifically tracks code contributions, repository health, and team collaboration, making it an indispensable tool for software development teams. This focus on development-specific data provides unique insights that are not readily available from generic analytics platforms.


GitHub Analytics tools like Typo are powerful tools for software teams, providing critical insights into development performance, collaboration, and project health. By embracing these analytics, teams can streamline workflows, enhance software quality, improve team communication, and make informed, data-driven decisions that ultimately lead to greater project success.

Achieving engineering excellence isn’t just about clean code or high velocity. It’s about how engineering drives business outcomes. An engineering metrics dashboard is essential for translating technical performance into business outcomes.
This guide is designed for CTOs and engineering leaders who want to leverage engineering metrics dashboards to drive business value. We'll cover key metrics, dashboard tools, best practices for board presentations, and strategies for continuous improvement. By connecting engineering performance to business outcomes, you can ensure your team’s efforts are aligned with organizational goals and deliver measurable value.
Every CTO and engineering department manager must know the importance of metrics like cycle time, deployment frequency, or mean time to recovery. These numbers are crucial for gauging team performance and delivery efficiency. Engineering metrics dashboards help teams evaluate their development lifecycle and make data-driven improvements.
But here’s the challenge: converting these metrics into language that resonates in the boardroom.
In this blog, we’re going to share how you make these numbers more understandable, actionable, and impactful for business stakeholders.
Engineering metrics dashboards are platforms that aggregate, visualize, and analyze key performance indicators (KPIs) to provide insights into software development processes. Engineering metrics are quantifiable measures that assess various aspects of software development processes. Software engineering KPIs are measurable values used to track and evaluate the performance and effectiveness of engineering teams and their work. These metrics provide insights into team efficiency, software quality, and delivery speed. They are often referred to as key performance indicators (KPIs) and performance indicators, which are used to evaluate engineering teams, projects, and processes.
Some believe that engineering productivity can be effectively measured through data. Others argue that metrics oversimplify the complexity of high-performing teams.
Selecting the right engineering KPIs is crucial for getting an accurate picture of your team's performance and making data-driven decisions.
While the topic is controversial, the focus of metrics in the boardroom is different.
In the board meeting, these key engineering metrics and performance indicators are a means to show that the team is delivering value. The engineering operations are efficient. And the investments being made by the company are justified. The true value of metrics lies in the goals behind them rather than the metrics themselves, and metrics alone do not drive change; they must be combined with actionable targets and a culture of continuous improvement.
The real value of metrics comes from using them to drive a culture of continuous improvement.
Now that we’ve defined what an engineering metrics dashboard is and why it matters, let’s explore the importance of these dashboards in modern engineering organizations.
Engineering observability dashboards constitute comprehensive monitoring solutions that enable development and operations teams to track, measure, and optimize their software delivery performance through advanced metrics aggregation and real-time analytics capabilities. By providing centralized visibility into critical performance indicators (KPIs) such as DORA metrics, Mean Time to Recovery (MTTR), deployment frequency, and change lead time, these sophisticated monitoring platforms empower engineering leadership to conduct thorough performance analysis, rapidly identify system bottlenecks and performance anomalies, and execute data-driven strategic decisions.
Through continuous integration of real-time telemetry data encompassing deployment patterns, incident response metrics, and system reliability indicators, development teams can systematically identify performance trends, address infrastructure constraints, and implement targeted optimizations that drive measurable improvements in overall engineering delivery velocity and system reliability.
Well-architected engineering observability platforms not only enhance development productivity and operational efficiency through automated monitoring and intelligent alerting mechanisms but also cultivate organizational transparency and cross-functional collaboration by democratizing access to critical performance data across development, operations, and product teams.
By transforming complex telemetry data into accessible, actionable insights through advanced visualization techniques and automated anomaly detection, these dashboard solutions facilitate continuous improvement methodologies and ensure strategic alignment between technical execution metrics and broader business objectives.
Ultimately, comprehensive engineering observability dashboards function as the critical interface between tactical software development operations and strategic organizational success, ensuring that development lifecycle processes, deployment pipelines, and operational workflows are continuously optimized to deliver maximum business value while maintaining high system reliability and performance standards.
With a clear understanding of the importance of engineering dashboards, let’s examine the different types of engineering metrics you should be tracking.
Engineering metrics transform how development teams analyze performance and streamline development workflows. By categorizing these metrics strategically, engineering organizations can dive into comprehensive insights that enhance both technical excellence and business alignment, ensuring teams focus on optimizing the right areas for maximum impact.
By monitoring a strategically balanced mix of these engineering metrics, teams can generate actionable insights, streamline continuous improvement processes, and establish robust connections between their technical efforts and both performance optimization and business success trajectories.
Now that we've explored the main types of metrics, let's look at how capacity and downtime metrics fit into engineering performance management.
For engineering teams striving to maximize operational excellence and optimize resource efficiency, comprehensive monitoring of capacity utilization metrics represents a fundamental cornerstone of performance management. Capacity utilization encompasses the sophisticated measurement of resource allocation efficiency—quantifying the percentage of available assets including human capital, specialized equipment, computational infrastructure, and system architectures that are actively engaged in value-generating productive workflows.
Through systematic tracking and analysis of these critical performance indicators, engineering organizations can identify underutilized resource pools, implement strategic allocation optimizations, and ensure their operational frameworks are functioning at peak performance levels while maintaining scalable throughput capabilities.
Average downtime metrics, conversely, capture comprehensive temporal measurements of system unavailability periods where critical infrastructure, specialized equipment, or production environments remain non-operational due to scheduled maintenance interventions, corrective repair procedures, or unforeseen operational disruptions.
Elevated average downtime indicators frequently signal underlying process inefficiencies, resource constraint bottlenecks, or systemic architectural limitations that precipitate substantial productivity degradation and operational cost escalation. Through rigorous monitoring and analytical evaluation of both capacity utilization patterns and average downtime trends, engineering teams can proactively identify performance bottlenecks, implement predictive maintenance scheduling frameworks, and systematically minimize workflow disruptions across development and production environments.
These sophisticated performance metrics deliver actionable intelligence that empowers teams to implement strategic resource allocation decisions, enhance system reliability architectures, and ultimately drive substantial improvements in overall engineering productivity and operational efficiency.
With a solid grasp of capacity and downtime metrics, let’s address the challenges of communicating engineering metrics to the board.
Communicating engineering metrics to the board isn’t always easy. Here are some common hurdles you might face:
Engineering metrics often rely on technical terms like “cycle time” or “MTTR” (mean time to recovery). To someone outside the tech domain, these might mean little.
For example, discussing “code coverage” without tying it to reduced defect rates and faster releases can leave board members disengaged.
The challenge is conveying these technical terms into business language—terms that resonate with growth, revenue, and strategic impact.
Engineering teams track countless metrics, from pull request volumes to production incidents. While this is valuable internally, presenting too much data in board meetings can overwhelm your board members.
A cluttered slide deck filled with metrics risks diluting your message. These granular-level operational details are for managers to take care of the team. The board members, however, care about the bigger picture.
Metrics without context can feel irrelevant. For example, sharing deployment frequency might seem insignificant unless you explain how it accelerates time-to-market.
Aligning metrics with business priorities, like reducing churn or scaling efficiently, ensures the board sees their true value.
With these challenges in mind, let’s identify the key metrics CTOs should highlight in the boardroom.
Before we go on to solve the above-mentioned challenges, let’s talk about the five key categories of metrics one should be mapping. These categories serve as examples of engineering KPIs that can be tracked using an engineering metrics dashboard. Focusing on the most important metrics ensures that teams drive meaningful improvements and make better decisions.
A high-quality engineering KPI must have a clearly defined, quantifiable goal. The best KPIs for your engineering department will encourage and reward people for taking actions that benefit the company.
The five categories are:
Automated reporting on dashboards can save teams 8 to 16 hours per week compared to manual tracking methods.
These metrics show the engineering resource allocation and the return they generate.
These metrics focus on the team’s output and alignment with business goals.
Metrics in this category emphasize the reliability and performance of engineering outputs.
These metrics focus on engineering efficiency and operational stability.
Work performed and work scheduled are tracked to evaluate project cost and schedule efficiency, using metrics like Cost Performance Indicator (CPI) and Schedule Performance Indicator (SPI).
These metrics highlight team growth, engagement, and retention.
By focusing on these categories, you can show the board how engineering contributes to your company's growth.
Now, let’s dive deeper into industry-standard metrics with a focus on the DORA framework and deployment frequency.
Leveraging DORA metrics has fundamentally reshaped how engineering organizations measure and optimize their software delivery capabilities, establishing a comprehensive framework of key performance indicators that provides deep insights into development effectiveness. The DORA metrics provide a powerful framework for assessing and improving software delivery performance.
Key metrics in the DORA framework include:
Among these critical measurements, deployment frequency emerges as a pivotal metric that captures the rhythmic cadence of successful code releases into production environments. This performance indicator serves as an essential diagnostic tool for engineering leaders who aim to analyze and enhance the velocity and reliability of their development pipelines.
Deployment frequency encompasses the systematic measurement of how engineering teams deliver new features, critical bug fixes, and incremental updates to end-users across various deployment scenarios. When teams achieve high deployment frequency, it signals their ability to efficiently navigate code through complex development pipelines, enabling rapid response to evolving market trajectories and customer demands. Conversely, low deployment frequency often reveals underlying bottlenecks, manual intervention points, or systemic inefficiencies that create friction in the path from initial code creation to final production release.
Through systematic tracking of deployment frequency alongside complementary DORA metrics, engineering leaders gain actionable intelligence to pinpoint specific areas requiring process optimization and workflow enhancement. This data-driven approach enables teams to identify and eliminate operational obstacles, streamline development workflows, and adopt industry best practices that facilitate continuous improvement across all phases of software delivery. Ultimately, optimizing deployment frequency not only amplifies engineering performance metrics but also accelerates strategic business outcomes by delivering customer value faster and with greater reliability.
Integrating deployment frequency into your comprehensive engineering dashboard ensures that development teams remain laser-focused on delivering high-quality code to production environments efficiently, creating a powerful synergy that supports both technical excellence and strategic organizational objectives while enabling data-driven decision-making across the entire software development lifecycle.
With a strong grasp of DORA metrics, let’s explore the tools available for tracking and presenting engineering metrics.
Here are three tools that can help CTOs streamline the process and ensure their message resonates in the boardroom. Engineering metrics dashboards help teams evaluate their development lifecycle and make data-driven improvements. Some dashboards also allow you to calculate metrics such as outsourcing rate by tracking the total number of staff (both internal and external) involved in engineering projects. Companies may outsource a portion of their engineering work to external providers to optimize resources and reduce costs, and dashboards can help track and manage this aspect.
Typo is a lightweight, open-source tool for creating simple engineering dashboards. It connects to your GitHub or GitLab repositories and visualizes key metrics like deployment frequency, lead time, and code review activity. Swarmia makes tracking DORA and SPACE metrics easy.
Key Features:

Tableau and Looker are powerful business intelligence platforms that can be used to create custom engineering metrics dashboards. They offer a user-friendly interface, customizable widgets, and a variety of visualization options for building dashboards tailored to your team’s needs. These dashboards serve as engineering metrics dashboards for tracking performance indicators, helping you measure and evaluate engineering and development team performance.
With these, you can highlight trends, focus on key metrics, and connect them to business outcomes effectively. Jellyfish also provides a user-friendly interface for building dashboards.
Slide Decks remain a classic tool for boardroom presentations. Summarize key takeaways, use simple visuals, and focus on the business impact of metrics. A clear, concise deck ensures your message stays sharp and engaging.
Constructing an optimal engineering dashboard comprises the systematic identification and strategic prioritization of critical performance indicators that accurately reflect your development organization's operational objectives and technical challenges.
Engineering leadership should leverage fundamental metrics such as code quality assessments, deployment frequency analytics, lead time measurements, pull request velocity indicators, code coverage analysis, and failure rate monitoring to establish a comprehensive overview of engineering performance dynamics.
The dashboard architecture should facilitate data presentation through intuitive, streamlined interfaces that enable development teams to systematically track progress trajectories, analyze emerging trends, and implement real-time responsive measures to operational issues.
Tailored customization represents a fundamental requirement—diverse development teams and organizational roles necessitate focused attention on distinct aspects of engineering workflows and deliverables. By facilitating user-driven dashboard configuration capabilities that align with specific operational requirements, organizations ensure that stakeholders can effectively monitor metrics most relevant to their designated responsibilities and performance objectives.
High-performing dashboards also streamline continuous improvement methodologies by systematically highlighting optimization opportunities while celebrating measurable progress achievements. Through the development of dashboards that seamlessly integrate flexibility with analytical depth, engineering organizations can cultivate data-driven decision-making cultures that facilitate sustained operational excellence and unprecedented team performance outcomes.
With your dashboard in place, the next step is to implement engineering metrics effectively across your organization.
Successfully leveraging engineering metrics constitutes a paramount foundation for monitoring, optimizing, and demonstrating comprehensive engineering performance across development lifecycles. The following systematic methodology ensures your engineering teams extract maximum value from critical performance indicators:
Implementing engineering metrics through this comprehensive methodology empowers development teams to drive enhanced productivity, improve code quality standards, reduce project resource expenditure, and achieve superior business outcomes through sophisticated data-driven decision-making processes.
Once your metrics are implemented, it’s crucial to maintain and update your dashboard for ongoing relevance and effectiveness.
To maintain optimal engineering dashboard effectiveness and operational relevance, comprehensive ongoing maintenance protocols and systematic update cycles comprise essential development practices.
Engineering teams should systematically analyze and evaluate their key engineering metrics frameworks, implementing new performance indicators as development methodologies evolve and deprecating those that no longer facilitate value-driven insights.
As technological infrastructures, development tools, and organizational priorities undergo transformation, the dashboard architecture should be dynamically reconfigured to reflect these operational changes, ensuring it continues to streamline data-driven decision-making processes and facilitate continuous improvement methodologies.
Establishing robust tracking protocols and systematic issue resolution workflows—such as addressing unexpected infrastructure downtime or computational resource bottlenecks—facilitates rapid team response capabilities and maintains optimal performance benchmarks. Leveraging milestone achievements and progress visualization through dashboard interfaces can significantly enhance team morale and reinforce organizational excellence culture.
Maintaining alignment with emerging industry methodologies, such as the comprehensive adoption of DORA metrics and other critical engineering performance indicators, ensures that your dashboard architecture remains a powerful optimization tool for resource allocation, facilitating business outcome acceleration, and supporting the sustained operational success of your engineering development teams.
With your dashboard maintained and up to date, let’s review best practices for presenting engineering metrics to the board.
More than data, engineering metrics for the board is about delivering a narrative that connects engineering performance to business goals.
Start by offering a brief overview of key metrics like DORA metrics. Explain how these metrics—deployment frequency, MTTR, etc.—drive business outcomes such as faster product delivery or increased customer satisfaction. Always include trends and real-world examples. For example, show how improving cycle time has accelerated a recent product launch.
Tie metrics directly to budgetary impact. For example, show how allocating additional funds for DevOps could reduce MTTR by 20%, which could lead to faster recoveries and an estimated Y% revenue boost. You must include context and recommendations so the board understands both the problem and the solution.
Data alone isn’t enough. Share actionable takeaways. For example: “To reduce MTTR by 20%, we recommend investing in observability tools and expanding on-call rotations.” Use concise slides with 5-7 metrics max, supported by simple and consistent visualizations.
Position engineering as a business enabler. You should show its role in driving innovation, increasing market share, and maintaining competitive advantage. For example, connect your team’s efforts in improving system uptime to better customer retention.
Understand your board member’s technical understanding and priorities. Begin with business impact, then dive into the technical details. Use clear charts (e.g., trend lines, bar graphs) and executive summaries to convey your message. Tell stories behind the numbers to make them relatable.
By following these best practices, you can ensure your board presentations are impactful and aligned with business strategy.
How does tracking and analyzing engineering metrics transform development workflows? By implementing comprehensive metric analysis frameworks, engineering teams and organizations unlock a sophisticated array of strategic advantages that fundamentally reshape their operational capabilities. Let's explore how focusing on key performance indicators enables teams to achieve unprecedented levels of efficiency and organizational success.
How does this comprehensive approach to engineering metrics impact organizational success? By leveraging sophisticated engineering metrics frameworks and analytics capabilities, teams not only enhance their operational performance and developer experience significantly but also contribute substantially to the overall success, scalability, and sustained growth of the organization through data-driven excellence and continuous optimization practices.
Engineering metrics are more than numbers—they’re a bridge between technical performance and business outcomes. Focus on metrics that resonate with the board and align them with strategic goals.
When done right, your metrics can show how engineering is at the core of value and growth.
.png)
In the second session of the 'Unlocking Engineering Productivity' webinar by Typo, host Kovid Batra engages engineering leaders Cesar Rodriguez and Ariel Pérez in a conversation about building high-performing development teams.
Cesar, VP of Engineering at StackGen, shares insights on ingraining curiosity and the significance of documentation and testing. Ariel, Head of Product and Technology at Tinybird, emphasizes the importance of clear communication, collaboration, and the role of AI in enhancing productivity. The panel discusses overcoming common productivity misconceptions, addressing burnout, and implementing effective metrics to drive team performance. Through practical examples and personal anecdotes, the session offers valuable strategies for fostering a productive engineering culture.
Kovid Batra: Hi everyone, welcome to the second webinar session of Unlocking Engineering Productivity by Typo. I’m your host, Kovid, excited to bring you all new webinar series, bringing passionate engineering leaders here to build impactful dev teams and unlocking success. For today’s panel, we have two special guests. Uh, one of them is our Typo champion customer. Uh, he’s VP of Engineering at StackGen. Welcome to the show, Cesar.
Cesar Rodriguez: Hey, Kovid. Thanks for having me.
Kovid Batra: And then we have Ariel, who is a longtime friend and the Head of Product and Technology at Tinybird. Welcome. Welcome to the show, Ariel.
Ariel Pérez: Hey, Kovid. Thank you for having me again. It’s great chatting with you one more time.
Kovid Batra: Same here. Pleasure. Alright, um, so, Cesar has been with us, uh, for almost more than a year now. And he’s a guy who’s passionate about spending quality time with kids, and he’s, uh, into cooking, barbecue, all that we know about him. But, uh, Cesar, there’s anything else that you would like to tell us about yourself so that, uh, the audience knows you a little more, something from your childhood, something from your teenage? This is kind of a ritual of our show.
Cesar Rodriguez: Yeah. So, uh, let me think about this. So one of, one of the things. So something from my childhood. So I had, um, I had the blessing of having my great grandmother alive when I was a kid. And, um, she always gave me all sorts of kinds of food to try. And something she always said to me is, “Hey, don’t say no to me when I’m offering you food.” And that stayed in my brain till.. Now that I’m a grown up, I’m always trying new things. If there’s an opportunity to try something new, I’m always, always want to try it out and see how it, how it is.
Kovid Batra: That’s, that’s really, really interesting. I think, Ariel, , uh, I’m sure you, you also have some something similar from your childhood or teenage which you would like to share that defines who you are today.
Ariel Pérez: Yeah, definitely. Um, you know, thankfully I was, um, I was all, you know, reminded me Cesar. I was also, uh, very lucky to have a great grandmother and a great grandfather, alive, alive and got to interact with them quite a bit. So, you know, I think we know very amazing experiences, remembering, speaking to them. Uh, so anyway, it was great that you mentioned that. Uh, but in terms of what I think about for me, the, the things that from my childhood that I think really, uh, impacted me and helped me think about the person I am today is, um, it was very important for my father who, uh, owned a small business in Washington Heights in New York City, uh, to very early on, um, give us the idea and then I know that in the sense that you’ve got to work, you’ve got to earn things, right? You’ve got to work for things and money just doesn’t suddenly appear. So at least, you know, a key thing there was that, you know, from the time I was 10 years old, I was working with my father on weekends. Um, and you know, obviously, you know, it’s been a few hours working and doing stuff and then like doing other things. But eventually, as I got older and older through my teenage years, I spent a lot more time working there and actually running my father’s business, which is great as a teenager. Um, so when you think about, you know, what that taught me for life. Obviously, there’s the power of like, look, you’ve got to work for things, like nothing’s given to you. But there’s also the value, you know, I learned very early on. Entrepreneurship, you know, how entrepreneurship is hard, why people go follow and go into entrepreneurship. It taught me skills around actual management, managing people, managing accounting, bookkeeping. But the most important thing that it taught me is dealing with people and working with people. It was a retail business, right? So I had to deal with customers day in and day out. So it was a very important piece of understanding customers needs, customers wants, customers problems, and how can I, in my position where I am in my business, serve them and help them and help them achieve their goals. So it was a very key thing, very important skill to learn all before I even went to college.
Kovid Batra: That’s really interesting. I think one, Cesar, uh, has learned some level of curiosity, has ingrained curiosity to try new things. And from your childhood, you got that feeling of building a business, serving customers; that is ingrained in you guys. So I think really, really interesting traits that you have got from your childhood. Uh, great, guys. Thank you so much for this quick sweet intro. Uh, so coming to today’s main section which is about talking, uh, about unlocking engineering productivity. And today’s, uh, specifically today’s theme is around building that data-driven mindset around unlocking this engineering productivity. So before we move on to, uh, and deep dive into experiences that you have had in your leadership journey. First of all, I would like to ask, uh, you guys, when we talk about engineering productivity or developer productivity, what exactly comes to your mind? Like, like, let’s start with a very basic, the fundamental thing. I think Ariel, would you like to take it first?
Ariel Pérez: Absolutely. Um, the first thing that comes to mind is unfortunate. It’s the negative connotation around developer productivity. And that’s primarily because for so long organizations have trying to figure out how do I measure the productivity of these software developers, software engineers, who are one of my most expensive resources, and I hate the word ‘resource’, we’re talking about people, because I need to justify my spend on them. And you know what, they, I don’t know what they do. I don’t understand what they do. And I got to figure out a way to measure them cause I measure everyone else. If you think about the history of doing this, like for a while, we were trying to measure lines of code, right? We know we don’t do that. We’re trying to open, you know, we’re trying to, you know, measure commits. No, we know we don’t do that either. So I think for me, unfortunately, in many ways, the term ‘developer productivity’ brings so many negative associations because of how wrong we’ve gotten it for so long. However, you know, I am not the, I am always the eternal optimist. And I also understand why businesses have been trying to measure this, right? All these things are inputs into the business and you build a business to, you know, deliver value and you want to understand how to optimize those inputs and you know, people and a particular skill set of people, you want to figure out how to best understand, retain the best people, manage the best people and get the most value out of those people. The thing is, we’ve gotten it wrong so many times trying to figure it out, I think, and you know, some of my peers who discuss with me regularly might, you know, bash me for this. I think DORA was one good step in that direction, even though there’s many things that it’s missing. I think it leans very heavily on efficiency, but I’ll stop, you know, I’ll leave that as is. But I believe in the people that are behind it and the people, the research and how they backed it. I think a next iteration SPACE and trying to go to SPACE, moved this closer and tried to figure it out, you know, there’s a lot of qualitative aspects that we need to care about and think about. Um, then McKinsey came and destroyed everything, uh, unfortunately with their one metric to rule it all. And it was, it’s been all hell broke loose. Um, but there’s a realization and a piece that look, we, as, as a, as a, as an industry, as a role, as a type of work that we do, we need to figure out how we define this so that we can, you know, not necessarily justify our existence, but think about, how do we add value to each business? How do we define and figure out a better way to continually measure? How do we add value to a business? So we can optimize for that and continually show that, hey, you actually can’t live without us and we’re actually the most important part of your business. Not to demean any other roles, right? But as software engineers in a world where software is eating the world and it has eaten the world, we are the most important people in the, in there. We’re gonna figure out how do we actually define that value that we deliver. So it’s a problem that we have to tackle. I don’t think we’re there yet. You know, at some point, I think, you know, in this conversation, we’ll talk about the latest, the latest iteration of this, which is the core 4, um, which is, you know, things being talked about now. I think there’s many positive aspects. I still think it’s missing pieces. I think we’re getting closer. But, uh, and it’s a problem we need to solve just not as a hammer or as, as a cudgel to push and drive individual developers to do more and, and do more activity. That’s the key piece that I think I will never accept as a, as a leader thinking about developer productivity.
Kovid Batra: Great, I think that that’s really a good overview of how things are when we talk about productivity. Cesar, do you have a take on that? Uh, what comes to your mind when we talk about engineering and developer productivity?
Cesar Rodriguez: I think, I think what Ariel mentioned resonates a lot with me because, um, I remember when we were first starting in the industry, everything was seen narrowly as how many lines of code can a developer write, how many tickets can they close. But true productivity is about enabling engineers to solve meaningful problems efficiently and ensuring that those problems have business impact. So, so from my perspective, and I like the way that you wrote the title for this talk, like developer (slash) engineering. So, so for me, developer, when I think about developer productivity, that that brings to my mind more like, how are your, what do your individual metrics look like? How efficiently can you write code? How can you resolve issues? How can you contribute to the product lifecycle? And then when you think about engineering metrics, that’s more of a broader view. It’s more about how is your team collaborating together? What are your processes for delivering? How is your system being resilient? Um, and how do you deliver, um, outcomes that are impactful to the business itself? So I think, I think I agree with Ariel. Everything has to be measured in what is the impact that you’re going to have for the business because if you can’t tie that together, then, then, well, I think what you’re measuring is, it’s completely wrong.
Kovid Batra: Yeah, totally. I, I, even I agree to that. And in fact, uh, when we, when we talk about engineering and developer productivity, both, I think engineering productivity encompasses everything. We never say it’s bad to look at individual productivity or developer productivity, but the way we need to look at it is as a wholesome thing and tie it with the impact, not just, uh, measuring specific lines of code or maybe metrics like that. Till that time, it definitely makes sense and it definitely helps measure the real impact, uh, real improvement areas, find out real improvement areas from those KPIs and those metrics that we are looking at. So I think, uh, very well said both of you. Uh, before I jump on to the next piece, uh, one thing that, uh, I’m sure about that you guys have worked with high-performing engineering teams, right? And Ariel, you had a view, like what people really think about it. And I really want to understand the best teams that you have worked with. What’s their perception of, uh, productivity and how they look at, uh, this data-driven approach, uh, while making decisions in the team, looking at productivity or prioritizing anything that comes their way, which, which would need improvement or how is it going? How, how exactly these, uh, high-performing teams operate, any, any experiences that you would like to share?
Ariel Pérez: Uh, Cesar, do you want to start?
Cesar Rodriguez: Sure. Um, so from my perspective, the first thing that I’ve observed on high-performing teams is that is there is great alignment with the individual goals to what the business is trying to achieve. Um, the interests align very well. So people are highly motivated. They’re having fun when they’re working and even on their outside hours, they’re just thinking about how are you going to solve the problem that they’re, they’re working on and, and having fun while doing it. So that’s, that’s one of the first things that I observed. The other thing is that, um, in terms of how do we use data to inform the decisions, um, high-performing teams, they always use, consistently use data to refine processes. Um, they identify blockers early and then they use that to prioritize effectively. So, so I think all ties back to the culture of the team itself. Um, so with high-performing teams, you have a culture that is open, that people are able to speak about issues, even from the lowest level engineer to the highest, most junior engineers, the most highest senior engineer, everyone is treated equally. And when people have that environment, still, where they can share their struggles, their issues and quickly collaborate to solve them, that, that for me is the biggest thing to be, to be high-performing as a team.
Kovid Batra: Makes sense.
Ariel Pérez: Awesome. Um, and, you know, to add to that, uh, you know, I 1000% agree with the things you just mentioned that, you know, a few things came to mind of that, like, you know, like the words that come to mind to describe some of the things that you just said. Uh, like one of them, for example, you know, you think about the, you know, what, what is a, what is special or what do you see in a high-performing team? One key piece is there’s a massive amount of intrinsic motivation going back to like Daniel Pink, right? Those teams feel autonomy. They get to drive decisions. They get to make decisions. They get to, in many ways own their destiny. Mastery is a critical thing. These folks are given the opportunity to improve their craft, become better and better engineers while they’re doing it. It’s not a fight between ‘should I fix this thing’ versus ‘should I build this feature’ since they have autonomy. And the, you know, guide their own and drive their own agenda and, and, and move themselves forward. They also know when to decide, I need to spend more time on building this skill together as a team or not, or we’re going to build this feature; they know how to find that balance between the two. They’re constantly becoming better craftsmen, better engineers, better developers across every dimension and better people who understand customer problems. That’s a critical piece. We often miss in an engineering team. So becoming better at how they are doing what they do. And purpose. They’re aligned with the mission of the company. They understand why we do what we do. They understand what problem we’re solving. They, they understand, um, what we sell, how we sell it, whose problems to solve, how we deliver value and they’re bought in. So all those key things you see in high-performing teams are the major things that make them high-performing.
The other thing sticking more to like data and hardcore data numbers. These are folks that generally are continually improving. They think about what’s not working, what’s working, what should we do more of, what should we do less of, you know, when I, I forgot who said this, but they know how to turn up the good. So whether you run retros, whether you just have a conversation every day, or you just chat about, hey, what was good today, what sucked; you know, they have continuous conversations about what’s working, what’s not working, and they continually refine and adjust. So that’s a key critical thing that I see in high-performing teams. And if I want to like, you know, um, uh, button it up and finish it at the end is high-performing teams collaborate. They don’t cooperate, they collaborate. And that’s a key thing we often miss, which is and the distinction between the two. They work together on their problems, which one of those key things that allows them to like each other, work well with each other, want to go and hang out and play games after work together because they depend on each other. These people are shoulder to shoulder every day, and they work on problems together. That helps them not only know that they can trust each other, they can trust each other, they can depend on each other, but they learn from each other day in and day out. And that’s part of what makes it a fun team to work on because they’re constantly challenging each other, pushing each other because of that collaboration. And to me, collaboration means, you know, two people, three people working on the same problem at the same time, synchronously. It’s not three people separating a problem and going off on their own and then coming back together. You know, basically team-based collaboration, working together in real time versus individual work and pulling it together; that’s another key aspect that I’ve often seen in high-performing teams. Not saying that the other ways, I have not seen them and cannot be in a high-performing team, but more likely and more often than not, I see this in high-performing teams.
Kovid Batra: Perfect. Perfect. Great, guys. And in your journeys, um, there have been, there must have been a lot of experiences, but any counterintuitive things that you have realized later on, maybe after making some mistakes or listening to other people doing something else, are there any things which, which are counterintuitive that you learned over the time about, um, improving your team’s productivity?
Ariel Pérez: Um, I’ll take this one first. Uh, I don’t know if this is counterintuitive, but it’s something you learn as you become a leader. You can’t tell people what to do, especially if they’re high-performing, you’re improving them, even if you know better, you can’t tell them what to do. So unfortunately, you cannot lead by edict. You can do that for a short period of time and get away with it for a short period of time. You know, there’s wartime versus peacetime. People talk about that. But in reality, in many ways, it needs to come from them. It needs to be intrinsic. They’re going to have to be the ones that want to improve in that world, you know, what do you do as a leader? And, you know, I’ve had every time I’ve told them, do this, go do this, and they hated me for it. Even if I was right at the end, then even if it took a while and then they eventually saw it, there was a lot of turmoil, a lot of fights, a lot of issues, and some attrition because of it. Um, even though eventually, like, yes, you were right, it was a bit more painful way, and it was, you know, me and the purpose for the desire, you know, let me go faster. We got to get this done. Um, it needs to come from the team. So I think I definitely learned that it might seem counterintuitive. You’re the boss. You get to tell people to do. It’s like, no, actually, no, that’s not how it works, right? You have to inspire them, guide them, drive them, give them the tools, give them the training, give them the education, give them the desire and need and want for how to get there, have them very involved in what should we do, how do we improve, and you can throw in things, but it needs to come from them. If there were anything else I’d throw into that, it was counterintuitive, as I think about improving engineering productivity was, to me, this idea of that off, you know, as we think about from an accounting perspective, there’s just no way in hell that two engineers working on one problem is better than one. There’s no way that’s more productive. You know, they’re going to get half the work done. That’s, that’s a counterintuitive notion. If you think about, if you think about it, engineers as just mere inputs and resources. But in reality, they’re people, and that software development is a team sport. As a matter of fact, if they work together in real time, two engineers at the same time, or god forbid, three, four, and five, if you’re ensemble programming, you actually find that you get more done. You get more done because things, like they need to get reworked less. Things are of higher quality. The team learns more, learns faster. So at the end of the day, while it might feel slow, slow is smooth and smooth is fast. And they get just get more over time. They get more throughput and more quality and get to deliver more things because they’re spending less time going back and fixing and reworking what they were doing. And the work always continues because no one person slows it down. So that’s the other counterintuitive thing I learned in terms of improving and increasing productivity. It’s like, you cannot look at just productivity, you need to look at productivity, efficiency, and effectiveness if you really want to move forward.
Kovid Batra: Makes sense. I think, uh, in the last few years, uh, being in this industry, I have also developed a liking towards pair programming, and that’s one of the things that align with, align with what you have just said. So I, I’m in for that. Yeah. Uh, great. Cesar, do you have, uh, any, any learnings which were counterintuitive or interesting that you would like to share?
Cesar Rodriguez: Oh, and this goes back to the developer versus engineering, uh, conversation, uh, and question. So productivity and then something that’s counterintuitive is that it doesn’t mean that you’re going to be busy. It doesn’t mean that you’re just going to write your code and finish tickets. It means that, and this is, if there are any developers here listening to this, they’re probably going to hate me. Um, you’re going to take your time to plan. You’re going to take your time to reflect and document and test. Um, and we, like, we’ve seen this even at StackGen last quarter, we focused our, our, our efforts on improving our automated tests. Um, in the beginning, we’re just trying to meet customer demands. We, unfortunately, they didn’t spend much time testing, but last quarter we made a concerted effort, hey, let’s test all of our happy paths, let’s have automated tests for all of that. Um, let’s make sure that we can build everything in our pipelines as best as possible. And our, um, deployment frequency metrics skyrocketed. Um, so those are some of the, uh, some of the counterintuitive things, um, maybe doing the boring stuff, it’s gonna be boring, but it’s gonna speed you up.
Ariel Pérez: Yeah, and I think, you know, if I can add one more thing on that, right, that’s critical that many people forget, you know, not only engineers, as we’re working on things and engineering leadership, but also your business peers; we forget that the cost of software, the initial piece of building it is just a tiny fraction of the cost. It’s that lifetime of iterating, maintaining it, managing, building upon it; that’s where all the cost is. So unfortunately, we often cut the things when we’re trying to cut corners that make that ongoing cost cheaper and you’re, you’re right, at, you know, investing in that testing upfront might seem painful, but it helps you maintain that actual, you know, uh, that reasonable burn for every new feature will cost a reasonable amount, cause if you don’t invest in that, every new feature is more expensive. So you’re actually a whole lot less productive over time if you don’t invest on these things at the beginning.
Cesar Rodriguez: And it, and it affects everything else. If you’re trying to onboard somebody new, it’ll take more time because you didn’t document, you didn’t test. Um, so your cost of onboarding new people is going to be more expensive. Your cost of adding new people, uh, new features is going to be more expensive. So yeah, a hundred percent.
Kovid Batra: Totally. I think, Cesar, documentation and testing, uh, people hate it, but that’s the truth for sure. Great, guys. I think, uh, there is more to learn on the journey and there are a lot more questions that I have and I’m sure audience would also have a lot of questions. So I would request the audience to put in their questions in the comment section right now, because at the end when we are having a Q&A, we’ll have all the questions sorted and we can take all of them one by one. Okay. Um, as I said, like a lot of learning and unlearning is going to happen, but let’s talk about some of, uh, your specific experiences, uh, learn some practical tips from there. So coming to you, Ariel. Uh, you have recently moved into this leadership role at Tinybird. Congratulations, first of all.
Ariel Pérez: Thank you.
Kovid Batra: And, uh, I’m sure this comes with a lot of responsibility when you enter into a new environment. It’s not just a new thing that you’re going to work upon, it’s a whole new set of people. I’m sure you have seen that in your career multiple times. But every time you step in and you’re a new person there, and of course, uh, you’re going as a leader, uh, it could be overwhelming, right? Uh, how do you manage that situation? How do you start off? How do you pull off so that you actually are able to lead, uh, and, and drive that impact which you really want?
Ariel Pérez: Got it. Um, so, uh, the first part is one of, this may sound like fluff, but it really helps, um, in many ways when you have a really big challenge ahead, you know, you have to avoid, you have to figure out how to avoid letting imposter syndrome freeze you. And even if you’ve had a career of success, you know, in many ways, imposter syndrome still creeps up, right? So how do I fight, how do I fight that? It’s one of those things like stand in front of the mirror and really deep breaths and talk about I got this job for a reason, right? I, you know, I, I, they, they’re trusting me for a reason. I got here. I earned this. Here’s my track record. I worked this. Like I deserve to be here. I’m supposed to be here. I think that’s a very critical piece for any new leader, especially if you’re a new leader in a new place, because you have so much novelty left and right. You have to prove yourself and that’s very daunting. So the first piece is you need to figure out how to get yourself out of your own head. And push yourself along and coach yourself, like I’m supposed to be here, right? Once you get that piece, you know down pat, it really helps in many ways helps change your own mindset your own framing. When you’re walking into conversations walking into rooms, there’s a big piece of how, how that confidence shines through. That confidence helps you speak and get your ideas and thoughts out without tripping all over yourself. That confidence helps you not worry about potentially ruffling some feathers and having hard conversations. When you’re in leadership, you have to have hard conversations. It’s really important to have that confidence, obviously without forgetting it, without saying, let me run over everybody, cause that’s not what it means, but it just means you got to get over the piece that freezes you and stops you. So that’s the first piece I think. The second piece is, especially when moving higher and higher into positions of leadership; it’s listening. Listening is the biggest thing you do. You might have a million ideas, hold them back, please hold them back. And that’s really hard for me. It’s so hard cause I’m like, “I see that I can fix that. I can fix that too. I’ve seen that before I can fix it too.” But, you know, you earn more respect by listening and observing. And actually you might learn a few things or two. I’m like, “Oh, that thing I wanted to fix, there’s a reason why it’s the way it is.” Because every place is different. Every place has a different history, a different context, a different culture, and all those things come into play as to why certain decisions were made that might seem contrary to what you would have done. And it helps you understand that context. That context is critical, not only to then figure out the appropriate solution to the problem, but also that time while you’re learning and listening and talking to people, you’re building relationships with people, you’re connecting to people, you’re understanding, you’re understanding the players, understanding who does well, who doesn’t do well, you’re understanding where all the bodies are buried, you’re understanding the strategy, you’re getting a big picture of all the things so that then when it comes time to say now time to implement change, you have a really good setup of who are the people that are gonna help me make the change, who are the people that are going to be challenging, how do I draw a plan to do change management, which is a big important thing. Change management is huge. It’s 90% people. So you need to understand the people and then understand, it also gives you enough time to understand the business strategy, the context, the big problem where you’re going to kind of be more effective at. Here’s why I got hired. Now I’m going to implement the things to help me execute on what I believe is the right strategy based on learning and listening and keeping my mouth shut for the time, right? Now, traditionally, you’ll hear this thing about 90 days. I think the 90 days is overly generous if you’re in a really big team, I think it leans and skews toward big places, slower moving places, um, and, and places that move. That’s it. Bigger places, slower places. When you join a startup environment, we join a smaller company. You need to be able to move faster. You don’t have 90 days to make decisions. You don’t have 90 days. You might have 30 days, right? You want to push that back as far as you can to get an appropriate context. But there’s a bias for action, reasonably so because you’re not guaranteed that the startup is going to be there tomorrow. So you don’t have 90 days, but you definitely don’t want to do it in two weeks and probably not start doing things in a month.
Kovid Batra: Makes sense. Makes sense. So, uh, a follow-up question on that. Uh, when you get into this position, if you are in a startup, let’s say you get 30 to 45 days, but then because of your bias towards action, you pick up initiatives that you would want to lead and create that impact. In your journey at Tinybird, have you picked up something, anything interesting, maybe related to AI or maybe working with different teams that you think would work on your existing code base to revamp it, anything that you have picked up and why?
Ariel Pérez: Yeah, a bunch of stuff. Um, I think when I first joined Tinybird, my first role was field CTO, which is a role that takes the, the, the responsibilities of the CTO and the external facing aspects of them. So I was focused primarily on the market, on customers, on prospects. And as part of that one, you know, one of the first initiatives I had was how do we, uh, operate within the, you know, sales engineering team, who was also reporting to me, and make that much more effective, much more efficient. So a few of the things that we were thinking of there were, um, AI-based solutions and GenAI-based solutions to help us find the information we need earlier, sooner, faster. So that was more like an optimization and efficiency thing in terms of helping us get the answers and clarify and understand and gather requirements from customers and very quickly figure out this is the right demo for you, these are the right features and capabilities for you, here’s what we can do, here’s what we can’t do, to get really effective and efficient at that. When moving into a product role though, and product and engineering role, in terms of the, the latest initiatives that I’ve picked up, like there, there, there, there are two big things in terms of themes. One of them is that Tinybird must always work, which sounds like, yeah, well, duh, obviously it must always work, but there’s a key piece underpinning that. Number one, obviously the, you know, stability and reliability are huge and required for trust from customers wanting to use you as a dev tool. You need to be able to depend on it, but there’s another piece is anything I must do and try to do on the platform, it must fail in a way that I understand and expect so that then I can self service it and fix it. So that idea of Tinybird always works that I’ve been picking up and working on projects is transparency, observability, and the ability for customers to self-service and resolve issues simply by saying, “I need more resources.” And that’s a, you know, it’s a very challenging thing because we’ve got to remove all the errors that have nothing to do with that, all the instability and all the reliability problems so that those are granted. And then remaining should only be issues that, hey, customer, you can solve this by managing your limits. Hey, customer, you can solve this by increasing the cores you’re using. You can solve this by adding more memory and that should be the only thing that remains. So working on a bunch of stuff there on predicting whether something will fail or not, predicting whether something is going to run out of resources or not, very quickly identifying if you’re running out of resources so there’s almost like an SRE monitoring observability aspect to this, but turning that back into a product solution. That’s one side of it. And then the other big pieces will be called a developer’s experience. And that’s something that my, you know, my, my, my peer is working internally on and leading is a lot more about how developers develop today. Developers develop today, well, they always develop locally. They prefer not depending on IO on a network, but developer, every developer, whether they tell you yes or no, is using an AI assistant; every developer, right? Or 99% of developers. So the idea is, how do we weave that into the experience without making it be, you know, a gimmick? How do we weave an AI Copilot into your development experience, your local development experience, your remote development experience, your UI development experience so that you have this expert at your disposal to help you accelerate your development, accelerate your ability to find problems before you ship? And even when you ship, help you find those problems there so you can accelerate those cycles, so you can shorten those lead time, so you can get to productivity and a productive solution faster with less errors and less issues. So that’s one major piece we’re working on there on the embedding AI; and not just AI and LLMs and GenAI, all you think about, even traditional. I say traditional like ML models on understanding and predicting whether something’s going to go wrong. So we’re working on a lot of that kind of stuff to really accelerate the developer, uh, accelerate developer productivity and engineering team productivity, get you to ship some value faster.
Kovid Batra: Makes sense. And I think, uh, when you’re doing this, is there any kind of framework, tooling or processes that you’re using to measure this impact, uh, over, over the journey?
Ariel Pérez: Yeah, um, for this kind of stuff, I lean a lot more toward the outcomes side of the equation, you know, this whole question of outputs versus outcomes. I do agree. John Cutler, very recently, I loved listening to John Cutler. He very recently published something like, look, we can’t just look at outcomes, because unfortunately, outcomes are lagging. We need some leading indicators and we need to look at not only outcomes, but also outputs. We need to look at what goes into here. We need to look at activity, but it can’t be the only thing we’ll look at. So the things I look at is number one, um, very recently I started working with my team to try to create our North Star metric. What is our North Star metric? How do we know that what we’re doing and what we’re solving for is delivering value for our customers? And is that linked to our strategy and our vision? And do we see a link to eventual revenue, right? So all those things, trying to figure out and come up with that, working with my teams, working, looking at our customers, understanding our data, we’ve come up with a North Star metric. We said, great, everything we do should move that number. If that moving, if that number is moving up into the right, we’re doing the right things. Now, looking at that alone is not enough, because especially as engineering teams, I got to work back and say, how efficient are we at trying to figure that out? So there’s, you know, a few of the things that I look at, I obviously look at the DORA metrics. I do look at them because they help us try to figure out sources of issues, right? What’s our lead time? What’s our cycle time? What’s our deployment frequency? What’s our, you know, what, you know, what, what’s our, uh, you know, change failure rate? What’s our mean time to recover? Those are very critical to understand. Are we running as a tip-top shop in terms of engineering? How good are we at shipping the next thing? Because it’s not just shipping things faster; it’s if there’s a problem, I need to fix it really fast. If I want to deliver value and learn, and this is the second piece is critical that many companies fail is, I need to put it out in the hands of customers sooner. That’s the efficiency piece. That’s the outputs. That’s the, you know, are we getting really good at putting it in front of customers, but the second piece that we must need independent of the North Star metric is ‘and what happened’, right? Did it actually improve things? Did it, did it make things worse. So it’s optimizing for that learning loop on what our customers are doing. Do we have.. I’m tracking behavioral analytics pieces where the friction points were funnels. Where are they dropping off? Where are they circling the wheels, right? We’re looking at heat maps. We’re looking at videos and screen shares of like, what did the customer do? Why aren’t they doing what they thought we thought they were going to do? So then now when we learn this, go back to that really awesome DORA numbers, ship again, and let’s see, let’s see, let’s fix on that. So, to me, it’s a comprehensive view on, are we getting really good at shipping? And are we getting really good at shipping the right thing? Mixing both those things driven by the North star metric. Overall, all the stuff we’re doing is the North star moving up into the right.
Kovid Batra: Makes sense. Great. Thanks, Ariel. Uh, this was really, really insightful. Like, from the point you enter as a leader, build that listening capability, have that confidence, uh, driving the initiatives which are right and impactful, and then looking at metrics to ensure that you’re moving in the right direction towards that North Star. I think to sum up, it was, it was really nice and interesting. Cesar, I think coming to your experience, uh, you have also had a good stint at, uh, at StackGen and, uh, you were mentioning about, uh, taking up this transition successfully, uh, which was multi-cloud infrastructure that expanded your engineering team. Uh, right? And I would want to like deep dive into that experience. Uh, you specifically mentioned that, uh, that, uh, transition was really successful, and at that time, you were able to keep the focus, keep the productivity in place. How things went for you, let’s deep dive into that experience of yours.
Cesar Rodriguez: Yeah. So, so from my perspective, the goals that you are going to have for your team are going to be specific to where the business is at, at that point in time. So, for example, StackGen, we started in 2023. Initially, we were a very small number of engineers just trying to solve the initial problem, um, which we’re trying to solve with Stackdn, which is infrastructure from code and easily deploying cloud architecture into, into the cloud environment. Um, so we focus on one cloud provider, one specific problem, with a handful of engineers. And once we started learning from customers, what was working, what was not working, um, and we started being pulled into different directions, we quickly learned that we needed to increase engineering capacity to support additional clouds, to deliver additional features faster. Um, our clients were trying to pull us in different directions. So that required, uh, two things. One is, um, hiring and scaling the team quickly. So now we are, at the moment we’re 22 engineers; so hiring and scaling the engineering team quickly and then enabling new team members to be as productive as possible in day zero. Um, and this is where, this is where the boring, the boring actions come into play. Um, uh, so first of all, making sure that you have enough documentation so somebody can get up and running on day one, um, and they can start doing pull requests on day one. Second of all, making sure that you have, um, clear expectations in terms of quality and what is your happy path, and how can you achieve that. And third, um, is making sure everyone knows what is expected from them in terms of the metrics that we’re looking for and, uh, the quality that we’re looking for in their outcomes. And this is something that we use Typo for. So, for example, we have an international team. We have people in India, Portugal, US East Coast, US West Coast. And one of the things that we were getting stuck early on was our pull requests were getting opened, but then it took a really long time for people to review them, merge them, and take action and get them deployed. So, um, we established a metric, and we did this using Typo, where we were measuring, hey, if you have a pull request open more than 12 hours, let’s create an alert, let’s alert somebody, so that somebody can be on top of that. We don’t want to get somebody stuck for more than a working day, waiting for somebody to review the pull request. And, and the other metric that we look at, which is deployment frequency, we see that an uptick of that. Now that people are not getting stuck, we’re able to have more frictionally, frictionless, um, deployments to our SDLC where people are getting less stuck. We’re seeing collaboration between the team members regardless of their time zone improving. So that’s something actionable that we’ve implemented.
Kovid Batra: So I think you’re doing the boring things well and keeping a good visibility on things, how they’re proceeding, really helped you drive this transition smoothly, and you were able to maintain that productivity in the team. That’s really interesting. But touching on the metrics part again, uh, you mentioned that you were using Typo. Uh, there, there are, uh, various toolings to help you, uh, plan, execute, automate, and reflect things when you are, when you are into a position where as a leader, uh, you have multiple stakeholders to manage. So my question to both of you, actually, uh, when we talk about such toolings, uh, that are there in the market, like Typo, how these tools help you exactly, uh, in each of these phases, or if you’re not using such tools, you must be using some level of metrics, uh, to actually, let’s say you’re planning an initiative, how do you look at numbers? If you’re automating something and executing something, how do you look at numbers and how does this whole tooling piece help you in that? Um, yeah.
Cesar Rodriguez: I think, I think for me, the biggest thing before, uh, using a tool like Typo was it was very hard to have a meaningful conversation on how the engineering team was performing, um, without having hard, hard data and raw data to back it up. So, um, the conversation, if you don’t, if you’re not measuring things, it’s more about feelings and more about anecdotal evidence. But when you have actual data that you can observe, then you can make improvements, and you can measure how, how, how that, how things are going well or going bad and take action on it. So, so that’s the biggest, uh, for me, that’s the biggest benefit for, from my perspective. Um, you have, you can have conversations within your team and then with the rest of the organization, um, and present that in a, in a way that makes sense for everyone.
Kovid Batra: Makes sense. I think that’s the execution part where you really take the advantage of the tool. You mentioned with one example that you had set a goal for your team that okay, if the review time is more than 12 hours, you would raise an alert. So, totally makes sense, that helps you in the execution, making it more smooth, giving you more, uh, action-driven, uh, insights so that you can actually make teams move faster. Uh, Ariel, for you, any, any experiences around that? How do you, uh, use metrics for planning, executing, reflecting?
Ariel Pérez: So I think, you know, one of the things I like doing is I like working from the outside in. By that I mean, first, let me look at the things that directly impact customers, that is visible. There’s so much there on, you know, in terms of trust to customers. There’s also someone’s there on like actual eventual impact. So I lay looking, for example, um, the, it may sound negative, but it’s one of those things you want to track very closely and manage and then learn from is, what’s our incident number? Like, how many incidents do we have? You know, how many P0s? How many P1s? That is a very important metric to trust because I will guarantee you this, if you don’t have that number as an engineering leader, your CEO is going to try to figure out, hey, why are we having so many problems? Why are so many customers angry calling me? So that’s a number you’re going to want to have a very strong pulse on: understand incidents. And then obviously, take that number and try to figure out what’s going on, right? There’s so much behind it. But the first part is understand the number and you want that number to go down over time. Um, obviously, like I said, there’s a North star metric. You’re tracking that. Um, I look at also, which, you know, I don’t lean heavily on these, but they’re still used a lot and they’re still valuable. Things like NPS and CSAT to help you understand how customers are feeling, how customers are thinking. And it allows me to get often when it’s paired with qualitative feedback, even more so because I want to understand the ‘why’ and I’ll dive more into the qualitative piece, how critical is it and how often we forget that piece when we’re chasing metrics and looking for numbers, especially we’re engineers, we want numbers. We need a story and the story, you can’t get the story just from the numbers. So I love the qualitative aspect. And then the third thing I look at is, um, SCIs or failed customer interactions, trying to find friction in the journeys. What are all the times a customer tries to do something and they fail? And you know, you can define that in so many kinds of ways, but capturing that is one of those things you try to figure out. Find failed customer interactions, find where customers are hitting friction points, and let’s figure out which of those are most important to attack. So these things help guide, at the minimum, what do we need to work on as a team? Right? What are the things we need to start focusing on to deliver and build? Like, how do I get initiatives? Obviously, that stuff alone doesn’t turn into initiatives. So the next thing I like ensuring and I drive to figure out what we work on is with all my leaders. And in our organization, we don’t have separate product managers. You know, engineering leaders are product managers. They have to build those product skills because we have such a technical product that we decided to make that decision, not only for efficiency’s sake and stop having two people in every conversation, but also to build up that skill set of ‘I’m building for engineers, and I need to know my engineering product very well, but now let me enable these folks with the frameworks and methodologies, the ideas and the things that help them make product decisions.’ So, when we look at these numbers, we try to look at what are some frameworks and ways to think about what am I going to build? Which of these is going to impact? How much do we think it’s going to impact it? What level of confidence do I have in that? Does that come from the gut? Does that come from several opinions that customers tell us that, is the data telling us that, are competitors doing it? Have we run an experiment? Did we do some UX research? So the different levels of, uh, confidence in I want to do this thing. Cause this thing’s going to move that number. We believe that number is important. The FCI is it through the roof. I want to attack them. This is going to move it. Okay. How sure are you? He’s going to move it. Now, how are we going to measure that? And indeed moved it. Then I worked, so that’s the outside of the onion. Then I work inward and say, great, how good are we at getting at those things? So, uh, there’s two combinations of measures. I pull measures and data from, from GitLab, from GitHub, I look at the deployments that we have. Thankfully, we run a database. We have an OLAP database, so I can run a bunch of metrics off of all this stuff. We collect all this data from all this telemetry from our services, from our deployments, from our providers for all of the systems we use, and then we have these dashboards we built internally to track aggregates, track metrics and track them in real time, because that’s what Tinybird does. So, we use Tinybird to Tinybird while we Tinybird, which is awesome. So I, we’ve built our own back dashboards and mechanisms to track a lot of these metrics and understand a lot of these things. However, there’s a key piece which I haven’t introduced yet, but I have a lot of conversations with a lot of people on, hey, why did this number move? What’s going on? I want to get to the place that we actually introduce surveys. Funny enough, when you talk about the beginning of DORA, even today, DORA says, surveys are the best way to do this. We try to get hard data, but surveys are the best way to get it. For me, surveys really help, um, forget for a second what the numbers are telling me, how do the engineers feel? Because then I get to figure out why do you feel that way? It allows me to dive in. So that’s why I believe the qualitative subjective piece is so important to then bolster the numbers I’m seeing, either A: explain the numbers, or the other way around, when I see a story, I’m like, do the numbers back up that story? The reality is somewhere in the middle, but I use both, both of those to really help me.
Kovid Batra: Makes sense. Makes sense. Great guys. I think, uh, thank you. Thank you so much for sharing such good insights. I’m sure our audience has some questions for us, uh, so we can break in for a minute and, uh, then start the QnA.
Kovid Batra: All right. I think, uh, we have a lot of questions there, but I’m sure we are going to pick a few of them. Let’s start with the first one. That’s from Vishal. Hi Ariel, how do you, how do I decide which metrics to focus while measuring teams productivity and individual metrics? So I think the question is simple, but please go ahead.
Ariel Pérez: Um, I would start with in terms of, I would measure the core four of DORA at the minimum across the team to help me pinpoint where I need to go. I would start with that to help me pinpoint. In terms of which team productivity metrics or individual productivity metrics, I’d be very wary of trying to measure individual productivity metrics, not because we shouldn’t hold individuals accountable for what they do, not because individuals don’t also need to understand, uh, how we think about performance, how we manage that performance, but for individuals, we have to be very careful, especially in software teams. Since it’s a team sport, there’s no individual that is successful on their own, and there’s no individual that fails on their own. So if I were to think, you know, if I were to measure and try to figure out how to identify how this individual is doing, I would, I would look for at least two things. Number one, actual peer feedback. How, how do their peers think about this person? Can they depend on this person? Is this person there when they need him? Is this person causing a lot of problems? Is this person fixing a lot of problems? But I’d also look at the things, to me, for the culture I want to build, I want to measure how often is this person reviewing other people’s PRs? How often is this person sitting with other people, helping unblock them? How often is this person not coding because they’re going and working with someone else to help unblock them? I actually see that as a positive. Most frameworks will ding that person for inactivity. So I try to find the things that don’t measure activity, but are measuring that they’re doing the right things, which is teamwork. They’re actually being effective at working in a team when it comes to individuals.
Kovid Batra: Great. Thanks, Ariel. Uh, next question. That’s for you, Cesar. How easy or hard is the adoption and implementation of SEI tools like Typo? Okay, so you can share your experience, how it worked out for you.
Cesar Rodriguez: So, so two things. So, so when I was evaluating tools, um, I prefer to work with startups like Typo because they’re extremely responsive. If you go to a big company, they’re not going to be as responsive and as helpful as a startup is. They change the product to meet your expectations and they work extremely fast. So that’s the first thing. Um, the hard part of it is not about the technology itself. The technology is easy. The hard part is the people aspect of it. So you have to, if you can implement it early, uh, when your company is growing, that’s better because they’ll, when new team members come in, they already know what are the expectations and what to expect. The other thing is, um, you need to communicate effectively to your team members why are you using this tool, and getting their buy-in for measuring. Some people may not like that you’re going to be measuring their commits, their pull requests, their quality, their activity, but if you have a conversation with, with those people to make them understand the ‘why’ and how can you connect their productivity to the business outcomes, I think that goes far along. And then once you’re, once you’re in place, just listening to your engineers feedback about the tool, working with the vendor to, to modify anything to fit your company’s need, um, a lot of these tools are very cookie cutter in their approach, um, and have a set of, set of capabilities, but teams are made of people and people have different needs. So, so make sure that you capture that feedback, give it to your vendor and work with them to make the tool work for your specific individual teams.
Kovid Batra: Makes sense. Next question. That’s from, uh, Mohd Helmy Ibrahim, uh, Hi Ariel, how to make my senior management and junior implement project management software in their work, tasking to be live update tracking status update?
Ariel Pérez: Um, I, that one, I’m of two minds cause only because I see a lot of organizations who can get really far without actual sophisticated project management tooling. Like they just use, you know, Linear and that’s it. That’s all enough. Other places can’t live without, you know, a super massive, complex Jira solution with all kinds of things and all kinds of bells and whistles and reports. Um, I think the key piece here that’s important and actually it was funny enough. I was literally just having this conversation with my leadership team, my engineering leadership team. It’s this, you know, when it comes to the folks involved is do you want to spend all day asking, answering questions about where is this thing, how is this thing doing, is this thing going to finish, when is it going to finish, or do you want to just get on with your work, right? If you want to just get on with your work and actually do the work rather than talk about the work to other people who don’t understand it, if you want to find out when you want to do it, you need some level of information radiator. Information reader, radiators are critical at the minimum so that other folks can get on the same page, but also if someone comes to you and says, Hey, where is this thing? Look at the information radiator. It’s right there. You, where’s the status on the, it’s on the information radiator. When’s this going to be done? Look at the information radiator, right? That’s the key piece for me is if you don’t want to constantly answer that question, then you will, because people care about the things you’re working on. They want to know when they can sell this thing or they want to know so they can manage their dependencies. You need to have some level, some minimum level of investment of marking status, marking when you think it’s going to be done and marking how it’s going. And that’s a regular piece. Write it down. It’s so much easier to write it down than to answer that question over and over again. And if you write it down in a place that other people can see it and visualize it, even better.
Kovid Batra: Totally makes sense. All right, moving on. Uh, the next question is for Cesar from Saloni. Uh, good to see you here. I have a question around burnout. How do you address burnout or disengagement while pushing for high productivity? Oh, very relevant question, actually.
Cesar Rodriguez: Yeah, so so for this one, I actually use Typo as well. Um, so Typo has this gauge to, um, that tells you based on the data that it’s collecting, whether somebody is working higher than expected or lower than expected. And it gives you an alert saying, hey, this person may be prone to burnout or this person is burning out. Um, so I use that gauge to detect how is the team doing and it’s always about having a conversation with the individual and seeing what’s going on with their lives. There may be, uh, work things that are impacting their productivity. There may be things that are outside of work that are impacting that individual’s productivity. So you have to work around that. Um, we are, uh, it’s all about people in the end, um, and working with them, setting the right expectations and at the same time being accommodating if they’re experiencing burnout.
Kovid Batra: Cool. I think, uh, more than myself, uh, you have promoted Typo a lot today. Great, but glad to know that the tool is really helping you and your team. Yeah. Next question. Uh, this one is again for you, Cesar from Nisha. Uh, how do you encourage accountability without micromanaging your team?
Cesar Rodriguez: I think, I think Ariel answered this question and I take this approach even with my kids. Um, it’s not about telling them what to do. It’s about listening and helping them learn and come to the same conclusion as you’re coming to without forcing your way into it. So, so yeah, you have to listen to everybody, listen to your stakeholders, listen to your team, and then help them and drive a conversation that can point them in the right direction without forcing them or giving them the answer which is, which requires a lot of tact.
Ariel Pérez: One more thing I’ll add to that, right, is, you know, so that folks don’t forget and think that, you know, we’re copping out and saying, hold on, what’s your job as a leader? What are you accountable for? Right? In that part, there’s also like, our job is let them know what’s important. It’s our job to tell them what is the most important thing, what is the most important thing now, what is the most important thing long term, and repeat that ad hominem until they make fun of you for it, but they need to understand what’s the most important, what’s the strategy, so you need to provide context, because there’s a piece of, it’s almost like, it’s unfair, and it’s actually, I think, very, um, it’s a very negative thing to say, go figure it out, without telling them, hold on, figure what out? So that’s a key piece there as well, right? It’s you, you’re accountable as the leader for telling them what’s important, letting them understand why this is important, providing context.
Kovid Batra: Totally. All right. Next one. This one’s for you, Cesar. According to you, what are the most common misconceptions about engineering productivity? How do you address them?
Cesar Rodriguez: So, so I think the, for me, the biggest thing is people try to come with all these new words, DORA, SPACE, uh, whatever latest and greatest thing is. Um, the biggest thing is that, uh, there’s not going to be a cookie cutter approach. You have to take what works from those frameworks to your specific team in your specific situation of your business right now. And then from there, you have to look at the data and adapt as your team and as your business is evolving. So that’s, that’s the biggest. misconception for me. Um, you can take, you can learn a lot from the things that are out there, but always keep in mind that, um, you have to put that into the context of your current situation.
Kovid Batra: I think, uh, Ariel, I would like to hear you on this one too.
Ariel Pérez: Yeah. Uh, definitely. Um, I think for me, one of the most common misconceptions about engineering productivity as a whole is this idea that engineering is like manufacturing. And for so long, we’ve applied so many ideas around, look, engineering is all about shipping more code because just like in a fan of factory, let’s get really good at shipping code and we’re going to be great. That’s how you measure productivity. Ship more code, just like ship more widgets. How many widgets can I ship per, per hour? That’s a great measure of engineering productivity in a factory. It’s a horrible measure of productivity in engineering. And that’s because many people, you know, don’t realize that engineering productivity and engineering in particular, and I’m gonna talk development, as a piece of development, is it’s more R&D than it is like doing things than it’s actual shipping things. Software development is 99% research and development, 1% actually coding the thing. And if they want any more proof of that is if you have an engineer working on something or a team working on something for three weeks and somehow it all disappears and they lose all of it, how long will it take them to recode the same thing? They’ll probably recode the same thing in about a day. So that tells you that most of those three weeks was figuring out the right thing, the right solution, the right piece, and then the last piece was just coding it. So I think for me, that’s the big misconception about engineering productivity, that it has anything to do with manufacturing. No, it has everything to do with R&D. So if we want to understand how to better measure engineering productivity, look at industries where R&D is a very, very heavy piece of what they do. How do they measure productivity? How did they think about productivity of their R&D efforts?
Kovid Batra: Cool. Interesting. All right. I think with that, uh, we come to the end of this session. Before we part, uh, I would like to thank both of you for making this session so interesting, so insightful for all of us. And thanks to the audience for bringing up such nice questions. Uh, so finally, before we part, uh, Ariel, Cesar, anything you would say as parting thoughts?
Ariel Pérez: Cesar, you wanna go first?
Cesar Rodriguez: No, no, um, no, no parting thoughts here. Feel free to, anyone that wants to chat more, feel free to hit me up on LinkedIn. Check out stackgen.com if you want to learn about what we do there.
Ariel Pérez: Awesome. Um, for me, uh, in terms of parting thoughts is; and this is just because how I’ve personally thought about this is, um, I think if you lean on the figuring out what makes people tick and figure, and you’re trying to take your job from the perspective of how do I improve people, how to enrich people’s lives, how do I make them better at what they do every day? If you take it from that perspective, I don’t think you can ever go wrong. If you make your people super happy and engaged and they want to be here and you’re constantly motivating them, building them and growing them, as a consequence, the productivity, the outputs, the outcomes, all that stuff will come. I firmly believe that. I’ve seen it. I firmly believe it. It really, it would be really hard to argue that with some folks, but I firmly believe it. So that’s my parting thoughts, focus on the people and what makes them tick and what makes them work, everything else will fall into place. And if I, you know, just like Cesar, I can’t walk away without plugging Tinybird. Tinybird is, you know, data infrastructure for software teams. You want to go faster, you want to be more productive, you want to ship solutions faster and for the customers, Tinybird is, is built for that. It helps engineering teams build solutions over analytical data faster than anyone else without adding more people. You can keep your team smaller for longer because Tinybird helps you get that efficiency, that productivity out there.
Kovid Batra: Great. Thank you so much guys and all the best for your ventures and for the efforts that you’re doing. Uh, we’ll see you soon again. Thank you.
Cesar Rodriguez: Thanks, Kovid.
Ariel Pérez: Thank you very much. Bye bye.
Cesar Rodriguez: Thank you. Bye!

Every delay in your deployment could mean losing a customer. Speed and reliability are crucial, yet many teams struggle with slow deployment cycles, frustrating rollbacks, and poor visibility into performance metrics.
When you’ve worked hard on a feature, it is frustrating when a last-minute bug derails the deployment. Or you face a rollback that disrupts workflows and undermines team confidence. These familiar scenarios breed anxiety and inefficiency, impacting team dynamics and business outcomes.
Fortunately, DORA metrics offer a practical framework to address these challenges. The assessment team at Google developed the four key measurements, known as DORA metrics, to evaluate and improve DevOps performance. However, defining what constitutes a ‘deployment’ or a ‘failure’ can vary across different teams and systems, which can complicate their implementation. Establishing clear definitions is essential for consistent and meaningful analysis. Additionally, interpreting DORA metrics requires expertise to effectively contextualize and analyze the data to avoid misinterpretation or skewed results.
By leveraging these metrics, organizations can gain insights into their CI/CD practices, pinpoint areas for improvement, and cultivate a culture of accountability. Effective software delivery practices, as measured by DORA metrics, directly influence business outcomes and help align technology initiatives with strategic goals. By tracking DORA metrics, organizations can move beyond subjective opinions about process efficiency and instead rely on concrete measurements to guide improvement efforts. This blog will explore how to optimize CI/CD processes using DORA metrics, providing best practices and actionable strategies to help teams deliver quality software faster and more reliably.
The four key measurements form the foundation of the DORA framework, helping teams focus on both velocity and stability for continuous improvement. These two critical aspects—velocity and stability—are at the core of DORA metrics, providing a balanced view of software delivery performance.
Before we dive into solutions, it’s important to recognize the common challenges teams face in CI/CD optimization. By understanding these issues, we can better appreciate the strategies needed to overcome them.
Among the critical aspects of CI/CD optimization are velocity and stability, which are essential for measuring performance and reliability in software delivery. High deployment frequency, for instance, indicates agility and the ability to respond quickly to customer needs and market demands, making it a key metric for assessing team performance. DORA metrics also help evaluate the team's ability to quickly implement changes, resolve issues, and recover from failures, ensuring continuous delivery and improved reliability.
Development teams frequently experience slow deployment cycles due to a variety of factors, including complex code bases, inadequate testing, and manual processes. Each of these elements can create significant bottlenecks. A sluggish cycle not only hampers agility but also reduces responsiveness to customer needs and market changes. To address this, teams can adopt practices like:
Frequent rollbacks can significantly disrupt workflows and erode team confidence. They typically indicate issues such as inadequate testing, lack of integration processes, or insufficient quality assurance. To mitigate this:
A lack of visibility into your CI/CD pipeline can make it challenging to track performance and pinpoint areas for improvement. This opacity can lead to delays and hinder your ability to make data-driven decisions. To improve visibility:
Cultural barriers between development and operations teams can lead to misunderstandings and inefficiencies. To foster a more collaborative environment:
We understand how these challenges can create stress and hinder your team’s well-being. Addressing them is crucial not just for project success but also for maintaining a positive and productive work environment.
DORA (DevOps Research and Assessment) metrics are key performance indicators that provide valuable insights into your software delivery performance. They help measure and improve the effectiveness of your CI/CD practices, making them crucial for software teams aiming for excellence. DORA metrics are a subset of DevOps metrics used to measure performance in software development, focusing on deployment frequency, lead time, change failure rate, and mean time to recovery. By implementing DORA metrics, teams can systematically measure and improve their software delivery performance, leading to more efficient and stable software development processes.
By understanding and utilizing these metrics, software teams gain actionable insights that foster continuous improvement and a culture of accountability.
Implementing best practices is crucial for optimizing your CI/CD processes. Each practice provides actionable insights that can lead to substantial improvements.
To effectively measure and analyze your current performance, start by utilizing the right tools to gather valuable data. This foundational step is essential for identifying areas that need improvement. Many teams struggle with the complexity of data collection, as these metrics require information from multiple systems. Ensuring seamless integration between tools is critical to overcoming this challenge and achieving accurate measurements.
How Typo helps: Typo seamlessly integrates with your CI/CD tools, offering real-time insights into DORA metrics. This integration simplifies assessment and helps identify specific areas for enhancement.
Clearly defined goals are crucial for driving performance. Establishing specific, measurable goals aligns your team’s efforts with broader organizational objectives.
How Typo helps: Typo’s goal-setting and tracking capabilities promote accountability within your team, helping monitor progress toward targets and keeping everyone aligned and focused.
Implementing gradual changes based on data insights can lead to more sustainable improvements. Focusing on small, manageable changes can often yield better results than sweeping overhauls.
How Typo helps: Typo provides actionable recommendations based on performance data, guiding teams through effective process changes that can be implemented incrementally.
A collaborative environment fosters innovation and efficiency. Encouraging open communication and shared responsibility can significantly enhance team dynamics.
How Typo helps: With features like shared dashboards and performance reports, Typo facilitates transparency and alignment, breaking down silos and ensuring everyone is on the same page.
Regular reviews are essential for maintaining momentum and ensuring alignment with goals. High performing teams regularly review their metrics and adapt their strategies to maintain excellence in software delivery. Establishing a routine for evaluation can help your team adapt to changes effectively.
How Typo helps: Typo’s advanced analytics capabilities support in-depth reviews, making it easier to identify trends and adapt your strategies effectively. This ongoing evaluation is key to maintaining momentum and achieving long-term success.
DORA metrics comprise a sophisticated analytical framework for measuring and optimizing software delivery performance trajectories across organizational ecosystems. By diving into the four core metrics—deployment frequency, lead time for changes, change failure rate, and time to restore service—development and operations teams gain comprehensive, data-driven visibility into their software delivery mechanisms. These fundamental performance indicators enable teams to transcend assumption-based approaches, facilitating evidence-driven decision-making processes that generate substantial operational enhancements and delivery optimization.
Let's explore how DORA metrics demonstrate exceptional capabilities in pinpointing critical bottlenecks within software delivery pipelines and infrastructure patterns. By analyzing deployment frequency patterns and lead time trajectories for changes, teams can swiftly identify where operational delays manifest and strategically concentrate their optimization efforts on streamlining those specific areas. Monitoring change failure rate metrics and time to restore service parameters assists teams in evaluating the reliability coefficients and resilience characteristics of their delivery performance, ensuring that incidents are addressed with optimal efficiency and systematic effectiveness across all deployment phases.
DORA metrics also cultivate an organizational culture of continuous improvement by generating actionable intelligence that drives collaborative synergy between development and operations teams. With shared understanding of delivery performance analytics, teams can collaborate to optimize development processes, minimize lead time variables, and enhance the overall quality parameters of software delivery operations. Ultimately, DORA metrics establish the foundational infrastructure for high-performing, agile organizational structures that consistently deliver optimized value streams to customers and business stakeholders through data-driven performance enhancement methodologies.
Code quality and robust testing have fundamentally reshaped the landscape of achieving unprecedented software delivery performance. In today's fast-paced world of modern software delivery, how can teams ensure that every code change delivers reliability and stability? The answer lies in streamlining automated testing approaches—such as unit tests and integration tests—that dive deep into catching defects early in the development process, facilitating a dramatic reduction in the risk of issues making their way to production environments.
But how do teams truly assess the effectiveness of their code quality and testing practices? The four DORA metrics provide an unprecedented lens through which development and operations teams can evaluate their approaches. A low change failure rate signals that automated testing and code reviews are reshaping development workflows effectively, while high deployment frequency demonstrates the team's ability to streamline updates with confidence and speed. Continuous integration and continuous delivery (CI/CD) practices, including automated testing and peer code reviews, facilitate the identification of bottlenecks in development processes and ensure that only exceptional code quality reaches deployment stages.
How can teams pinpoint areas where their software delivery process may be lagging? By closely monitoring code quality and testing metrics, teams dive into analyzing whether it's slow feedback from tests, gaps in test coverage, or recurring issues disrupting production environments. Addressing these bottlenecks doesn't just improve delivery performance—it facilitates a culture of continuous improvement that transforms development practices. Ultimately, investing in code quality and automated testing streamlines both development and operations teams' ability to deliver reliable software at unprecedented deployment frequencies, reshaping outcomes for the business and driving exceptional results for customers.
Establishing comprehensive benchmarking protocols and implementing sophisticated performance tracking mechanisms constitute fundamental pillars in optimizing software delivery workflows and operational excellence. By strategically leveraging DORA (DevOps Research and Assessment) metrics frameworks, development teams acquire a standardized, research-backed methodology for quantifying and systematically comparing their software delivery capabilities against industry-established benchmarks, competitive standards, and internally-defined strategic objectives. Top performers on DORA metrics are twice as likely to meet or exceed organizational performance goals, highlighting the value of these metrics in driving success. This empirically-driven approach empowers organizations to establish realistic, data-informed targets while identifying emerging patterns and performance trajectories that directly inform continuous improvement initiatives, resource allocation decisions, and strategic technology investments across the entire software development lifecycle.
Critical performance indicators encompassing deployment frequency rates, lead time measurements for implementing changes, mean time to recovery protocols, and change failure rate analytics provide granular, actionable insights into the operational health, efficiency bottlenecks, and reliability characteristics of the complete software delivery pipeline infrastructure. In addition to the traditional four, other DORA metrics serve as key performance indicators that further enhance measurement of system reliability, availability, and service quality, especially within DevOps and SRE practices. Systematically tracking these sophisticated metrics through advanced monitoring platforms such as DataDog, New Relic, or Prometheus-based solutions, coupled with automated performance dashboards utilizing tools like Grafana or Kibana, enables development teams to rapidly identify deviations from established performance baselines, pinpoint specific bottlenecks within deployment workflows, diagnose infrastructure inefficiencies, and make informed, data-driven decisions that systematically enhance delivery performance while reducing operational risks and minimizing downtime incidents.
Implementing strategic benchmarking initiatives against industry-leading organizations, competitive peer teams, or established technology standards enables organizations to comprehensively understand their current market position, identify performance gaps, and determine necessary improvement areas to maintain competitive advantage in rapidly evolving technological landscapes. Automated performance tracking systems utilizing machine learning algorithms and predictive analytics ensure that development teams can respond dynamically to environmental changes, adapt their operational processes based on real-time performance data, and consistently maintain elevated standards of software delivery excellence. By establishing benchmarking and comprehensive performance tracking as integral, routine components of the software delivery lifecycle, organizations systematically foster a culture of continuous improvement, data-driven decision making, and ensure that their delivery methodologies evolve strategically to meet dynamic business requirements, market demands, and technological advancement opportunities.
Flow metrics constitute comprehensive analytical frameworks that are instrumental for optimizing the software delivery lifecycle, providing unprecedented visibility and deep insights into the entire development workflow ecosystem. By systematically tracking and analyzing flow velocity (the rate at which work items progress through the development pipeline), flow time (the total duration required for work items to traverse from initiation to completion), flow efficiency (the ratio of value-adding activities to non-value-adding time such as waiting, delays, or rework), and flow load (the amount of work in progress across different stages), development teams can identify critical trends, patterns, and performance indicators that significantly impact software delivery performance metrics. These sophisticated measurement tools enable teams to comprehensively understand how work items move through complex development processes, making it substantially easier to spot inefficiencies, workflow bottlenecks, and strategic areas for process enhancement and optimization.
The optimization of flow metrics empowers development teams to systematically reduce lead time, substantially increase deployment frequency, and enhance overall delivery performance across the entire software development lifecycle. For instance, continuous monitoring of flow time reveals comprehensive insights into how long work items require to move from initial conception to final completion, while flow efficiency analysis highlights the precise proportion of time dedicated to value-adding development activities versus non-productive waiting periods or rework cycles. Through systematic analysis of these performance metrics, teams can identify critical bottlenecks within the development process infrastructure and implement targeted strategic changes that drive meaningful, measurable results in software delivery performance and operational efficiency.
Utilizing flow metrics in conjunction with DevOps Research and Assessment (DORA) metrics creates a powerful synergy that empowers development teams to make data-driven, informed decisions regarding resource allocation strategies, process improvement initiatives, and comprehensive workflow adjustments. This holistic, integrated approach to monitoring the development flow ecosystem ensures that teams can continuously optimize their software delivery pipeline infrastructure, respond swiftly and effectively to changing business demands and market requirements, and deliver high-quality, scalable software solutions that meet organizational objectives and performance standards.
Customer satisfaction serves as the ultimate performance indicator for software delivery processes across modern development environments. Delivering robust, high-quality software that precisely aligns with user requirements establishes the foundation for building sustained trust relationships and accelerating business growth trajectories. The four DORA metrics provide comprehensive analytical insights into how effectively development teams achieve these strategic objectives, illuminating specific areas where delivery performance enhancements directly correlate with elevated customer satisfaction levels.
High deployment frequency coupled with reduced lead time for changes demonstrates that development teams can respond with exceptional agility to customer feedback loops and dynamically evolving requirements, while maintaining low change failure rates reflects the inherent reliability and operational stability of the software being delivered to production environments. These tools leverage continuous delivery practices, including automated testing frameworks and streamlined deployment pipelines, to significantly enhance the team's capability to deliver measurable value with both speed and consistency. Machine learning algorithms analyze deployment patterns to optimize resource allocation and predict potential bottlenecks before they impact delivery schedules.
Organizations monitor customer satisfaction metrics—including support ticket volume analytics, application uptime percentages, and comprehensive user feedback data—alongside DORA performance indicators to identify emerging trends and implement meaningful improvements to their software delivery methodologies. These tools dive into historical performance data, analyzing team velocity and deployment success rates to facilitate data-driven decision making processes. Implementation of DORA metrics and regular performance tracking enables development teams to proactively address operational issues, optimize their delivery processes, and consistently deliver superior user experiences. They also help in facilitating communication among stakeholders by automating performance reporting, summarizing deployment outcomes, and generating actionable insights for continuous improvement initiatives. This comprehensive approach to customer satisfaction, supported by data-driven insights derived from DORA metrics analysis, ultimately leads to enhanced organizational performance and sustainable long-term business success.
The strategic implementation of DORA metrics and flow metrics tracking has fundamentally reshaped how organizations approach software delivery performance measurement, requiring sophisticated toolsets that dive deep into multi-system data collection, analysis, and visualization capabilities. Advanced monitoring platforms like New Relic and Splunk have revolutionized real-time insights into software delivery performance, empowering teams to anticipate future trends and proactively identify bottlenecks that could impact the entire software delivery pipeline. These transformative platforms enable development and operations teams to shift from reactive troubleshooting to predictive performance optimization, addressing potential issues before they cascade into delivery performance degradation.
Version control systems like Git serve as the foundational backbone for tracking code evolution and facilitating unprecedented collaboration among distributed development teams. Continuous integration powerhouses such as Jenkins and CircleCI have automated and streamlined testing and deployment workflows, ensuring that every code commit undergoes rigorous validation and seamlessly integrates into the main branch architecture. By leveraging these intelligent automation tools, teams can dramatically reduce manual intervention, eliminate resource-intensive bottlenecks, and maintain consistently high standards of code quality that drive sustained delivery excellence.
Specialized solutions like Typo further amplify the capability to track DORA metrics, delivering actionable intelligence and forward-looking recommendations that shape continuous improvement initiatives. Typo's sophisticated integrations with CI/CD and monitoring ecosystems facilitate a truly data-driven approach to software delivery optimization, making it substantially easier for teams to collaborate effectively, identify emerging trends, and implement transformative improvement strategies. With these powerful tools strategically positioned throughout the delivery pipeline, organizations can achieve unprecedented optimization of their software delivery workflows, make informed decisions based on comprehensive performance analytics, and sustain long-term delivery performance excellence that drives competitive advantage.
To enhance your CI/CD process and achieve faster deployments, consider implementing the following strategies. Optimizing deployment processes is crucial for achieving faster and more reliable deployments, as it streamlines workflows, increases efficiency, and reduces the risk of failures.
Automate various aspects of the development lifecycle to improve efficiency. For build automation, utilize tools like Jenkins, GitLab CI/CD, or CircleCI to streamline the process of building applications from source code. This reduces errors and increases speed. Implementing automated unit, integration, and regression tests allows teams to catch defects early in the development process, significantly reducing the time spent on manual testing and enhancing code quality.
Additionally, automate the deployment of applications to different environments (development, staging, production) using tools like Ansible, Puppet, or Chef to ensure consistency and minimize the risk of human error during deployments.
Employ a version control system like Git to effectively track changes to your codebase and facilitate collaboration among developers. Implementing effective branching strategies such as Gitflow or GitHub Flow helps manage different versions of your code and isolate development work, allowing multiple team members to work on features simultaneously without conflicts.
Encourage developers to commit their code changes frequently to the main branch. This practice helps reduce integration issues and allows conflicts to be identified early. Set up automated builds and tests that run whenever new code is committed to the main branch.
This ensures that issues are caught immediately, allowing for quicker resolutions. Providing developers with immediate feedback on the success or failure of their builds and tests fosters a culture of accountability and promotes continuous improvement.
Automate the deployment of applications to various environments, which reduces manual effort and minimizes the potential for errors. Ensure consistency between different environments to minimize deployment risks; utilizing containers or virtualization can help achieve this.
Additionally, consider implementing canary releases, where new features are gradually rolled out to a small subset of users before a full deployment. This allows teams to monitor performance and address any issues before they impact the entire user base.
Use tools like Terraform or CloudFormation to manage infrastructure resources (e.g., servers, networks, storage) as code. This approach simplifies infrastructure management and enhances consistency across environments. Store infrastructure code in a version control system to track changes and facilitate collaboration.
This practice enables teams to maintain a history of infrastructure changes and revert if necessary. Ensuring consistent infrastructure across different environments through IaC reduces discrepancies that can lead to deployment failures.
Implement monitoring tools to track the performance and health of your applications in production. Continuous monitoring allows teams to proactively identify and resolve issues before they escalate. Set up automated alerts to notify teams of critical issues or performance degradation.
Quick alerts enable faster responses to potential problems. Use feedback from monitoring and alerting systems to identify and address problems proactively, helping teams learn from past deployments and improve future processes. Continuous feedback also enhances the team's ability to quickly identify and resolve issues in the deployment pipeline.
By implementing these best practices, you will improve your deployment speed and reliability while also boosting team satisfaction and delivering better experiences to your customers. Remember, you're not alone on this journey—resources and communities are available to support you every step of the way.
Your best bet for seamless collaboration is with Typo, sign up for a personalized demo and find out yourself!

Mobile development comes with a unique set of challenges: rapid release cycles, stringent user expectations, and the complexities of maintaining quality across diverse devices and operating systems. Engineering teams need robust frameworks to measure their performance and optimize their development processes effectively.
DORA metrics—commonly referred to as the four key metrics for software delivery performance—are essential performance metrics that provide valuable insights into a team’s DevOps performance. These four key metrics are Deployment Frequency, Lead Time for Changes, Mean Time to Recovery (MTTR), and Change Failure Rate. DORA metrics provide a clear, no-nonsense snapshot of a team’s performance, helping teams focus on what really matters. These metrics evaluate a team's ability to deliver software safely, quickly, and efficiently by measuring throughput and instability. Leveraging these metrics can empower mobile development teams to make data-driven improvements that boost efficiency and enhance user satisfaction.
DORA’s research shows that these performance metrics predict better organizational performance and well-being for team members. DORA metrics serve as benchmarks for tracking a team's performance and can be tailored to each team's specific workflows and goals. DORA metrics work for any type of technology your organization is delivering, but are best suited for measuring one application or service at a time. They focus on both speed and stability in software delivery and can be used to assess the delivery performance of any application or service.
To get started, many organizations begin with a pilot project to analyze the current state and establish baseline metrics before full implementation.
DORA metrics, rooted in research from the DevOps Research and Assessment (DORA) group, are key metrics and devops metrics for measuring software development and delivery performance. They help teams assess and improve critical aspects of their workflows, providing benchmarks for a team’s performance and ability to deliver software efficiently.
Here’s why they matter for mobile development:
Mobile development presents unique challenges for applying DORA metrics, such as app store review processes and user update behavior, which can delay deployments and skew measurements. High-performing mobile teams adapt by focusing on internal or beta release channels to accurately capture deployment frequency and lead time, bypassing external review bottlenecks. Tracking these devops metrics and key metrics helps assess a team’s performance and team’s ability to deliver high-quality software development efficiently.
Reliability is measured by consistency in meeting performance and uptime goals, with a typical target of 99.9% minimum availability.
Measuring deployment frequency is a cornerstone of tracking DORA metrics in mobile app development. Deployment frequency reflects how often an organization successfully releases code to production, serving as a direct indicator of a team’s ability to deliver new features, bug fixes, and improvements to users. Deployment frequency is also a key indicator of software delivery throughput, showing how many changes can pass through the system over time and highlighting overall delivery efficiency. For mobile engineering teams, this metric is especially important, as it highlights the efficiency and agility of the software delivery process.
Unlike web or backend services, mobile app development faces unique challenges when it comes to deployment frequency. The app store review process, user update cycles, and the need to support multiple platforms can all impact how often new versions reach end users. Despite these hurdles, tracking deployment frequency provides valuable insights into software delivery performance and helps teams identify opportunities for continuous improvement.
To calculate deployment frequency in mobile apps, teams should track the number of production releases over a defined period—such as weekly, biweekly, or monthly. This can include both public app store releases and significant internal releases, depending on the team’s goals. By monitoring this key DORA metric, mobile teams can assess their development process, pinpoint bottlenecks, and make data-driven decisions to optimize their workflow.
Here’s how mobile engineering teams can effectively measure and improve deployment frequency:
By integrating deployment frequency measurement into their workflow, mobile teams gain a clearer picture of their software delivery performance. Tracking this key metric alongside the other four key DORA metrics—lead time for changes, change failure rate, and mean time to restore—enables engineering teams to optimize their delivery process, reduce bottlenecks, and deliver better software faster.
Ultimately, focusing on deployment frequency empowers mobile engineering teams to make data-driven decisions, improve organizational performance, and enhance customer satisfaction. With the right tools and processes in place, teams can overcome the unique challenges of mobile app development and achieve meaningful improvements in their software delivery process.
Change lead time is a pivotal DORA metric that directly impacts software delivery performance in mobile app development. For mobile teams, lead time measures how quickly a code change—such as a bug fix or new feature—moves from commit to production release. Shortening this lead time is essential for maintaining a competitive edge, responding to user feedback, and delivering new features efficiently.
To optimize change lead time, mobile teams should invest in robust automated testing and continuous integration (CI) pipelines. Automated testing accelerates the feedback loop, allowing teams to catch and resolve issues early in the development process. By integrating CI, every code commit is automatically built, tested, and validated, reducing manual intervention and minimizing delays.
Feature flags are another powerful tool for managing change lead time in mobile releases. By decoupling feature rollout from code deployment, feature flags enable teams to test and validate new features in production-like environments without exposing them to all users. This approach allows for incremental releases, targeted testing, and rapid rollback if issues arise, all of which contribute to faster and safer delivery performance.
Ultimately, by streamlining change lead time through automation, CI, and feature flags, mobile teams can enhance their software delivery process, reduce bottlenecks, and ensure that valuable updates reach users quickly and reliably.
Change failure rate is a key DORA metric that reflects the percentage of deployments resulting in failures or degraded service. In mobile development, maintaining a low failure rate is crucial for user trust and app store ratings. Mobile teams can proactively reduce change failure rate by implementing a combination of automated testing, thorough code reviews, and continuous monitoring.
Automated testing—covering unit, integration, and end-to-end scenarios—ensures that code changes are validated before reaching production. This reduces the likelihood of introducing bugs or regressions. Rigorous code reviews further enhance code quality by catching potential issues early and promoting knowledge sharing within the team.
Deployment strategies such as canary releases and blue-green deployments are particularly effective in mobile environments. Canary releases allow teams to roll out changes to a small subset of users, monitor for issues, and gradually expand the rollout if no problems are detected. Blue-green deployments provide a safe way to switch between app versions, minimizing downtime and enabling quick rollback in case of failures.
By leveraging analytics and monitoring tools, mobile teams can identify patterns in failures and address root causes before they escalate. This data-driven approach not only reduces the change failure rate but also strengthens the overall reliability and stability of mobile apps, leading to improved user experiences and higher customer satisfaction.
For mobile teams aiming to excel in software delivery performance, tracking a comprehensive set of delivery performance metrics is essential. While DORA metrics—such as deployment frequency, lead time, and change failure rate—form the foundation, additional metrics like cycle time and throughput provide deeper insights into the delivery process.
Deployment frequency measures how often new code is released to users, reflecting the team’s agility and responsiveness. Lead time tracks the speed at which changes move from development to production, while cycle time captures the total time from work initiation to completion. Monitoring these performance metrics helps mobile teams pinpoint bottlenecks, optimize workflows, and drive continuous improvement.
By regularly reviewing these metrics, mobile teams gain valuable insights into their software delivery process. This enables them to identify areas for improvement, streamline their delivery pipeline, and ultimately enhance their ability to deliver high-quality software quickly and efficiently. Leveraging these key indicators empowers teams to make informed, data-driven decisions that support ongoing delivery performance optimization.
Measuring DevOps performance in mobile environments requires a tailored approach that combines DORA metrics with mobile-specific tools and practices. Mobile teams can track deployment frequency, lead time for changes, and change failure rate to assess their software delivery performance and identify opportunities for improvement.
Specialized tools, such as Appcircle, offer mobile-focused DevOps performance measurement, providing visibility into the unique challenges of mobile app delivery. By integrating these tools with existing CI/CD pipelines, mobile teams can automate the collection of key metrics and gain real-time insights into their delivery process.
Analyzing DORA metrics alongside other performance indicators enables mobile teams to uncover trends, detect inefficiencies, and implement targeted improvements. This holistic approach to measuring DevOps performance ensures that new features are delivered faster, software quality is maintained, and the overall delivery process is continuously optimized. By embracing data-driven practices, mobile teams can achieve higher levels of delivery performance and consistently meet user expectations.
Tracking DORA metrics in mobile app development involves a range of technical strategies. Measuring DORA metrics is essential for assessing and improving software delivery performance, and achieving this requires precise data collection and analysis. Here, we explore practical approaches to implement effective measurement and visualization of these metrics.
Incident Response and MTTR Management:
A critical aspect of DORA metrics is Mean Time to Restore (MTTR), which measures how quickly teams can recover from failures or outages. Fixing bugs quickly is a vital part of incident response, as it helps restore service and minimize the impact on end users. The ability to restore service rapidly after failures is a key indicator of a team's resilience and efficiency. Automated monitoring, alerting, and robust rollback mechanisms are essential for reducing MTTR and ensuring reliable mobile app performance.
Integrating DORA metrics into existing workflows requires more than a simple add-on; it demands technical adjustments and robust toolchains that support continuous data collection and analysis. To successfully implement DORA metrics, organizations should follow a structured process that is tailored to each team’s specific needs, ensuring commitment, collaboration, and continuous improvement.
Automating the collection of DORA metrics starts with choosing the right CI/CD platforms and tools that align with mobile development. Popular options include:
Technical setup: For accurate deployment tracking, implement triggers in your CI/CD pipelines that capture key timestamps at each stage (e.g., start and end of builds, start of deployment). This can be done using shell scripts that append timestamps to a database or monitoring tool. Additionally, track changes in the development branch to monitor change lead and change lead time, ensuring efficient measurement of how quickly code moves from commit to deployment.
To make sense of the collected data, teams need a robust visualization strategy. Here’s a deeper look at setting up effective dashboards:
Technical Implementation Tips:
Testing is integral to maintaining a low change failure rate. Test automation is essential for ensuring reliable measurement and continuous improvement of DORA metrics in mobile app development. To align with this, engineering teams should develop thorough, automated testing strategies:
Pipeline Integration:
Reducing MTTR requires visibility into incidents and the ability to act swiftly. Engineering teams should:
Strategies for Quick Recovery:
After implementing these technical solutions, teams can leverage Typo for seamless DORA metrics integration. Typo can help consolidate data and make metric tracking more efficient and less time-consuming.
For teams looking to streamline the integration of DORA metrics tracking, Typo offers a solution that is both powerful and easy to adopt. Typo provides:
Typo's integration capabilities mean engineering teams don't need to build custom scripts or additional data pipelines. With Typo, developers can focus on analyzing data rather than collecting it, ultimately accelerating their journey toward continuous improvement.
To fully leverage DORA metrics, teams must establish a feedback loop that drives continuous improvement. This section outlines how to create a process that ensures long-term optimization and alignment with development goals.
To maximize the impact of DORA metrics in mobile development, teams should adopt a set of proven best practices. Automating testing and deployment processes is fundamental, as it accelerates feedback loops and reduces manual errors. Feature flags empower teams to control feature rollouts independently of app releases, enabling safer experimentation and faster delivery.
Continuous monitoring of software delivery performance is essential for tracking DORA metrics and identifying areas for improvement. Setting clear goals—such as reducing lead time or increasing deployment frequency—helps teams stay focused and measure progress effectively. Leveraging analytics to spot trends and proactively address issues ensures that teams are always moving toward higher performance.
Utilizing third-party tools like Typo can further streamline the process of tracking DORA metrics, providing valuable insights and reducing the overhead of manual data collection. By following these best practices, mobile teams can enhance their delivery performance, minimize risk, and consistently deliver high-quality apps that delight users.
DORA metrics provide mobile engineering teams with the tools needed to measure and optimize their development processes, enhancing their ability to release high-quality apps efficiently. By integrating DORA metrics tracking through automated data collection, real-time monitoring, comprehensive testing pipelines, and advanced incident response practices, teams can achieve continuous improvement.
Tools like Typo make these practices even more effective by offering seamless integration and real-time insights, allowing developers to focus on innovation and delivering exceptional user experiences.

For agile teams, tracking productivity can quickly become overwhelming, especially when too many metrics clutter the process. Agile metrics are quantitative tools used by agile software development teams to assess productivity, track team performance, and monitor progress. Many teams feel they’re working hard without seeing the progress they expect. By focusing on a handful of high-impact JIRA metrics, teams can gain clear, actionable insights that streamline decision-making and help them stay on course.
Delivery speed is a key metric for Agile teams, measuring how quickly teams can release software and playing a crucial role in supporting continuous delivery.
Selecting 3-5 key metrics that align with project objectives helps avoid data overload and ensures clarity.
These five essential metrics highlight what truly drives productivity, enabling teams to make informed adjustments that propel their work forward.
Agile teams often face missed deadlines, unclear priorities, and resource management issues. Key performance indicators (KPIs) are essential metrics for evaluating project success and progress, helping teams measure whether they are meeting their goals. Without effective metrics, these issues remain hidden, leading to frustration. JIRA metrics provide clarity on team performance, enabling early identification of bottlenecks and allowing teams to stay agile and efficient. By tracking just a few high-impact metrics, teams can make informed, data-driven decisions that improve workflows and outcomes.
However, metrics can be a double-edged sword, as they can either provide valuable insights or create a toxic environment if misused. If used punitively, teams may inflate metrics to appear better without achieving actual program goals.
Excessive focus on performance metrics can lead to tunnel vision, neglecting qualitative aspects of development.
It’s equally important to balance quantitative metrics with qualitative feedback, as both are essential for enhancing team performance in an agile environment and fostering a healthy team culture. Additionally, metrics should align with the program and portfolio’s goals to be effective and meaningful.
In today's rapidly evolving agile development ecosystems, data-driven decision-making frameworks serve as the foundational architecture for successful project orchestration and delivery optimization. JIRA empowers agile development teams with comprehensive analytics capabilities and key performance indicators (KPIs) that facilitate intelligent, metrics-based strategic choices throughout every phase of the software development lifecycle. By implementing consistent performance tracking methodologies through critical metrics such as story points velocity, cycle time optimization, and lead time analysis, development teams establish clear visibility into their operational efficiency and can execute tactical adjustments to maximize project outcomes and delivery throughput.
Consider the strategic implementation of story points completion tracking across sprint iterations—this approach enables development teams to evaluate whether their sprint capacity planning aligns with actual execution capabilities, thereby facilitating enhanced estimation accuracy and optimal resource distribution strategies. Deep-dive analysis of cycle time patterns and lead time metrics delivers actionable intelligence regarding workflow velocity from initial requirement inception through final deployment completion, enabling teams to pinpoint process bottlenecks and implement streamlined workflow optimizations. When development teams detect anomalous spikes in cycle time performance, they can initiate comprehensive root cause analysis—examining potential process inefficiencies, resource allocation constraints, or dependency management issues—and deploy targeted remediation strategies to resolve performance degradation.
Through strategic metrics leverage and comprehensive data analysis, agile development teams can systematically identify optimization opportunities, implement intelligent resource allocation algorithms, and maintain strict alignment with project objectives and delivery timelines. This data-driven operational approach not only accelerates continuous improvement initiatives but also enhances customer satisfaction metrics by ensuring predictable delivery schedules and superior quality deliverables. Ultimately, leveraging JIRA's comprehensive analytics platform empowers development teams to execute informed strategic decisions that drive both immediate operational progress and sustainable long-term project success across the entire development ecosystem.
Work In Progress (WIP) measures the number of tasks actively being worked on. Setting WIP limits, which are commonly applied on a kanban board, encourages teams to complete existing tasks before starting new ones. This reduces task-switching, increases focus, and improves overall workflow efficiency.
When identifying bottlenecks, teams can use metrics such as wait times to measure delays in workflow stages and pinpoint where issues are accumulating. These metrics help teams identify areas in the process that require attention and improvement.
A Cumulative Flow Diagram (CFD) is a useful tool for visualizing WIP. CFDs show how work items move through different stages such as ‘To Do’, ‘In Progress’, ‘In Review’, and ‘Done’, helping teams monitor workflow progress and identify bottlenecks. If the CFD widens in a specific status, it indicates a bottleneck where work is accumulating.
Setting WIP limits: On JIRA Kanban boards, the development team can set WIP limits for each stage, like “In Progress” or “Review.” This helps the development team manage workload, prevents overloading, and maintains steady productivity without overwhelming team members.
Identifying bottlenecks: WIP metrics highlight bottlenecks in real time. If tasks accumulate in a specific stage (e.g., “In Review”), it signals a need to address delays, such as availability of reviewers or unclear review standards.
Using cumulative flow diagrams: JIRA’s cumulative flow diagrams visualize WIP across stages, showing where tasks are getting stuck and helping teams keep workflows balanced. WIP metrics in these diagrams also help track team performance by providing insights into workflow efficiency.
Planning plays a vital role in helping agile teams maintain a clear overview of how work is distributed, manage scope creep effectively, and keep track of dropped tasks. Breaking down planned work into Epics, Stories, and backlog items provides clarity on resource allocation and ensures all project components receive the right attention. Monitoring scope creep is essential to avoid timeline disruptions and resource overload; by tracking scope changes and their impact in JIRA, teams can make informed decisions to stay on course. Additionally, keeping an eye on dropped work allows teams to understand shifting priorities and adjust plans accordingly. This comprehensive planning approach helps maintain balanced workloads, supports sprint goals, and keeps projects aligned with overall objectives.
Epic and Story breakdown: Use JIRA to structure work hierarchically by creating Epics and breaking them down into Stories and backlog items. This helps visualize the scope and allocate resources effectively.
Scope change tracking: Leverage JIRA’s issue history and custom fields to monitor changes in scope during sprints or releases. Setting up alerts for scope modifications helps teams react promptly to potential scope creep.
Dropped work monitoring: Track tasks that are removed or deprioritized using JIRA filters and reports to understand shifting priorities and their impact on sprint goals.
Resource allocation dashboards: Configure dashboards displaying workload distribution across Epics and Stories to ensure balanced assignment and prevent overloading team members.
Sprint reports and burndown charts: Utilize sprint reports and sprint burndown charts within JIRA to monitor progress against planned work, helping teams stay on track with sprint goals and identify any deviations early.
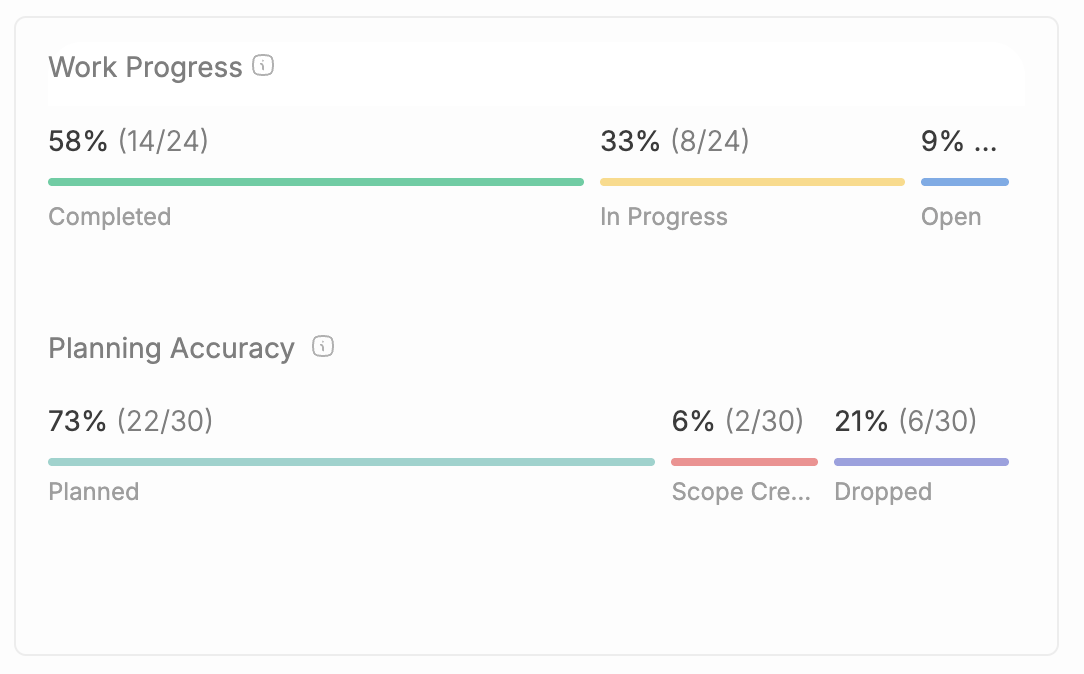
Developer Workload monitors the task volume and complexity assigned to each developer. By tracking developer workload, teams can use Jira metrics to analyze and improve the overall effectiveness of the team's work by moving beyond surface-level data to identify bottlenecks and root causes. Jira metrics provide actionable insights to measure and improve the team’s work, supporting greater productivity and efficiency. This metric ensures balanced workload distribution, preventing burnout and optimizing each developer’s capacity. Support tickets are also part of the workload that needs to be tracked and managed to ensure assignments remain balanced.
JIRA workload reports: Workload reports aggregate task counts, hours estimated, and priority levels for each developer. This helps project managers reallocate tasks if certain team members are overloaded. Additionally, tracking bug counts provides insight into the workload related to issue resolution and helps assess product quality over time.
Time tracking and estimation: JIRA allows developers to log actual time spent on tasks, making it possible to compare against estimates for improved workload planning. Tracking automated tests and their results is also important for monitoring software quality alongside workload.
Capacity-based assignment: Project managers can analyze workload data to assign tasks based on each developer’s availability and capacity, ensuring sustainable productivity.
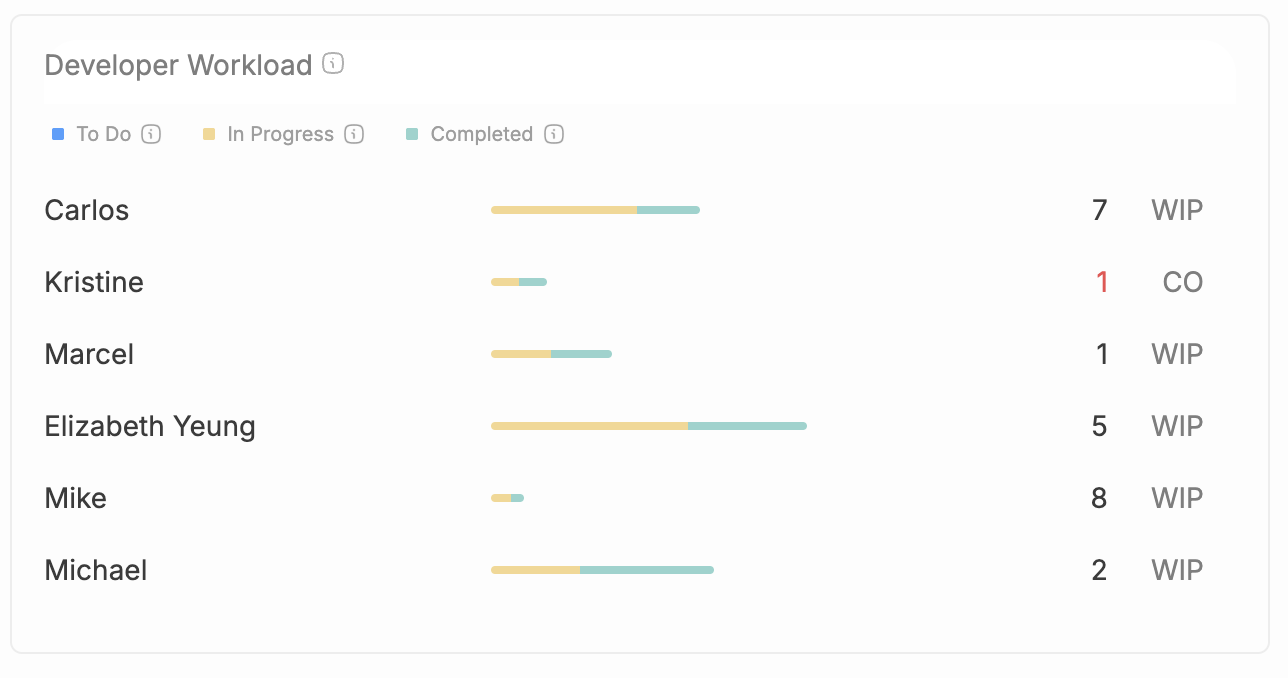
Team Velocity measures the average amount of work completed by scrum teams in each sprint, establishing a baseline for sprint planning and setting realistic goals. Velocity is the average amount of work a scrum team completes during a sprint, measured in either story points or hours. By tracking velocity and using tools like burndown charts, teams can effectively monitor and visualize the team's progress toward sprint goals in real-time. Average velocity is calculated over several sprints to guide planning and forecasting, helping teams predict future performance and improve accuracy in release planning.
Velocity chart: JIRA’s Velocity Chart displays work completed versus planned work, helping teams gauge their performance trends and establish realistic goals for future sprints. Velocity reports provide visual analytics of completed work over time, allowing teams to assess consistency and predictability in their delivery.
Estimating story points: Story points assigned to tasks allow teams to calculate velocity and capacity more accurately, improving sprint planning and goal setting.
Historical analysis for planning: Historical velocity data enables teams to look back at performance trends, helping identify factors that impacted past sprints and optimizing future planning

I.ssue Live Status is a crucial Jira metric that provides real-time visibility into where issues are currently stalled or progressing within your workflow stages, such as "In Progress," "In Development," "In QA," or any custom statuses defined in your issue tracker. By monitoring the live status of issues, teams can quickly identify bottlenecks and understand at which workflow stage work items are accumulating, enabling prompt intervention to maintain smooth delivery.
An essential aspect of Issue Live Status is the ageing graph, which visualizes how long issues have remained in a particular status. This helps teams detect stalled tasks and prioritize resolving blockers to prevent delays. Tracking issue ageing ensures that no task remains unattended for too long, improving overall workflow efficiency and predictability.
By integrating Issue Live Status monitoring into your Jira metrics strategy, teams gain actionable insights that drive continuous workflow optimization, reduce cycle times, and enhance delivery predictability.
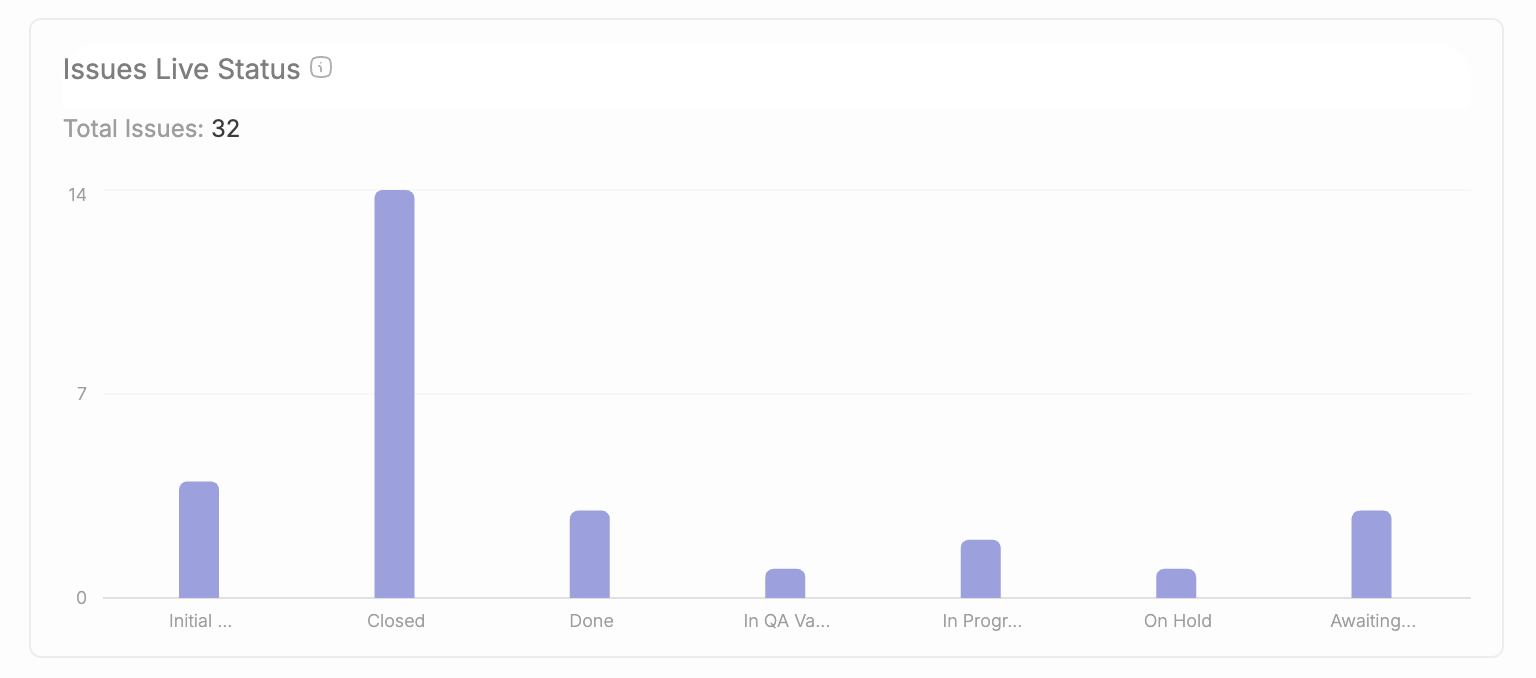
Cycle Time tracks how long tasks take from start to completion, highlighting process inefficiencies. In software development, Jira Software is widely used to track cycle time and other key jira metrics, providing teams with valuable insights into their workflow. Shorter cycle times generally mean faster delivery.
Lead Time is another important metric, measuring the total time from request to delivery. It helps teams identify overall process gaps, handoffs, and communication issues. Lead time measures the total time elapsed from the moment an issue is created until it is marked as fully completed.
Control chart: Jira's Control Chart report is a key jira metric for visualizing lead times for completed issues, displaying how long tasks spend in each stage and helping to identify where delays occur. Monitoring issue aging is also important to ensure that work keeps moving and nothing falls through the cracks.
Custom workflows and time tracking: Customizable workflows allow teams to assign specific time limits to each stage, identifying areas for improvement and reducing Cycle Time.
SLAs for timely completion: For teams with service-level agreements, setting cycle-time goals can help track SLA adherence, providing benchmarks for performance.
A Burndown Chart is a fundamental agile metric that visually represents the amount of work remaining in a sprint backlog over time. It helps agile teams monitor progress toward sprint goals by showing how quickly tasks are being completed and whether the team is on track to finish all planned work within the sprint duration. The chart typically plots time on the x-axis and remaining work (measured in story points, hours, or task count) on the y-axis, providing a clear, real-time overview of sprint progress.
Burndown charts are especially valuable for Scrum teams, enabling product owners, scrum masters, and development teams to identify scope creep, adjust workload, and forecast the likelihood of meeting sprint commitments. By analyzing the chart's slope and deviations, teams can detect potential bottlenecks early and take corrective actions to maintain steady progress.
By effectively leveraging burndown charts, agile teams gain actionable insights that improve sprint predictability, enhance transparency, and support continuous improvement in their delivery processes.
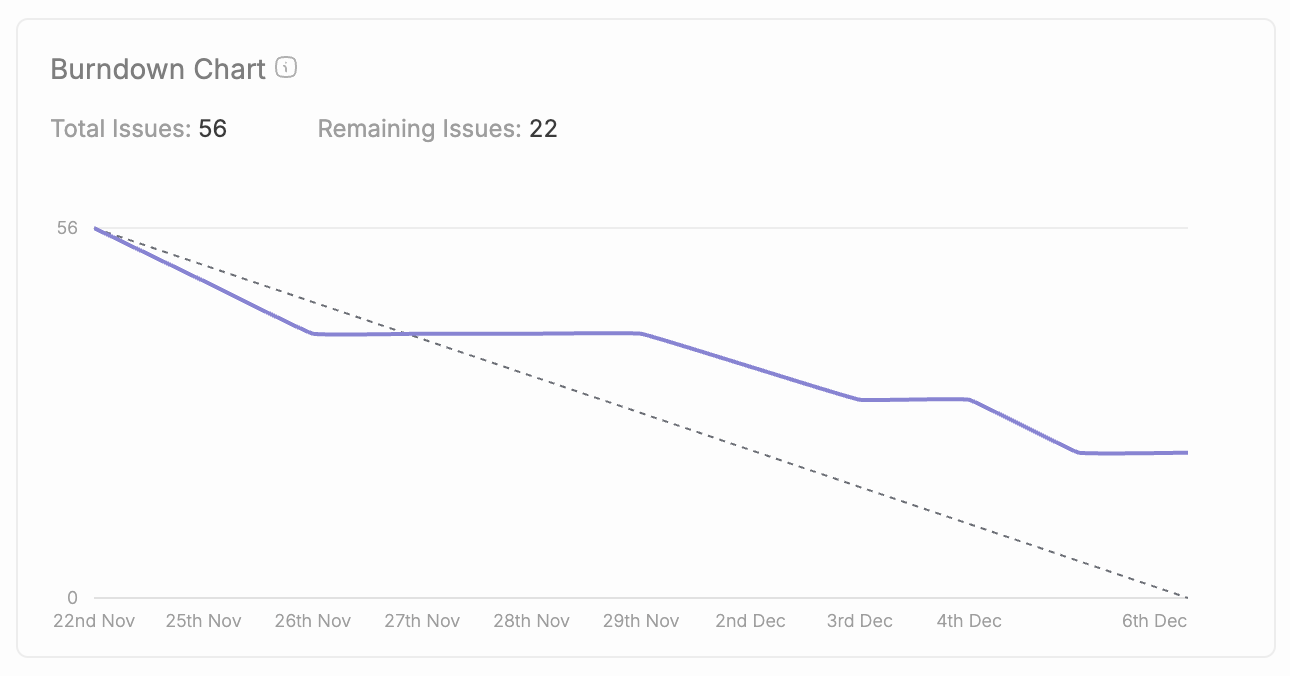
Cumulative Flow Diagrams (CFDs) represent a transformative agile metric that empowers teams to harness comprehensive insights into their workflow dynamics and operational efficiency. These sophisticated visualization tools elegantly capture the flow of work across distinct process stages—including backlog, in progress, review, and completion phases—while tracking temporal progressions with unprecedented clarity. By leveraging this advanced tracking methodology, agile teams can track progress and swiftly pinpoint bottlenecks and detect work accumulation patterns, whether they manifest in development cycles, review processes, or testing phases.
Analyzing cumulative flow patterns enables teams to orchestrate data-driven strategic decisions regarding resource optimization and process enhancement initiatives. When the “in progress” segment of the diagram exhibits sustained growth trajectories, it signals the necessity to investigate and remediate underlying systemic issues. This might encompass rebalancing team workload distribution, clarifying priority frameworks, or streamlining handoff mechanisms between sequential process stages to achieve optimal workflow efficiency.
CFDs also empower teams to maintain laser focus on sprint objectives by delivering comprehensive, visual intelligence regarding work progression through established processes. Through systematic cumulative flow analysis, teams can identify critical areas requiring intervention, ensure harmonized workflow distribution, and maintain project momentum on predetermined trajectories. Ultimately, CFDs transform teams’ capability to monitor progress, detect operational bottlenecks, and continuously refine their processes using real-time data intelligence that drives sustained performance improvements.
For engineering leaders who aim to establish and drive high-performance software delivery capabilities, DORA metrics provide a comprehensive, data-driven methodology for measuring, analyzing, and systematically improving software delivery processes. These four fundamental metrics—deployment frequency, lead time for changes, mean time to recovery (MTTR), and change failure rate (CFR)—collectively constitute a holistic framework that enables development organizations to gain unprecedented visibility into their team's operational effectiveness and delivery capabilities.
Through the systematic and consistent tracking of these comprehensive DORA metrics, engineering leaders gain the analytical capabilities necessary to identify specific optimization opportunities, such as streamlining lead time reduction initiatives or implementing strategies to increase deployment frequency cadence. This data-driven analytical approach facilitates evidence-based decision making processes, supports continuous improvement methodologies, and enables development teams to deliver high-quality software solutions with enhanced reliability and consistency. DORA metrics prove invaluable for engineering leaders who seek to systematically optimize team performance outcomes and ensure strategic alignment with broader organizational business objectives and operational goals.
To optimize the strategic value derived from JIRA metrics implementation, agile development teams must establish a comprehensive framework of sophisticated practices that ensure precision in data collection, meaningful analytical insights, and actionable outcomes that drive organizational efficiency. How can teams achieve this level of sophistication? Tracking relevant metrics, such as defect data, helps teams monitor defect trends, improve code quality, and prioritize testing and process improvements. The foundation lies in leveraging automated data aggregation mechanisms for critical performance indicators—including lead time calculations, cycle time measurements, and defect density tracking—through JIRA’s native automation capabilities and integrated testing frameworks. This systematic approach eliminates manual data collection overhead while maintaining real-time data integrity and ensuring continuous availability of accurate performance metrics.
The strategic utilization of velocity reporting mechanisms serves as a cornerstone for informed sprint planning methodologies and establishes realistic performance benchmarks derived from comprehensive historical performance analysis. These analytical reports provide development teams with deep insights into their delivery throughput patterns and enable sophisticated adjustments to future sprint configurations for optimal resource allocation and outcome optimization. Similarly, the continuous monitoring of cumulative flow diagram analytics proves equally critical, as these visualization tools deliver comprehensive overviews of work distribution patterns across development pipelines and facilitate real-time identification of process bottlenecks and workflow inefficiencies.
Continuous process improvement methodologies should constitute the fundamental core of your metrics-driven strategy framework. How does this translate into practical implementation? Organizations must establish regular analytical review cycles for key performance indicators and leverage the derived insights to systematically refine development processes, address operational inefficiencies, and celebrate milestone achievements. The integration of DORA metrics frameworks—encompassing deployment frequency analytics and lead time optimization—can significantly enhance organizational understanding of software delivery performance characteristics and support sophisticated data-driven decision-making processes across development lifecycles.
Through the systematic implementation of these advanced practices, development teams can effectively transform raw performance data into valuable strategic insights, facilitate informed decision-making processes, and cultivate a culture of continuous improvement that maintains project trajectory alignment and ensures teams operate at peak performance levels across all development phases.
Effectively setting up and using JIRA metrics requires strategic configuration and the right tools to turn raw data into actionable insights. Here's a practical, step-by-step guide to configuring these metrics in JIRA for optimal tracking and collaboration. With Typo's integration, teams gain additional capabilities for managing, analyzing, and discussing metrics collaboratively.
Setting up dashboards in JIRA for metrics like Cycle Time, Developer Workload, and Team Velocity allows for quick access to critical data.
How to set up:
Typo’s sprint analysis offers an in-depth view of your team’s progress throughout a sprint, enabling engineering managers and developers to better understand performance trends, spot blockers, and refine future planning. Typo integrates seamlessly with JIRA sprint insights to provide real-time sprint insights, including data on team velocity, task distribution, and completion rates.
Key features of Typo’s sprint analysis:
Detailed sprint performance summaries: Typo automatically generates sprint performance summaries, giving teams a clear view of completed tasks, WIP, and uncompleted items.
Sprint progress tracking: Typo visualizes your team’s progress across each sprint phase, making it easy to monitor how the team is advancing toward sprint goals and quickly identify any impediments or bottlenecks. Sprint burndown charts are used to visualize the team's progress and the amount of work remaining in the sprint backlog over time, providing transparency and helping teams stay on track.
Velocity trend analysis: Track velocity over multiple sprints to understand performance patterns. Typo’s charts display average, maximum, and minimum velocities, helping teams make data-backed decisions for future sprint planning.
Typo enables engineering teams to go beyond JIRA’s native reporting by offering customizable reports. These reports allow teams to focus on specific metrics that matter most to them, creating targeted views that support sprint retrospectives and help track ongoing improvements.
Key benefits of Typo reports:
Customized metrics views: Typo’s reporting feature allows you to tailor reports by sprint, team member, or task type, enabling you to create a focused analysis that meets team objectives. These customized reports can also help teams predict and manage project timelines more accurately. One example is a custom dashboard that visualizes project predictability by tracking sprint velocity and scope changes over time, helping teams identify patterns and improve future planning.
Sprint performance comparison: Easily compare current sprint performance with past sprints to understand progress trends and potential areas for optimization.
Collaborative insights: Typo’s centralized platform allows team members to add comments and insights directly into reports, facilitating discussion and shared understanding of sprint outcomes.
Typo's Velocity Trend Analysis provides a comprehensive view of team capacity and productivity over multiple sprints, allowing managers to set realistic goals and adjust plans according to past performance data.
How to use:
Setting up automated alerts in JIRA and Typo helps teams stay on top of metrics without manual checking, ensuring that critical changes are visible in real-time.
How to set up:
Typo’s integration makes retrospectives more effective by offering a shared space for reviewing metrics and discussing improvement opportunities as a team, including metrics related to customer satisfaction.
How to use:
Read more: Moving beyond JIRA Sprint Reports
Scope creep - when a project’s scope expands beyond its original objectives—can disrupt project timelines, strain resources, and lead to project overruns. Monitoring scope creep is essential for agile teams that need to stay on track without sacrificing quality. The impact of scope creep may also vary depending on the team's specific goals and project type.
In JIRA, tracking scope creep involves setting clear boundaries for task assignments, monitoring changes, and evaluating their impact on team workload and sprint goals.
By closely monitoring and managing scope creep, agile teams can keep their projects within boundaries, maintain productivity, and make adjustments only when they align with strategic objectives.
JIRA stands as a transformative catalyst that reshapes agile team workflows far beyond conventional project management boundaries. By leveraging systematic tracking of critical metrics like cycle time, lead time, bug counts, and specifically how many defects are identified during and after development, teams can dive into vast datasets to uncover actionable trends and patterns that reveal unprecedented opportunities for process optimization. Tracking how many defects occur provides valuable insight into software development performance and helps assess the effectiveness of quality assurance processes. When lead time metrics demonstrate consistent increases across multiple sprint cycles, this signals potential bottlenecks that demand immediate strategic intervention and resource reallocation.
This data-driven analysis empowers teams to pinpoint specific optimization targets, whether streamlining handoff processes, facilitating dynamic resource redistribution, or refining workflow architectures for enhanced efficiency. JIRA’s comprehensive reporting capabilities automate progress monitoring toward planned release milestones, ensuring teams maintain strategic alignment with project timelines while generating actionable insights that guide focused effort allocation and decision-making processes.
Continuous improvement thrives through AI-enhanced commitment to regularly analyze and act on performance metrics that drive operational excellence. By harnessing JIRA’s advanced tracking capabilities to monitor progress trajectories, analyze emerging trends, and dynamically adjust strategic approaches, teams can optimize their workflows, deliver superior-quality products, and exceed customer expectations consistently. This intelligent, data-driven methodology not only supports sustainable organizational growth but also empowers teams to adapt swiftly within dynamic development environments that demand agility and precision.
While JIRA metrics serve as sophisticated analytics instruments that unlock comprehensive insights into team performance dynamics, development teams frequently encounter multifaceted implementation challenges that require systematic analysis and strategic resolution. The primary obstacle involves establishing robust data integrity frameworks that ensure metric accuracy and reliability across complex development workflows. This necessitates meticulous configuration of workflow schemas, custom field mappings, and user interface screens, coupled with comprehensive data validation protocols that guarantee the tracked information authentically represents the team's development lifecycle activities. Organizations must implement stringent data governance practices, including automated validation rules, field dependency configurations, and workflow transition validations that maintain data consistency across different project contexts and team structures.
Another prevalent challenge emerges from metric proliferation—the systematic tracking of excessive performance indicators creates analytical paralysis and diminishes strategic focus, making it increasingly difficult to identify critical performance drivers and actionable insights. To mitigate this complexity, development teams should implement focused metric frameworks that concentrate on strategically aligned key performance indicators, utilizing data-driven approaches to select metrics that directly correlate with organizational objectives and facilitate continuous improvement methodologies. This approach requires comprehensive team capability development, ensuring that team members possess advanced analytical skills to interpret complex metric patterns, derive meaningful insights from performance data, and leverage these analytics for informed decision-making processes rather than merely accumulating data repositories without strategic purpose.
By implementing focused metric selection strategies and utilizing comprehensive analytics frameworks to guide actionable performance improvements, development teams can systematically overcome these implementation challenges and transform JIRA metrics into sophisticated performance intelligence systems that drive measurable progress and organizational excellence. This transformation requires continuous monitoring of metric effectiveness, regular calibration of measurement approaches, and adaptive refinement of analytical processes to ensure sustained value delivery and strategic alignment with evolving organizational objectives.
Building a data-driven culture goes beyond tracking metrics; it's about engaging the entire team in understanding and applying these insights to support shared goals. By fostering collaboration and using metrics as a foundation for continuous improvement, teams can align more effectively and adapt to challenges with agility.
Regularly revisiting and refining metrics ensures they stay relevant and actionable as team priorities evolve. To see how Typo can help you create a streamlined, data-driven approach, schedule a personalized demo today and unlock your team's full potential.
JIRA metrics constitute a fundamental framework that empowers agile development teams to systematically analyze performance patterns, optimize workflow efficiency, and achieve strategic project objectives through data-driven methodologies. By diving into critical performance indicators such as cycle time analysis, lead time optimization, and velocity measurements, development teams gain unprecedented insights into their operational workflows, enabling them to implement evidence-based decisions that facilitate systematic process enhancement and continuous improvement cycles. These sophisticated metrics serve as powerful analytical tools that enable teams to identify workflow bottlenecks, streamline development processes, and maintain precise tracking mechanisms for monitoring progress toward sprint deliverables and comprehensive project milestones.
Nevertheless, development teams must navigate carefully around prevalent implementation challenges, including metric saturation scenarios and data integrity inconsistencies that can compromise analytical accuracy. By strategically focusing on a carefully curated selection of key performance indicators and leveraging these metrics to guide informed decision-making processes, agile teams can effectively transform raw performance data into actionable strategic momentum that drives operational excellence. Whether you function as a scrum master orchestrating team dynamics, a product owner defining strategic direction, or an engineering leader managing technical implementation, effectively leveraging JIRA metrics through systematic analysis will enable your development team to deliver superior software solutions with enhanced speed and reliability, while fostering an organizational culture centered on continuous improvement and operational optimization.
To comprehensively enhance your organization's proficiency in JIRA metrics implementation and optimization, a robust ecosystem of advanced resources and analytical tools is strategically available across multiple domains. Atlassian's comprehensive official documentation repository and structured learning modules provide systematic, step-by-step implementation guides for configuring JIRA's advanced reporting infrastructure and leveraging its sophisticated analytics capabilities for continuous process improvement and performance optimization. Enterprise-grade third-party integrations and specialized plugins significantly extend JIRA's native analytical capabilities, delivering advanced data visualization, real-time performance insights, predictive analytics, and customized dashboard configurations specifically tailored to address your development team's unique operational requirements and KPI tracking objectives.
Strategic engagement with specialized online communities and professional networks, particularly the Atlassian Community ecosystem and industry-specific user groups, enables development teams to systematically exchange proven methodologies, collaborate on complex technical challenges, and assimilate lessons learned from other agile development organizations' implementation experiences and performance metrics. By strategically leveraging these comprehensive resource networks and knowledge-sharing platforms, your development organization can systematically deepen its technical expertise, maintain alignment with emerging trends in agile project management methodologies, and maximize the operational impact and ROI of your metrics-driven development approach through data-informed decision-making processes.
Cumulative flow algorithms and issue count metrics serve as foundational analytical systems in agile development environments, delivering comprehensive workflow intelligence and throughput optimization capabilities to development teams. By implementing cumulative flow visualization systems, engineering teams can algorithmically monitor task progression across defined workflow states—including backlog repositories, active development queues, and completion stages—throughout project execution cycles. These analytical frameworks not only facilitate performance tracking mechanisms but also generate predictive insights regarding work accumulation patterns, enabling systematic identification of process bottlenecks that may compromise delivery velocity and system throughput.
Implementing issue count monitoring systems alongside cumulative flow analytics enables development teams to quantify task ingress and egress rates across individual workflow stages with mathematical precision. Anomalous spikes in issue count distributions at specific workflow nodes indicate potential process bottlenecks, triggering automated investigation protocols and systematic root cause analysis procedures. This data-driven methodology empowers engineering teams to execute informed resource allocation strategies, implement workflow configuration adjustments, and deploy process optimization algorithms, all of which represent critical components for sustaining high-performance development operations and maintaining optimal system throughput.
Through consistent monitoring of these analytical metrics, agile development teams can detect performance trends, predict workflow degradation patterns, and implement targeted optimization algorithms to enhance process efficiency. The resulting system delivers enhanced delivery pipeline predictability and operational efficiency, enabling development teams to achieve project execution objectives and deliver stakeholder value with improved reliability metrics. Ultimately, cumulative flow analytics and issue count monitoring systems function as essential technological components for any development organization committed to continuous process improvement and high-performance software delivery execution.

Think of reading a book with multiple plot twists and branching storylines. While engaging, it can also be confusing and overwhelming when there are too many paths to follow. Just as a complex storyline can confuse readers, high Cyclic Complexity can make code hard to understand, maintain, and test, leading to bugs and errors.
In this blog, we will discuss why high cyclomatic complexity can be problematic and ways to reduce it.
Cyclomatic Complexity, a software metric, was developed by Thomas J. Mccabe in 1976. It is a metric that indicates the complexity of a program by counting its decision points and helps measure the overall complexity of a program. Every decision point in the code increases the cyclomatic complexity by one, making it a useful tool for understanding the intricacy of control flow.
A higher cyclomatic Complexity score reflects more execution paths, leading to increased complexity. On the other hand, a low score signifies fewer paths and, hence, less complexity. A cyclomatic complexity score greater than 10 typically suggests that the code may be too complex and could benefit from refactoring.
Cyclomatic Complexity is calculated using a control flow graph constructed from the program's source code:
M = E - N + 2P
M = Cyclomatic Complexity
N = Nodes (Block of code)
E = Edges (Flow of control)
P = Number of Connected Components
To calculate cyclomatic complexity, you can manually count the nodes, edges, and connected components in the control flow graph and apply the formula above, or use automated tools that analyze the program's source code to determine the complexity score.
Code complexity defines the challenge level software teams encounter when analyzing, testing, and maintaining application components. Within software development workflows, elevated code complexity streamlines can significantly hinder project velocity, amplify defect introduction rates, and escalate long-term maintenance expenditures. Leveraging widely-adopted software quality metrics for evaluating code complexity, cyclomatic complexity stands out as a fundamental assessment tool. This metric analyzes the total count of linearly independent execution paths traversing a program's source code, delivering quantitative insights into control flow intricacy levels. While cyclomatic complexity is a key metric, other measures like Lines of Code (LoC) provide a basic measure of size but do not fully capture the intricacies of code complexity. Calculating cyclomatic complexity involves constructing control flow graphs that visually map diverse pathways and decision nodes embedded within the codebase architecture. By continuously monitoring code complexity patterns and utilizing metrics like cyclomatic complexity, development teams can proactively optimize technical debt management, enhance code quality standards, and ensure their software applications remain robust and maintainable—even as system scale and functionality requirements evolve.
Let’s delve into the concept of cyclomatic complexity with an easy-to-grasp illustration.
Imagine a function structured as follows:
function greetUser(name) {
print(`Hello, ${name}!`);
}
In this case, the function is straightforward, containing a single line of code. Since there are no conditional code paths, the cyclomatic complexity is 1—indicating a single, linear path of execution.
Now, let’s add a twist:
function greetUser(name, offerFarewell = false) {
	print(`Hello, ${name}!`);
		if (offerFarewell) {
	print(`Goodbye, ${name}!`);
	}
}
In this modified version, we’ve introduced a conditional statement. The use of the if statement introduces additional code paths, as the function can now execute in more than one way. It presents us with multiple paths through the code:
By adding this decision point, the cyclomatic complexity increases to 2. This means there are multiple code paths the function might execute, depending on the value of the offerFarewell parameter. Even simple functions can develop complex logic as more conditions are added.
Key Takeaway: Cyclomatic complexity helps in understanding how many independent code paths there are through a function, aiding in assessing the possible scenarios a program can take during its execution. This is crucial for debugging and testing, ensuring each path is covered.
Leveraging cyclomatic complexity calculations transforms how development teams understand and optimize their codebase intricacy. The proven formula M = E - N + 2P streamlines complexity measurement, where M represents the cyclomatic complexity metric, E captures the edges within the control flow graph, N defines the total nodes, and P identifies connected components throughout the system. This powerful calculation revolutionizes code analysis by revealing independent pathways and decision points that exist within programs, pinpointing areas where complexity may hinder development velocity. Elevated cyclomatic complexity often signals the presence of intricate code segments that challenge testing efficiency, debugging workflows, and long-term maintainability. By consistently measuring and monitoring cyclomatic complexity, development teams can strategically identify which codebase segments would benefit from targeted refactoring initiatives, ultimately streamlining complexity and enhancing overall code maintainability. Harnessing automated tools to calculate and continuously monitor complexity ensures that software architectures remain robust, reliable, and positioned to evolve efficiently over time.
The more complex the code is, the more the chances of bugs. When there are many possible paths and conditions, developers may overlook certain conditions or edge cases during testing. This leads to defects in the software and becomes challenging to test all of them.
Cyclomatic complexity plays a crucial role in determining how we approach testing. By calculating the cyclomatic complexity of a function, developers can ascertain the minimum number of test cases required to achieve full branch coverage. This metric is invaluable, as it predicts the difficulty of testing a particular piece of code.
Higher values of cyclomatic complexity necessitate a greater number of test cases to comprehensively cover a block of code, such as a function. This means that as complexity increases, so does the effort needed to ensure the code is thoroughly tested. For developers looking to streamline their testing process, reducing cyclomatic complexity can greatly ease this burden, making the code not only less error-prone but also more efficient to work with.
Cognitive complexity refers to the level of difficulty in understanding a piece of code. High maintainability index scores typically indicate that the code is easier to maintain, while low scores suggest areas that may require refactoring.
Cyclomatic Complexity is one of the factors that increases cognitive complexity. Since, it becomes overwhelming to process information effectively for developers, which makes it harder to understand the overall logic of code.
Codebases with high cyclomatic Complexity make onboarding difficult for new developers or team members. The learning curve becomes steeper for them and they require more time and effort to understand and become productive. This also leads to misunderstanding and they may misinterpret the logic or overlook critical paths.
More complex code leads to more misunderstandings, which further results in higher defects in the codebase. Complex code is more prone to errors as it hinders adherence to coding standards and best practices.
Due to the complex codebase, the software development team may struggle to grasp the full impact of their changes which results in new errors. This further slows down the process. It also results in ripple effects i.e. difficulty in isolating changes as one modification can impact multiple areas of application.
To truly understand the health of a codebase, relying solely on cyclomatic complexity is insufficient. While cyclomatic complexity provides valuable insights into the intricacy and potential risk areas of your code, it's just one piece of a much larger puzzle.
Here's why multiple metrics matter:
In short, utilizing a diverse range of metrics provides a more accurate and actionable picture of codebase health, supporting sustainable development and more effective project management.
The primary goal in minimizing cyclomatic complexity is to simplify control flow and reduce the number of decision points in a function.
Simplifying control structures such as if statements and loops is key to reducing code complexity and improving maintainability. Effective strategies to reduce cyclomatic complexity include refactoring large functions into smaller, single-purpose functions and simplifying conditional statements.
Object oriented programming enables the use of design patterns to reduce cyclomatic complexity by replacing complex decision structures with more maintainable code.

Eliminating redundant code represents a transformative approach to reducing software complexity and enhancing codebase maintainability. Duplicate code blocks—segments that execute identical or nearly identical functions—can rapidly escalate the total lines of code, making the software architecture more challenging to comprehend, navigate, and modify. This redundancy not only amplifies cognitive overhead for development teams but also elevates the probability of inconsistencies and system vulnerabilities when modifications are implemented. To address this challenge, development teams should extract repetitive logic into reusable functions or methods, implement proven architectural patterns, and maintain adherence to established coding standards. AI-powered tools and machine learning algorithms can identify duplicate code patterns, streamlining the development workflow and ensuring that the codebase remains optimized and efficient. By minimizing code redundancy, development teams can significantly reduce complexity, enhance software quality, and make future feature implementations substantially more manageable and scalable.
Eliminating dead code constitutes a fundamental practice for controlling software complexity and sustaining a robust, maintainable codebase that facilitates long-term project success. Dead code comprises any executable segments that remain unreachable during runtime or whose computational results never contribute to application functionality, thereby unnecessarily expanding project scope and architectural complexity. This unutilized code obscures primary business logic pathways, creating cognitive overhead that impedes developer comprehension and hampers efficient maintenance workflows throughout the software lifecycle. Systematic code reviews, sophisticated static analysis methodologies, and comprehensive testing strategies serve as effective mechanisms for identifying and purging these redundant code segments from production systems. Through meticulous cleanup of these unused sections, development teams can substantially reduce unnecessary architectural complexity, minimize technical debt accumulation, and enhance code modularity and reusability across project components. Ultimately, the strategic elimination of dead code not only streamlines the overall codebase architecture but also amplifies software quality metrics, maintainability indices, and long-term project sustainability while enabling more efficient resource allocation and accelerated development cycles.
Implementing code reviews transforms software development practices and serves as a strategic approach for systematically reducing code complexity across development workflows. Through collaborative examination processes, development teams analyze each other's implementations to ensure adherence to established coding standards, eliminate unnecessary complexity layers, and maintain elevated code quality benchmarks. This collaborative methodology enables teams to identify intricate code segments, redundant implementations, and obsolete code structures before they become deeply integrated within the codebase architecture. Regular review cycles foster comprehensive knowledge transfer, enhance individual coding capabilities, and establish consistency patterns throughout development teams. Automated review platforms further augment these processes by detecting issues such as elevated cyclomatic complexity metrics and recommending optimization strategies. By integrating code reviews as fundamental components of development workflows, teams proactively minimize complexity overhead, strengthen maintainability frameworks, and deliver increasingly reliable software solutions.
To further limit duplicated code and reduce cyclomatic complexity, consider these additional strategies:
By implementing these strategies, you can effectively manage code complexity and maintain a cleaner, more efficient codebase. However, keep in mind that low cyclomatic complexity alone does not always guarantee maintainable code—other factors such as code readability, documentation, and modularity should also be considered.
Typo's code review tool identifies issues in your code and auto-fixes them before you merge to master using AI suggestions as well as static code analysis. This means less time reviewing and more time for important tasks. It keeps your code error-free, making the whole process faster and smoother.
The cyclomatic complexity metric is critical in software engineering. Reducing cyclomatic complexity increases the code maintainability, readability, and simplicity, and can positively impact cycle time in software development. By implementing the above-mentioned strategies, software engineering teams can reduce complexity and create a more streamlined codebase. Tools like Typo's automated code review also help in identifying complexity issues early and providing quick fixes. Hence, enhancing overall code quality.

Burndown charts are essential instruments for tracking the progress of agile teams. They are simple and effective ways to determine whether the team is on track or falling behind. However, there may be times when a burndown chart is not ideal for teams, as it may not capture a holistic view of the agile team’s progress.
In this blog, we have discussed the latter part in greater detail.
Burndown Chart is a visual representation of the team’s progress used for agile project management. They are useful for scrum teams and agile project managers to assess whether the project is on track or not.
The primary objective is to accurately depict the time allocations and plan for future resources.
In agile and scrum environments, burndown charts are essential tools that offer more than just a snapshot of progress. Here’s how they are effectively used:
Burndown charts not only provide transparency in tracking work but also empower agile teams to make informed decisions swiftly, ensuring project goals are met efficiently.


A burndown chart is an invaluable resource for agile project management teams, offering a clear snapshot of project progress and aiding in efficient workflow management. Here’s how it facilitates team success:
Overall, a burndown chart simplifies the complexities of agile project management, enhancing both team efficiency and project outcomes.
There are two axes: x and y. The horizontal axis represents the time or iteration and the vertical axis displays user story points.
It represents the remaining work that an agile team has at a specific point of the project or sprint under an ideal condition.
It is a realistic indication of a team's progress that is updated in real time. When this line is consistently below the ideal line, it indicates the team is ahead of schedule. When the line is above, it means they are falling behind.
It indicates whether the team has completed a project/sprint on time, behind or ahead of schedule.
The data points on the actual work remaining line represents the amount of work left at specific intervals i.e. daily updates.
A burndown chart is a visual tool used to track the progress of work in a project or sprint. Here's how you can read it effectively:
In summary, by regularly comparing the actual and ideal lines, you can assess whether your project is on track, falling behind, or advancing quicker than planned. This helps teams make informed decisions and adjustments to meet deadlines efficiently.
There are two types of Burndown Chart:
This type of burndown chart focuses on the big picture and visualises the entire project. It helps project managers and teams monitor the completion of work across multiple sprints and iteration.
Sprint Burndown chart particularly tracks the remaining work within a sprint. It indicates progress towards completing the sprint backlog.
Burndown Chart captures how much work is completed and how much is left. It allows the agile team to compare the actual progress with the ideal progress line to track if they are ahead or behind the schedule.
Burndown Chart motivates teams to align their progress with the ideal line. These small milestones boost morale and keep their motivation high throughout the sprint. It also reinforces the sense of achievement when they see their tasks completed on time.
It helps in analyzing performance over sprint during retrospection. Agile teams can review past data through burndown Charts to identify patterns, adjust future estimates, and refine processes for improved efficiency. It allows them to pinpoint periods where progress went down and help to uncover blockers that need to be addressed.
Burndown Chart visualizes the direct comparison of planned work and actual progress. It can quickly assess whether a team is on track to meet the goals, and monitor trends or recurring issues such as over-committing or underestimating tasks.
While the Burndown Chart comes with lots of pros, it could be misleading as well. It focuses solely on the task alone without accounting for individual developer productivity. It ignores the aspects of agile software development such as code quality, team collaboration, and problem-solving.
Burndown Chart doesn’t explain how the task impacted the developer productivity or the fluctuations due to various factors such as team morale, external dependencies, or unexpected challenges. It also doesn’t focus on work quality which results in unaddressed underlying issues.
The effectiveness of a burndown chart largely hinges on the precision of initial time estimates for tasks. These estimates shape the 'ideal work line,' a crucial component of the chart. When these estimates are accurate, they set a reliable benchmark against which actual progress is measured.
To address these issues, teams can introduce an efficiency factor into their calculations. After completing an initial project cycle, recalibrating this factor helps refine future estimates for more accurate tracking. This adjustment can lead to more realistic expectations and better project management.
By continually adjusting and learning from previous estimates, teams can improve their forecasting accuracy, resulting in more reliable burndown charts.
While the Burndown Chart is a visual representation of Agile teams’ progress, it fails to capture the intricate layers and interdependencies within the project. It overlooks the critical factors that influence project outcomes which may lead to misinformed decisions and unrealistic expectations.
Scope Creep refers to modification in the project requirement such as adding new features or altering existing tasks. Burndown Chart doesn’t take note of the same rather shows a flat line or even a decline in progress which can signify that the team is underperforming, however, that’s not the actual case. This leads to misinterpretation of the team’s progress and overall project health.
Burndown Chart doesn’t differentiate between easy and difficult tasks. It considers all of the tasks equal, regardless of their size, complexity, or effort required. Whether the task is on priority or less impactful, it treats every task as the same. Hence, obscuring insights into what truly matters for the project's success.
Burndown Chart treats team members equally. It doesn't take individual contributions into consideration as well as other factors including personal challenges. It also neglects how well they are working with each other, sharing knowledge, or supporting each other in completing tasks.
To ensure projects are delivered on time and within budget, project managers need to leverage a combination of effective planning, monitoring, and communication tools. Here’s how:
1. Utilize Advanced Project Management Tools
Integrating digital tools can significantly enhance project monitoring. For example, platforms like Microsoft Project or Trello offer real-time dashboards that enable managers to track progress and allocate resources efficiently. These tools often feature interactive Gantt charts, which streamline scheduling and enhance team collaboration.
2. Implement Burndown Charts
Burndown charts are invaluable for visualizing work remaining versus time. By regularly updating these charts, managers can quickly spot potential delays and bottlenecks, allowing them to adjust plans proactively.
3. Conduct Regular Meetings and Updates
Scheduled meetings provide consistent check-in times to address issues, realign goals, and ensure everyone is on the same page. This fosters transparency and keeps the team aligned with project objectives, minimizing miscommunications and errors.
4. Foster Effective Communication Channels
Utilizing platforms like Slack or Microsoft Teams ensures quick and efficient communication among team members. A clear communication strategy minimizes misunderstandings and accelerates decision-making, keeping projects on track.
5. Prioritize Risk Management
Anticipating potential risks and having contingency plans in place is crucial. Regular risk assessments can identify potential obstacles early, offering time to devise strategies to mitigate them.
By combining these approaches, project managers can increase the likelihood of delivering projects on time and within budget, ensuring project success and stakeholder satisfaction.
To enhance sprint management, it's crucial to utilize a variety of tools and reports. While burndown charts are fundamental, other tools can offer complementary insights and improve project efficiency.
Gantt Charts are ideal for complex projects. They are a visual representation of a project schedule using horizontal axes. They provide a clear timeline for each task, indicating when the project starts and ends, as well as understanding overlapping tasks and dependencies between them. This comprehensive view helps teams manage long-term projects alongside sprint-focused tools like burndown charts.
CFD visualizes how work moves through different stages. It offers insight into workflow status and identifies trends and bottlenecks. It also helps in measuring key metrics such as cycle time and throughput. By providing a broader perspective of workflow efficiency, CFDs complement burndown charts by pinpointing areas for process improvement.
Kanban Boards is an agile management tool that is best for ongoing work. It helps to visualize work, limit work in progress, and manage workflows. They can easily accommodate changes in project scope without the need for adjusting timelines. With their ability to visualize workflows and prioritize tasks, Kanban boards ensure teams know what to work on and when, enhancing the detailed task management that burndown charts provide.
Burnup Chart is a quick, easy way to plot work schedules on two lines along a vertical axis. It shows how much work has been done and the total scope of the project, hence, providing a clearer picture of project completion.
While both burnup and burndown charts serve the purpose of tracking progress in agile project management, they do so in distinct ways.
Similar Components, Different Actions:
This duality in approach allows teams to choose the chart that best suits their need for visualizing project trajectory. The burnup chart, by displaying both completed work and total project scope, provides a comprehensive view of how close a team is to reaching project goals.
DI platforms like Typo focus on how smooth and satisfying a developer experience is. They streamline the development process and offer a holistic view of team productivity, code quality, and developer satisfaction. These platforms provide real-time insights into various metrics that reflect the team’s overall health and efficiency beyond task completion alone. By capturing a wide array of performance indicators, they supplement burndown charts with deeper insights into team dynamics and project health.
Incorporating these tools alongside burndown charts can provide a more rounded picture of project progress, enhancing both day-to-day management and long-term strategic planning.
In the dynamic world of project management, real-time dashboards and Kanban boards play crucial roles in ensuring that teams remain efficient and informed.
Real-time dashboards act as the heartbeat of project management. They provide a comprehensive, up-to-the-minute overview of ongoing tasks and milestones. This feature allows project teams to:
Essentially, real-time dashboards empower teams with the data they need right when they need it, facilitating proactive management and quick responses to any project deviations.
Kanban boards are pivotal for visualizing workflows and managing tasks efficiently. They:
By making workflows visible and manageable, Kanban boards foster better collaboration and continuous process improvement. They become a valuable archive for reviewing past sprints, helping teams identify successes and areas for enhancement.
In conclusion, both real-time dashboards and Kanban boards are integral to effective project management. They ensure that teams are always aligned with objectives, enhancing transparency and facilitating a smooth, agile workflow.
One such platform is Typo, which goes beyond the traditional metrics. Its sprint analysis is an essential tool for any team using an agile development methodology. It allows agile teams to monitor and assess progress across the sprint timeline, providing visual insights into completed work, ongoing tasks, and remaining time. This visual representation allows to spot potential issues early and make timely adjustments.
Our sprint analysis feature leverages data from Git and issue management tools to focus on team workflows. They can track task durations, identify frequent blockers, and pinpoint bottlenecks.

With easy integration into existing Git and Jira/Linear/Clickup workflows, Typo offers:
Hence, helping agile teams stay on track, optimize processes, and deliver quality results efficiently.
While the burndown chart is a valuable tool for visualizing task completion and tracking progress, it often overlooks critical aspects like team morale, collaboration, code quality, and factors impacting developer productivity. There are several alternatives to the burndown chart, with Typo’s sprint analysis tool standing out as a powerful option. Through this, agile teams gain a more comprehensive view of progress, fostering resilience, motivation, and peak performance.

One of the biggest hurdles in a DevOps transformation is not the technical implementation of tools but aligning the human side—culture, collaboration, and incentives. As a leader, it’s essential to recognize that different, sometimes conflicting, objectives drive both Software Engineering and Operations teams.
The DevOps movement began around 2007 as a response to the traditional software development model that separated developers and operations, aiming to bridge the gap and improve delivery.
Engineering often views success as delivering features quickly, whereas Operations focuses on minimizing downtime and maintaining stability. These differing incentives naturally create friction, resulting in delayed deployment cycles, subpar product quality, and even a toxic work environment. Habits are hard to break, and teams entrenched in siloed ways of working can struggle with, or even be resistant to, overhauling team structures to embrace DevOps practices.
The key to solving this? Cross-functional team alignment.
Before implementing DORA metrics, you need to ensure both teams share a unified vision: delivering high-quality software at speed, with a shared understanding of responsibility. Organizations adopting DevOps must evaluate and possibly change or remove existing teams, tools, or processes to support this alignment. This requires fostering an environment of continuous communication and trust, where both teams collaborate to achieve overarching business goals, not just individual metrics. Improved collaboration is a foundational element of DevOps, leading to increased efficiency, faster delivery, and a culture of shared responsibility and accountability.
Adopting DevOps and building a DevOps culture encourages experimentation and views failure as a natural part of learning and improving. A DevOps culture brings numerous benefits to an organization, notably in operational efficiency, faster delivery of features, and improved product quality.
Traditional performance metrics, often focused on specific teams (like uptime for Operations or feature count for Engineering), incentivize siloed thinking and can lead to metric manipulation. Operations might delay deployments to maintain uptime, while Engineering rushes features without considering quality. In response to these limitations, a defined DevOps methodology has emerged—a clear and structured approach that unites development and operations teams to deliver software faster, more securely, and more efficiently than traditional processes. To ensure the success of such an approach, tracking key DevOps metrics is crucial for identifying bottlenecks, boosting efficiency, and accelerating high-quality software delivery.
DORA metrics, however, provide a balanced framework that encourages cooperative success. For example, by focusing on Change Failure RateDeployment Frequency, you create a feedback loop where neither team can game the system. High deployment frequency is only valuable if it’s accompanied by low failure rates, ensuring that the product’s quality improves alongside speed. The DevOps process consists of a series of practices, workflows, and methodologies—such as automation, continuous integration/continuous deployment (CI/CD), and security integration—that enable rapid, collaborative, and iterative software development, deployment, and operations.
In contrast to traditional metrics, DORA’s approach emphasizes continuous improvement across the entire delivery pipeline, leading to better collaboration between teams and improved outcomes for the business. The holistic nature of these metrics also forces leaders to look at the entire value stream, making it easier to identify bottlenecks or systemic issues early on. Effective delivery processes are crucial for transforming and scaling DevOps practices within enterprise organizations. DevOps practices emphasize automation, collaboration, integration, and rapid feedback cycles to improve software delivery speed and quality. By combining development and operations, DevOps increases the efficiency, speed, and security of software development and delivery compared to traditional processes.
While the initial focus during your DevOps transformation should be on Deployment FrequencyChange Failure Rate, it’s important to recognize the long-term benefits of adding Lead Time for ChangesTime to Restore Service to your evaluation. Once your teams have achieved a healthy rhythm of frequent, reliable deployments, you can start optimizing for faster recovery and shorter change times.
A mature DevOps organization that excels in these areas positions itself to innovate rapidly. DevOps enables rapid delivery of features and improvements, allowing teams to release high-quality software quickly and efficiently. By decreasing lead times and recovery times, your team can respond faster to market changes, giving you a competitive edge in industries that demand agility.
DevOps teams work across the entire application lifecycle, from development and testing to deployment and ongoing operations, promoting collaboration and automation throughout all phases. The DevOps lifecycle requires continuous collaboration and iterative improvement, with an emphasis on continuous feedback to enhance both processes and products. Over time, these metrics will also reduce technical debt, enabling faster, more reliable development cycles and an enhanced customer experience. The benefits of DevOps include faster and easier releases, improved team efficiency, increased security, higher quality products, and ultimately, happier teams and customers.
One overlooked aspect of DORA metrics is their ability to promote accountability across teams. By pairing Deployment Frequency with Change Failure Rate, for example, you prevent one team from achieving its goals at the expense of the other. Similarly, pairing Lead Time for Changes with Time to Restore Service encourages teams to both move quickly and fix issues effectively when things go wrong. The DevOps approach emphasizes automation, consistency, and collaboration across the software development lifecycle, integrating practices like infrastructure as code, continuous testing, and container orchestration to improve efficiency and reliability.
This pairing strategy fosters a culture of accountability, where each team is responsible not just for hitting its own goals but also for contributing to the success of the entire delivery pipeline. This mindset shift is crucial for the success of any DevOps transformation. Core DevOps focuses include fostering collaboration, accountability, and continuous improvement, which drive rapid delivery and operational efficiency. Project management practices and cross-functional teams are essential for successful DevOps implementation, ensuring shared responsibility and continuous collaboration. DevOps improves collaboration between development and operations teams, leading to increased efficiency and reduced handoff times. To fully realize these benefits, organizations need to build the necessary infrastructure that gives teams the autonomy to manage their products. It encourages teams to think beyond their silos and work together toward shared outcomes, resulting in better software and a more collaborative work environment.
DevOps transformations can be daunting, especially for teams that are already overwhelmed by high workloads and a fast-paced development environment. One strategic benefit of starting with just two metrics—Deployment Frequency and Change Failure Rate—is the opportunity to achieve quick wins. Important DevOps practices, such as introducing automation, help teams achieve these early successes by streamlining workflows and improving collaboration.
Quick wins, such as reducing deployment time or lowering failure rates, have a significant psychological impact on teams. By showing progress early in the transformation, you can generate excitement and buy-in across the organization. These wins build momentum, making teams more eager to tackle the larger, more complex challenges that lie ahead in the DevOps journey. Automation streamlines processes and reduces manual errors, further lowering resistance and helping teams move quickly through development and deployment.
As these small victories accumulate, the organizational culture shifts toward one of continuous improvement, where teams feel empowered to take ownership of their roles in the transformation. This incremental approach reduces resistance to change and ensures that even larger-scale initiatives, such as optimizing Lead Time for Changes and Time to Restore Service, feel achievable and less stressful for teams. Automation is a key DevOps practice that enables teams to move quickly through the process of developing and deploying software.
Leadership plays a critical role in ensuring that DORA metrics are not just implemented but fully integrated into the company’s DevOps practices. To achieve true transformation, leaders must have a clear DevOps strategy that integrates practices, culture, and automation to maximize the benefits of DevOps principles. To achieve true transformation, leaders must:
DevOps engineers are specialists responsible for integrating development and operations processes, with a focus on automation, continuous integration, and optimizing the software development lifecycle. They manage all aspects of the software development lifecycle, including communicating critical information to the business and customers, managing releases, and identifying and resolving technical issues for software users. DevOps engineers require knowledge of a range of programming languages and strong communication skills to collaborate effectively among engineering and business groups. They are concerned with reducing repetitive tasks through automation to decrease complexity and bring process improvements, tools, and methodologies to increase efficiency and accelerate software delivery from concept to release.
In the fast-paced ecosystem of software development, code quality serves as a foundational pillar that transcends mere technical considerations—it represents a critical business imperative that drives organizational success. DevOps methodologies establish robust bridges between development and operations teams, ensuring that software quality becomes a distributed responsibility that permeates the entire Software Development Life Cycle (SDLC). Through the strategic embedding of quality assurance mechanisms and automated validation processes into every developmental phase, DevOps practitioners can deliver software solutions that demonstrate both exceptional reliability and operational resilience, effectively addressing the evolving demands of contemporary users and dynamic market conditions.
Continuous Integration and Continuous Delivery (CI/CD) pipelines represent the foundational infrastructure of modern DevOps workflows and operational excellence. These sophisticated practices enable development teams to automatically orchestrate build processes, execute comprehensive test suites, and deploy code modifications with precision, ensuring that every incremental update undergoes rigorous validation before reaching production environments. Automated testing frameworks, peer code review systems, and real-time monitoring solutions constitute essential DevOps toolchains that facilitate early error detection, enhance software quality metrics, and substantially reduce the risk of costly system downtime. This comprehensive approach not only accelerates the software delivery lifecycle but also empowers development teams to iterate rapidly and respond to stakeholder feedback with enhanced confidence and technical precision.
Collaborative integration forms the cornerstone architecture of the DevOps operational model and organizational transformation. When development and operations teams engage in seamless collaboration, they can effectively share domain expertise, optimize operational processes, and ensure that software releases consistently meet stringent quality benchmarks and compliance standards. Platform engineering further amplifies this collaborative foundation by providing standardized toolchains and automated workflow orchestration for infrastructure provisioning, configuration management, and deployment automation. This systematic consistency across diverse environments enables teams to concentrate their efforts on delivering innovative features and improving code quality metrics, rather than troubleshooting complex deployment issues and environmental discrepancies.
The strategic integration of artificial intelligence and machine learning algorithms into DevOps workflows is fundamentally transforming how teams analyze code repositories and manage complex distributed systems. AI-powered analytical tools can autonomously detect code smells, identify security vulnerabilities, and pinpoint performance bottlenecks through pattern recognition and predictive analysis, enabling teams to proactively address systemic issues before they impact end-user experiences. Through the strategic leveraging of these advanced technological capabilities, organizations can significantly increase operational efficiencies, optimize resource allocation, and maintain sustainable competitive advantages in rapidly evolving market landscapes.
Security integration represents another critical dimension of code quality within the comprehensive DevOps lifecycle and risk management framework. Through the incorporation of security practices such as automated security testing protocols, vulnerability scanning mechanisms, and compliance monitoring systems into the development process, security teams and development teams can collaborate effectively to identify and remediate potential risks during early developmental phases. This proactive security approach substantially reduces the likelihood of security breaches and data vulnerabilities while ensuring that software releases demonstrate both exceptional quality standards and robust security postures.
Ultimately, DevOps success depends fundamentally on cultivating a organizational culture of continuous improvement and adaptive learning. Through embracing iterative enhancement methodologies, adopting sophisticated automated toolchains, and fostering transparent communication channels, software development teams can consistently deliver high-quality software solutions at accelerated velocities. This comprehensive approach not only improves customer satisfaction metrics and user experience but also positions organizations to respond rapidly to evolving business requirements and emerging technological advancements in the competitive marketplace.
In summary, the strategic synergy between DevOps practices and code quality standards represents a driving force behind successful software engineering initiatives and organizational digital transformation. Through aligning development and operations teams, introducing comprehensive automation frameworks, and integrating security protocols throughout the development lifecycle, organizations can deliver software solutions that demonstrate robustness, security compliance, and operational readiness to meet the complex challenges of today's digital landscape and emerging technological paradigms.
In your DevOps journey, the right tools can make all the difference. One often overlooked aspect of DevOps success is the need for effective, transparent documentation that evolves as your systems change. Typo, a dynamic documentation tool, plays a critical role in supporting your transformation by ensuring that everyone—from engineers to operations teams—can easily access, update, and collaborate on essential documents.
Typo helps you:
With Typo, you streamline not only the technical but also the operational aspects of your DevOps transformation, making it easier to implement and act on DORA metrics while fostering a culture of shared responsibility. DevOps tools help automate and accelerate processes, which increases reliability and improves collaboration among teams.
Starting a DevOps transformation can feel overwhelming, but with the focus on DORA metrics—especially Deployment Frequency and Change Failure Rate—you can begin making meaningful improvements right away. DevOps is an evolution of the agile software development methodology, which promotes iterative development and rapid delivery. Agile development and agile practices are foundational to DevOps, emphasizing flexibility, customer feedback, and incremental delivery. Agile teams, often small and autonomous, play a crucial role in microservices architecture by enabling quicker innovation and frequent deployments. DevOps serves as a structured software development methodology that combines development and operations, focusing on automation, continuous integration, and iterative processes to improve delivery speed and efficiency. Managing code infrastructure through Infrastructure as Code (IaC) allows teams to automate and manage infrastructure consistently and efficiently. Deploying software is streamlined through automated workflows in CI/CD pipelines, enabling faster and more reliable releases. Site reliability engineering (SRE) complements DevOps by automating operations, ensuring system reliability, and bridging the gap between development and operations teams. SRE also transforms the role of systems administrators, shifting their focus to automation and reliability engineering. Microservices architecture breaks applications into independent services, supporting faster development and deployment cycles. Monitoring and observability tools help teams identify and resolve issues across the entire development process, from planning to operations. Continuous integration enables multiple developers to contribute to a shared repository and run automated tests, while continuous delivery allows for frequent, automated releases to production. Transitioning from legacy infrastructure to IaC and microservices offers faster innovation but can increase operational workload. Encouraging experimentation and risk-taking fosters a culture of continuous learning in DevOps. Your organization can smoothly transition into a high-performing, innovative powerhouse by fostering a collaborative culture, aligning team goals, and leveraging tools like Typo for documentation.
The key is starting with what matters most: getting your teams aligned on quality and speed, measuring the right things, and celebrating the small wins along the way. From there, your DevOps transformation will gain the momentum needed to drive long-term success.

Are you feeling unsure if your team is making real progress, even though you’re following DevOps practices? Maybe you’ve implemented tools and automation but still struggle to identify what’s working and what’s holding your projects back. You’re not alone. Many teams face similar frustrations when they can’t measure their success effectively.
But here’s the truth: without clear metrics, it’s nearly impossible to know if your DevOps processes are driving the results you need. Tracking the right DevOps metrics can make all the difference, offering insights that help you streamline workflows, fix bottlenecks, and make data-driven decisions.
In this blog, we’ll dive into the essential DevOps metrics that empower teams to confidently measure success. Whether you’re just getting started or looking to refine your approach, these metrics will give you the clarity you need to drive continuous improvement. Ready to take control of your project’s success? Let’s get started.
DevOps metrics are statistics and data points that correlate to a team's DevOps model's performance. They measure process efficiency and reveal areas of friction between the phases of the software delivery pipeline.
These metrics are essential for tracking progress toward achieving overarching goals set by the team. The primary purpose of DevOps metrics is to provide insight into technical capabilities, team processes, and overall organizational culture.
By quantifying performance, teams can identify bottlenecks, assess quality improvements, and measure application performance gains. Ultimately, if you don’t measure it, you can’t improve it.
The DevOps Metrics has these primary categories:
Understanding these categories helps organizations select relevant metrics tailored to their specific challenges.
DevOps is often associated with automation and speed, but at its core, it is about achieving measurable success. Many teams struggle with measuring their success due to inconsistent performance or unclear goals. It's understandable to feel lost when confronted with vast amounts of data and competing priorities.
However, the right metrics can simplify this process.
They help clarify what success looks like for your team and provide a framework for continuous improvement. Remember, you don't have to tackle everything at once; focusing on a few key metrics can lead to significant progress.
To effectively measure your project's success, consider tracking the following essential DevOps metrics:
This metric tracks how often your team releases new code. A higher frequency indicates a more agile development process. Deployment frequency is measured by dividing the number of deployments made during a given period by the total number of weeks/days. One deployment per week is standard, but it also depends on the type of product.
For example, a team working on a mission-critical financial application may aim for daily deployments to fix bugs and ensure system stability quickly. In contrast, a team developing a mobile game might release updates weekly to coincide with the app store's review process.
Measure how quickly changes move from development to production. Shorter lead times suggest a more efficient workflow. Lead time for changes is the length of time between when a code change is committed to the trunk branch and when it is in a deployable state, such as when code passes all necessary pre-release tests.
Consider a scenario where a developer submits a bug fix to the main codebase. The change is automatically tested, approved, and deployed to production within an hour. This rapid turnaround allows the team to quickly address customer issues and maintain a high level of service.
This assesses the percentage of changes that cause issues requiring a rollback. Lower rates indicate better quality control. The change failure rate is the percentage of code changes that require hot fixes or other remediation after production, excluding failures caught by testing and fixed before deployment.
Imagine a team that deploys 100 changes per month, with 10 of those changes requiring a rollback due to production issues. Their change failure rate would be 10%. By tracking this metric over time and implementing practices like thorough testing and canary deployments, they can work to reduce the failure rate and improve overall stability.
Evaluate how quickly your team can recover from failures. A shorter recovery time reflects resilience and effective incident management. MTTR measures how long it takes to recover from a partial service interruption or total failure, regardless of whether the interruption is the result of a recent deployment or an isolated system failure.
In a scenario where a production server crashes due to a hardware failure, the team's MTTR is the time it takes to restore service. If they can bring the server back online and restore functionality within 30 minutes, that's a strong MTTR. Tracking this metric helps teams identify areas for improvement in their incident response processes and infrastructure resilience.
These metrics are not about achieving perfection; they are tools designed to help you focus on continuous improvement. High-performing teams typically measure lead times in hours, have change failure rates in the 0-15 percent range, can deploy changes on demand, and often do so many times a day.

While measuring success is essential, it's important to acknowledge the emotional and practical hurdles that come with it:
People often resist change, especially when it disrupts established routines or processes. Overcoming this resistance is crucial for fostering a culture of improvement.
For example, a team that has been manually deploying code for years may be hesitant to adopt an automated deployment pipeline. Addressing their concerns, providing training, and demonstrating the benefits can help ease the transition.
Teams frequently find themselves caught up in day-to-day demands, leaving little time for proactive improvement efforts. This can create a cycle where urgent tasks overshadow long-term goals.
A development team working on a tight deadline may struggle to find time to optimize their deployment process or write automated tests. Prioritizing these activities as part of the sprint planning process can help ensure they are not overlooked.
Organizations may become complacent when things seem to be functioning adequately, preventing them from seeking further improvements. The danger lies in assuming that "good enough" will suffice without striving for excellence.
A team that has achieved a 95% test coverage rate may be tempted to focus on other priorities, even though further improvements could catch additional bugs and reduce technical debt. Regularly reviewing metrics and setting stretch goals can help avoid complacency.
With numerous metrics available, teams might struggle to determine which ones are most relevant to their goals. This can lead to confusion and frustration rather than clarity.
A large organization with dozens of teams and applications may find itself drowning in DevOps metrics data. Focusing on a core set of key metrics that align with overall business objectives and tailoring dashboards for each team's specific needs can help manage this challenge.
Determining what success looks like and how to measure it in a continuous improvement culture can be challenging. Setting clear goals and KPIs is essential but often overlooked.
A team may struggle to define what "success" means for their project. Collaborating with stakeholders to establish measurable goals, such as reducing customer support tickets by 20% or increasing revenue by 5%, can provide a clear target to work towards.
If you're facing these challenges, remember that you are not alone. Start by identifying the most actionable metrics that resonate with your current goals. Focusing on a few key areas can make the process feel more manageable and less daunting.
Once you've identified the key metrics to track, it's time to leverage them for continuous improvement:
Establish baselines: Begin by establishing baseline measurements for each metric you plan to track. This will give you a reference point against which you can measure progress over time.
For example, if your current deployment frequency is once every two weeks, establish that as your baseline before setting a goal to deploy weekly within three months.
Set clear objectives: Define specific objectives for each metric based on your baseline measurements. For instance, if your current deployment frequency is once every two weeks, aim for weekly deployments within three months.
Implement feedback loops: Create mechanisms for gathering feedback from team members about processes and tools regularly used in development cycles. This could be through retrospectives or dedicated feedback sessions focusing on specific metrics.
After each deployment, hold a brief retrospective to discuss what went well, what could be improved, and any insights gained from the deployment metrics. Use this feedback to refine processes and inform future improvements.
Analyze trends: Regularly analyze trends in your metrics data rather than just looking at snapshots in time. For example, if you notice an increase in change failure rate over several weeks, investigate potential causes such as code complexity or inadequate testing practices.
Use tools like Typo to visualize trends in your DevOps metrics over time. Look for patterns and correlations that can help identify areas for improvement. For instance, if you notice that deployments with more than 50 commits tend to have higher failure rates, consider breaking changes into smaller batches.
Encourage experimentation: Foster an environment where team members feel comfortable experimenting with new processes or tools based on insights gained from metrics analysis. Encourage them to share their findings with others in the organization.
If a developer discovers a new testing framework that significantly reduces the time required to validate changes, support them in implementing it and sharing their experience with the broader team. Celebrating successful experiments helps reinforce a culture of continuous improvement.
Celebrate improvements: Recognize and celebrate improvements achieved through data-driven decision-making efforts—whether it's reducing MTTR or increasing deployment frequency—this reinforces positive behavior within teams.
When a team hits a key milestone, such as deploying 100 changes without a single failure, take time to acknowledge their achievement. Sharing success stories helps motivate teams and demonstrates the value of DevOps metrics.
Iterate regularly: Continuous improvement is not a one-time effort; it requires ongoing iteration based on what works best for your team's unique context and challenges encountered along the way.
As your team matures in its DevOps practices, regularly review and adjust your metrics strategy. What worked well in the early stages may need to evolve as your organization scales or faces new challenges. Remain flexible and open to experimenting with different approaches.
By following these steps consistently over time, you'll create an environment where continuous improvement becomes ingrained within your team's culture—ultimately leading toward greater efficiency and higher-quality outputs across all projects.
One tool that can significantly ease the process of tracking DevOps metrics is Typo—a user-friendly platform designed specifically for streamlining metric collection while integrating seamlessly into existing workflows:
Intuitive interface: Typo's user-friendly interface allows teams to easily monitor critical metrics such as deployment frequency and lead time for changes without extensive training or onboarding processes required beforehand.
For example, the Typo dashboard provides a clear view of key metrics like deployment frequency over time so teams can quickly see if they are meeting their goals or if adjustments are needed.

By automating data collection processes through integrations with popular CI/CD tools like Jenkins or GitLab CI/CD pipelines—Typo eliminates manual reporting burdens placed upon developers—freeing them up so they can focus more on delivering value rather than managing spreadsheets!
Typo automatically gathers deployment data from your CI/CD tools so developers save time while reducing human error risk associated with manual data entry—allowing them instead to concentrate solely on improving results achieved through informed decision-making based upon actionable insights derived directly from their own data!
Typo provides real-time performance dashboards that visualize key metrics at a glance, enabling quick decision-making based on current performance trends rather than relying solely upon historical data points!
The Typo dashboard updates in real time as new deployments occur, giving teams an immediate view of their current performance against goals. This allows them to quickly identify and address any issues arising.
With customizable alerts set up around specific thresholds (e.g., if the change failure rate exceeds 10%), teams receive timely notifications that prompt them to take action before issues escalate further down production lines!
Typo allows teams to set custom alerts based on specific goals and thresholds—for example, receiving notification if the change failure rate rises above 5% over three consecutive deployments, helping catch potential issues early before they cause major problems.
Typo effortlessly integrates with various project management tools (like Jira) alongside monitoring solutions (such as Datadog), providing comprehensive insights into both development processes and operational performance simultaneously.
Using Typo empowers organizations simplifying metric tracking without overwhelming users allowing them instead concentrate solely upon improving results achieved through informed decision-making based upon actionable insights derived directly from their own data.
As we conclude this discussion, measuring project success, effective DevOps metrics serve invaluable strategies driving continuous improvement initiatives while enhancing collaboration efforts among various stakeholders involved throughout every stage—from development through deployment until final delivery. By focusing specifically on key indicators like deployment frequency alongside lead time changes coupled together alongside change failure rates mean time recovery—you'll gain deeper insights into identifying bottlenecks while optimizing workflows accordingly.
While challenges may arise along this journey towards achieving excellence within software delivery processes—tools like Typo combined alongside supportive cultures fostered throughout organizations will help navigate these obstacles successfully unlocking full potential inherent within each team member involved.
So take those first steps today!
Start tracking relevant metrics now—watch closely improvements unfold before eyes transforming not only how projects executed but also elevating overall quality delivered across all products released moving forward.
Join for a demo with Typo to learn more.

“Why does it feel like no matter how hard we try, our software deployments are always delayed or riddled with issues?”
Many development teams ask this question as they face the ongoing challenges of delivering software quickly while maintaining quality. In software development, DORA metrics provide a framework to identify and improve bottlenecks, helping teams enhance their workflows and overall delivery process. Constant bottlenecks, long lead times, and recurring production failures can make it seem like smooth, efficient releases are out of reach.
But there’s a way forward: DORA Metrics.
By focusing on these key metrics, teams can gain clarity on where their processes are breaking down and make meaningful improvements. Software organizations use DORA metrics to align software development with business goals and drive better organizational performance. With tools like Typo, you can simplify tracking and start taking real, actionable steps toward faster, more reliable software delivery and optimize value delivery to customers and the business. Let’s explore how DORA Metrics can help you transform your process.
In today's rapidly evolving software engineering ecosystem, establishing robust measurement frameworks for DevOps practices has become a cornerstone for driving continuous improvement initiatives and delivering exceptional value to end-users. DevOps metrics serve as powerful analytical instruments that dive into your software delivery pipeline, enabling engineering teams to systematically evaluate delivery performance characteristics and pinpoint bottlenecks that require optimization. Among the most transformative measurement frameworks are the DORA metrics, which have emerged as industry-standard benchmarks for assessing both velocity and reliability aspects of software delivery operations.
By strategically implementing DORA metrics frameworks, organizations can establish comprehensive visibility into their delivery performance patterns, identify operational inefficiencies through data-driven analysis, and execute informed optimization decisions that generate measurable business impact. Tracking these critical performance indicators not only empowers teams to streamline their software delivery workflows but also significantly enhances customer satisfaction by ensuring consistent, high-quality release cycles. Ultimately, leveraging DevOps metrics creates unprecedented opportunities for teams to refine their delivery processes, achieve strategic alignment with business objectives, and maintain competitive advantages in increasingly dynamic market conditions.
DORA Metrics consist of four key indicators (commonly referred to as the four DORA metrics) that help teams assess their software delivery performance:
DORA metrics are calculated by tracking deployment activities, incident data, and timing details to provide a clear picture of software delivery performance. These four DORA metrics align closely with key DevOps principles by emphasizing speed, stability, and continuous improvement within the delivery pipeline. As essential performance metrics, they help software teams benchmark, identify bottlenecks, and drive improvements in their development and operations processes.
While DORA Metrics provide valuable insights, teams often encounter several common challenges:
DevOps teams and multidisciplinary teams can help overcome these challenges by fostering collaboration and shared objectives across traditional team boundaries.
Understanding each DORA Metric in depth is crucial, as these metrics are key components of effective software delivery measurement, for improving software delivery performance. Let’s dive deeper into what each metric measures and why it’s important:
Deployment frequency measures how often an organization successfully releases code to production. Teams that frequently deploy code demonstrate strong DevOps practices, and the importance of production deployment lies in its ability to measure the real impact and success of changes in live environments. This metric is an indicator of overall DevOps efficiency and the speed of the development team. Higher deployment frequency suggests a more agile and responsive delivery process.
To calculate deployment frequency:
The definition of a “successful” deployment depends on your team’s requirements. It could be any deployment to production or only those that reach a certain traffic percentage. Adjust this threshold based on your business needs.
Deployment frequency directly impacts software delivery throughput, as a high-performing engineering team that can deploy code frequently and efficiently will achieve greater throughput and faster release cycles.
Read more: Learn How Requestly Improved their Deployment Frequency by 30%
Lead time for changes measures the amount of time it takes a code commit to reach production, with lead time metrics serving as a key part of this measurement. This metric reflects the efficiency and complexity of the delivery pipeline. Shorter lead times indicate an optimized workflow and the ability to respond quickly to user feedback.
To calculate lead time for changes:
Lead time for Changes is a key indicator of how quickly your team can deliver value to customers and improve the overall software development process. Reducing the amount of work in each deployment, improving code reviews, and increasing automation can help shorten lead times. Additionally, creating smaller pull requests can further accelerate the software development process by enabling more frequent deployments and streamlining code reviews.
Change failure rate measures the percentage of deployments that result in failures requiring a rollback, fix, or incident. This metric is an important indicator of delivery quality and reliability. A lower change failure rate suggests more robust testing practices and a stable production environment.
To calculate change failure rate:
Change failure rate is a counterbalance to deployment frequency and lead time. While those metrics focus on speed, change failure rate ensures that rapid delivery doesn’t come at the expense of quality. Reducing batch sizes and improving testing can lower this rate. Effective code review processes also play a crucial role in reducing change failure rates by catching issues before they reach production.
On average, teams typically experience higher change failure rates compared to elite performers, who achieve lower rates through mature practices. It's important to consider other DORA metrics alongside change failure rate to gain a comprehensive understanding of software delivery performance.
Mean time to recovery measures how long it takes to recover from a failure or incident in production, including the team's ability to restore services rapidly to minimize downtime. This metric indicates a team’s ability to respond to issues and minimize downtime. A lower MTTR suggests strong incident management practices and resilience.
To calculate MTTR:
Restoring service quickly is critical for maintaining customer trust and satisfaction. Improving monitoring, automating rollbacks, and having clear runbooks can help teams recover faster from failures.
By understanding these metrics in depth and tracking them over time, teams can identify areas for improvement and measure the impact of changes to their delivery processes. Focusing on these right metrics helps optimize for both speed and stability in software delivery.

How does one effectively measure software delivery excellence in today's rapidly evolving technological landscape? DevOps Research and Assessment (DORA) has established itself as the definitive framework for evaluating software delivery performance through rigorous empirical research spanning thousands of organizations worldwide. Through comprehensive analysis of development workflows and deployment patterns, DORA identified four critical performance indicators—deployment frequency, lead time for changes, change failure rate, and time to restore service—that collectively provide an unprecedented holistic view of organizational software delivery capabilities. These metrics dive deep into the core mechanisms that drive successful software delivery, examining both the velocity of feature deployment and the resilience of production systems under varying operational conditions.
These sophisticated metrics are meticulously designed to help development teams measure software delivery performance by simultaneously optimizing both throughput and stability parameters. By systematically tracking deployment frequency and lead time for changes, organizations can analyze their capacity to rapidly deliver innovative features, bug fixes, and system enhancements while maintaining consistent release cadences. Monitoring change failure rate and time to restore service enables teams to evaluate the robustness and fault-tolerance of their deployment pipelines, ensuring that system reliability remains paramount even as deployment velocity increases. Leveraging these comprehensive DORA metrics, engineering teams can identify performance bottlenecks within their CI/CD workflows, streamline complex deployment architectures, and implement data-driven optimizations that enhance overall delivery throughput while minimizing operational risk exposure.
DORA metrics have evolved into industry-standard benchmarks that are widely adopted across diverse technological domains, enabling organizations to systematically compare their DevOps maturation against established performance baselines and drive continuous improvement initiatives. By embracing the DORA methodology and its predictive analytics capabilities, development teams can ensure their software delivery processes achieve optimal efficiency while maintaining exceptional system reliability, ultimately supporting sustained business growth and competitive advantage in dynamic market environments. The framework's emphasis on measurable outcomes and statistical rigor has transformed how organizations approach software delivery optimization, creating a foundation for evidence-based decision-making that drives operational excellence.
Starting with DORA Metrics can feel daunting, but here are some practical steps you can take. Accurately measuring DORA metrics is crucial for monitoring and improving your software delivery performance, and it's important to understand how DORA metrics are calculated using deployment data, incident records, and timing details.
When implementing DORA metrics, be sure to consider the entire software delivery process to ensure comprehensive and effective measurement.
Begin by clarifying what you want to achieve with DORA Metrics and how these goals align with customer value. Are you looking to improve deployment frequency? Reduce lead time? Understanding your primary objectives will help you focus your efforts effectively.
Select one metric that aligns most closely with your current goals or pain points. For instance:
Before implementing changes, gather baseline data for your chosen metric over a set period (e.g., last month). This will help you understand your starting point and measure progress accurately.
Make small adjustments based on insights from your baseline data. For example:
If focusing on Deployment Frequency, consider adopting continuous integration practices, implementing automated testing, or automating parts of your deployment process.
Use tools like Typo to track your chosen metric consistently. Set up regular check-ins (weekly or bi-weekly) to review progress against your baseline data and adjust strategies as needed. Make sure to analyze patterns in your metrics data during these reviews to identify bottlenecks and opportunities for improvement.
Encourage team members to share their experiences with implemented changes regularly. Gather feedback continuously and be open to iterating on your processes based on what works best for your team. Incorporating value stream management practices can further guide these iterations, helping to optimize your development pipeline and ensure that improvements deliver measurable business value.
Typo simplifies tracking and optimizing DORA Metrics through its user-friendly features. Both DevOps teams and engineering teams can use Typo to enhance their software development workflows, improving deployment speed, reliability, and overall delivery quality:
By leveraging Typo’s capabilities, teams can effectively reduce lead times, enhance deployment processes, and foster a culture of continuous improvement without feeling overwhelmed by data complexity.
“When I was looking for an Engineering KPI platform, Typo was the only one with an amazing tailored proposal that fits with my needs. Their dashboard is very organized and has a good user experience, it has been months of use with good experience and really good support”
Read more: Learn How Transfeera reduced Review Wait Time by 70%
Customer satisfaction serves as a fundamental cornerstone and vital indicator of the effectiveness of your software delivery process, directly impacting business outcomes and organizational success. To truly understand how well your development teams are meeting customer needs and expectations, it becomes absolutely crucial to track comprehensive metrics that accurately reflect the end-user experience and satisfaction levels. How do we achieve this level of insight? By implementing robust monitoring systems that capture customer ticket volume, application availability, and application performance as primary indicators. These critical metrics provide invaluable insights into the quality, reliability, and overall effectiveness of your software delivery pipeline:
Flow metrics, which comprehensively measure the delivery of business value throughout your entire software development lifecycle, are equally instrumental and transformative in evaluating customer satisfaction levels and organizational efficiency. How do these metrics enhance our understanding of customer value delivery? By meticulously monitoring how efficiently value flows through your delivery process, development teams can systematically identify bottlenecks, optimization opportunities, and areas for strategic improvement while ensuring consistent delivery of features and fixes that matter most to your users and stakeholders. These flow-based measurements encompass:
Implementing DORA metrics alongside customer-focused measurement frameworks enables organizations to gain a comprehensive, holistic view of their software delivery process effectiveness and customer impact correlation. How does this integrated approach transform organizational capabilities? This strategic methodology helps development teams systematically pinpoint specific opportunities to enhance customer satisfaction scores, optimize the entire delivery process workflow, and ultimately deliver greater business value through data-driven decision making and continuous improvement initiatives:
Effectively tracking DevOps metrics, including DORA metrics, requires a comprehensive ecosystem of sophisticated tools designed to collect, analyze, and visualize relevant data across the entire software delivery pipeline. Modern software delivery relies heavily on an integrated combination of continuous integration and continuous deployment (CI/CD) tools, advanced monitoring solutions, and incident management platforms that work in synergy to provide precise, actionable data on every stage of the delivery process. This involves implementing robust data collection mechanisms that capture deployment frequency, lead time for changes, change failure rate, and time to restore service—the four key DORA metrics that serve as critical indicators of software delivery performance and organizational capability.
These sophisticated tools enable development and operations teams to systematically identify bottlenecks, monitor delivery performance in real-time, and gain deep insights that drive continuous improvement across the entire software delivery lifecycle. For example, CI/CD tools automate the build and deployment pipeline by orchestrating code integration, running automated tests, and managing deployments across multiple environments, while advanced monitoring tools track application health, performance metrics, and user experience indicators in real-time through comprehensive observability platforms. Incident management tools facilitate rapid response protocols, enabling teams to respond swiftly to issues through automated alerting, intelligent routing, and collaborative resolution workflows, ensuring a rapid return to normal service while minimizing impact on end-users and business operations.
By strategically leveraging these advanced technologies in an integrated manner, organizations can implement DORA metrics effectively, enabling development teams to make data-driven decisions and systematically optimize their software delivery processes through continuous measurement and improvement. This comprehensive approach results in a more efficient, reliable, and customer-focused methodology for software delivery that encompasses automated quality gates, predictive analytics, and performance optimization techniques, ultimately empowering teams to deliver exceptional value with confidence while maintaining high standards of reliability, security, and operational excellence throughout the entire software development and deployment lifecycle.
When implementing DORA Metrics, teams often encounter several pitfalls that can hinder progress:
Over-focusing on one metric: While it’s essential prioritize certain metrics based on team goals, overemphasizing one at others’ expense can lead unbalanced improvements; ensure all four metrics are considered strategy holistic view performance.
Ignoring contextual factors: Failing consider external factors (like market changes organizational shifts) when analyzing metrics can lead astray; always contextualize data broader business objectives industry trends meaningful insights.
Neglecting team dynamics: Focusing solely metrics without considering team dynamics create toxic environment where individuals feel pressured numbers rather than encouraged collaboration; foster open communication within about successes challenges promoting culture learning from failures.
Setting unrealistic targets: Establishing overly ambitious targets frustrate team members if they feel these goals unattainable reasonable timeframes; set realistic targets based historical performance data while encouraging gradual improvement over time. High performing teams avoid these pitfalls by focusing on balanced, sustainable improvements, optimizing both speed and stability to deliver continuous value.
When implementing DORA (DevOps Research and Assessment) metrics, it is crucial to adhere to best practices to ensure accurate measurement of key performance indicators and successful evaluation of your organization’s DevOps practices. By following established guidelines for DORA metrics implementation, teams can effectively track their progress, identify areas for improvement, and drive meaningful changes to enhance their DevOps capabilities, as well as improve the overall software development process.
Every team operates with its own unique processes and goals. To maximize the effectiveness of DORA metrics, consider the following steps:
By customizing these metrics, you ensure they provide meaningful insights that drive improvements tailored to your specific needs.
Leadership plays a vital role in cultivating a culture of continuous improvement. To effectively support DORA metrics, leaders should:
By actively engaging with their teams about these metrics, leaders can create an environment where everyone feels empowered to contribute toward collective goals.
Regularly monitoring progress using DORA metrics is essential for sustained improvement. Consider the following practices:
Recognizing achievements reinforces positive behaviours and encourages ongoing commitment, ultimately enhancing software delivery practices.
DORA Metrics offer valuable insights into how to transform software delivery processes, enhance collaboration, and improve quality; understanding these deeply and implementing them thoughtfully within an organization positions it for success in delivering high-quality efficiently.
Start small manageable changes—focus one metric at time—leverage tools like Typo support journey better performance; remember every step forward counts creating more effective development environment where continuous improvement thrives!

Software engineering teams are important assets for the organization. They build high-quality products, gather and analyze requirements, design system architecture and components, and write clean, efficient code. Measuring their success and identifying the potential challenges they may be facing is important. However, this isn’t always easy and takes a lot of time. Analytics tools help align engineering activities with business goals by providing visibility into team performance and supporting strategic decision-making.
And that’s how Engineering Analytics Tools comes to the rescue. These tools provide data driven insights that help improve engineering productivity by enabling leaders to make informed decisions and optimize team performance. One of the popular tools is Jellyfish which is widely used by engineering leaders and CTOs across the globe.
While this is usually the best choice for the organizations, there might be chances that it doesn’t work for you. Worry not! We’ve curated the top 6 Jellyfish alternatives that you can consider when choosing an engineering analytics tool for your company.
Jellyfish is a popular engineering management platform that offers real-time visibility into engineering organizations and team progress. It translates technical data into information that the business side can understand and offers multiple perspectives on resource allocation. It also shows the status of every pull request and commits on the team. Jellyfish can be integrated with third-party tools such as Bitbucket, Github, Gitlab, JIRA, and other popular HR, Calendar, and Roadmap tools.
Jellyfish supports engineering operations by providing high-level visibility and management tools that help optimize workflows and align technical efforts with organizational goals.
However, its UI can be tricky initially and has a steep learning curve due to the vast amount of data it provides, which can be overwhelming for new users.

Typo is another Jellyfish alternative that maximizes the business value of software delivery by offering features that improve SDLC visibility, developer insights, and workflow automation. It provides comprehensive insights into the deployment process through key DORA and other engineering metrics and offers engineering benchmarks to compare the team’s results across industries. Typo also delivers detailed analytics, enabling better decision-making and risk management for software development teams. Its automated code tool helps development teams identify code issues and auto-fix them before merging to master. It captures a 360-degree view of developers’ experience and includes an effective sprint analysis that tracks and analyzes the team’s progress. Additionally, you can create custom reports to track key metrics, gain deeper insights, and improve processes. Typo can be integrated with tech tools such as GitHub, GitLab, Jira, Linear, and Jenkins, making it easy to benchmark and track progress while evaluating the team's performance.
LinearB is another leading software engineering intelligence platform that provides insights for identifying bottlenecks and streamlining software development workflow. It highlights automatable tasks to save time and enhance developer productivity. It also tracks DORA metrics and collects data from other tools to provide a holistic view of performance. Its project delivery tracker reflects project delivery status updates using planning accuracy and delivery reports. LinearB can be integrated with third-party applications such as Jira, Slack, and Shortcut.

Waydev is a software development analytics platform that provides actionable insights on metrics related to bug fixes, velocity, and more. It uses the agile method for tracking output during the development process and allows engineering leaders to see data from different perspectives. It emphasizes market-based metrics and ROI, unlike other platforms. Its resource planning assistance feature allows for avoiding scope creep and offers an understanding of the cost and progress of deliverables and key initiatives. Waydev can be integrated with well-known tools such as Gitlab, Github, CircleCI, and AzureOPS.

Pluralsight Flow is a popular tool that tracks DORA metrics and helps to benchmark DevOps practices, supporting software teams in achieving their goals. It aggregates GIT data into comprehensive insights and offers a bird-eye view of what’s happening in development teams. Its sprint feature helps to make better plans and dive into the team’s accomplished work and whether they are committed or unplanned. Its team-level ticket filters, GIT tags, and other lightweight signals streamline pulling data from different sources. Pluralsight Flow helps improve team collaboration by providing real-time analytics, tracking key metrics, and supporting distributed teams to enhance workflow and communication. Pluralsight Flow can be integrated with manual and automated testing tools such as Azure DevOps, and GitLab, helping to optimize software delivery processes.

Code Climate Velocity is a popular tool that uses repos to synthesize data and offers visibility into code coverage, coding practices, and security risks. It tracks issues in real time to help quickly move through existing workflows and allow engineering leaders to compile data on dev velocity and code quality. It has JIRA and GIT support that compresses into real-time analytics. Its customized dashboard and trends provide a view into each individual’s day-to-day tasks to long progress. Code Climate Velocity also provides technical debt assessment and style check in every pull request.

Swarmia is another well-known engineering effectiveness platform that provides quantitative insights into the software development pipeline. It offers visibility into three key areas: Business outcomes, developer productivity, and developer experience. It allows engineering leaders to create flexible and audit-ready software cost capitalization reports. It also identifies and fixes common teamwork antipatterns such as siloing and too much work in progress. Swarmia can be integrated with popular tools such as Slack, JIRA, Gitlab, Azure DevOps, and more.
Implementing a new engineering analytics tool—particularly when exploring alternatives to Jellyfish—fundamentally transforms how engineering teams operate, analyze performance, and optimize their development workflows. By automating data collection, analyzing development patterns, and predicting bottlenecks, these platforms enhance visibility, accuracy, and strategic decision-making across all engineering processes.
Let's explore how engineering analytics tools reshape development workflows and examine the critical factors that determine successful implementation.
Engineering management platforms comprise multiple integration points and analytical capabilities, each with specific objectives that ensure comprehensive visibility into development processes. Here's how these tools influence various aspects of engineering operations:
The foundation of any successful analytics implementation lies in seamless integration with existing development infrastructure.
This capability encompasses comprehensive metric visualization and analysis before implementing process improvements. This involves defining key performance indicators, setting measurement objectives, tracking DORA and SPACE metrics, and creating actionable reporting frameworks for the development process.
The third critical component involves generating real-time visibility into team dynamics, code quality, and engineering efforts. This encompasses creating detailed analytics of development processes based on live data streams, outlining performance components and how they interconnect.
The adoption of scalable analytics architecture has transformed how engineering organizations design and implement their measurement strategies. When combined with data-driven development approaches, scalable platforms offer unprecedented flexibility, adaptability, and operational resilience.
Implementation strategy aims to deploy analytics solutions that are efficient, comprehensive, and team-friendly. In this phase, planning transforms into functional monitoring capabilities—actual configuration takes place based on organizational specifications.
Establishing clear objectives serves as the foundation for successful analytics implementation and directly affects subsequent configuration steps.
Once implementation planning is complete, the entire configuration structure requires dedicated oversight and optimization. This ensures flawless platform operations before reaching end-users and identifies opportunities for enhancement.
The training phase involves educating teams on the optimized analytics platform capabilities. This stage serves as a gateway to ongoing usage activities like advanced reporting and custom dashboard creation.
The integration of feedback collection with ongoing platform refinement creates powerful synergy that enhances collaboration between teams while optimizing crucial measurement processes. Monitoring practices ensure continuous improvement, adaptation, and optimization, which complements the analytics capabilities throughout the development lifecycle.
By strategically planning implementation workflows and optimization strategies, engineering organizations achieve comprehensive visibility into development operations, enhance team performance analytics, and drive measurable business impact. The optimal engineering analytics platform empowers engineering leaders and managers to implement data-driven development processes, maximize team productivity insights, and ensure software development measurements consistently align with strategic organizational objectives.
While we have shared top software development analytics tools, don't forget to conduct thorough research before selecting for your engineering team. Check whether it aligns well with your requirements, facilitates team collaboration and continuous improvement, integrates seamlessly with your existing and upcoming tools, and so on.

Cycle time is a critical metric that assesses the efficiency of your development process and captures the total time taken from the first commit to when the PR is merged or closed. Cycle time provides valuable insight into the efficiency of the delivery process, helping teams identify bottlenecks and improve overall workflow. Reducing the overall cycle time allows organizations to release features or updates to end-users sooner.
Cycle time is often broken down into four phases: Coding, Pickup, Review, and Merge, which represent the key stages of the development pipeline. These phases are commonly used to analyze PR cycle time. Smaller pull requests are easier to plan, review, and deploy, making it beneficial to focus on reducing the size of PRs during these phases.
The total PR cycle time is the sum of the durations of each phase. Average PR cycle time is calculated by averaging the total cycle times across multiple pull requests. Consistent, low cycle times allow better forecasting of project timelines and resource allocation.
PR Review Time is the third stage i.e. the time taken from the Pull Request creation until it gets merged or closed. Efficiently reducing PR Review is crucial for optimizing the development workflow.
Monitoring cycle time helps teams evaluate their performance and identify areas for improvement. In this blog post, we’ll explore strategies to effectively manage and reduce review time to boost your team’s productivity and success. Collaboration and team morale improve when teams regularly assess and optimize their development processes.
Cycle time is a crucial metric that measures the average time PR spends in all stages of the development pipeline. These stages are:
Analyzing different aspects of cycle time, such as organizational, team, iteration, and branch levels, provides a comprehensive view of the development workflow. PR time refers to the overall duration from the initial commit to the merging of a pull request, covering all these stages.
A shorter cycle time indicates an optimized process and highly efficient teams. This can be correlated with higher stability and enables the team to identify bottlenecks and quickly respond to issues with change. Lower cycle time leads to getting feedback from end users faster.
Key points:
The PR Review Time encompasses the time taken for peer review and feedback on the pull request. It is a critical component of PR Cycle Time that represents the duration of a Pull Request (PR) spent in the review stage before it is approved and merged. Review time is essential for understanding the efficiency of the code review process within a development team.
Waiting time, which is the duration between approval and merging, is a key component of PR review time and can significantly impact the overall cycle time.
Conducting code reviews as frequently as possible is crucial for a team that strives for ongoing improvement. Ideally, code should be reviewed in near real-time, with a maximum time frame of 2 days for completion.
If your review time is high, the platform will display the review time as red -

Long reviews can be identifed in the "Pull Request" tab and see all the open PRs.

You can also identify all the PRs having a high cycle time by clicking on view PRs in the cycle time card.
See all the pending reviews in the “Pull Request” and identify them with the oldest review in sequence.

It's common for teams to experience communication breakdowns, even the most proficient ones. To address this issue, we suggest utilizing typo's Slack alerts to monitor requests that are left hanging. This feature allows channels to receive notifications only after a specific time period (12 hrs as default) has passed, which can be customized to your preference. Writing clear descriptions in pull requests helps reviewers understand the changes better and speeds up the review process.
Another helpful practice is assigning a reviewer to work alongside developers, particularly those new to the team. Additionally, we encourage the team to utilize personal Slack alerts, which will directly notify them when they are assigned to review a code.
When a team is swamped with work, extensive pull requests may also be left unattended if reviewing them requires significant time. To avoid this issue, it's recommended to break down tasks into shorter and faster iterations. This approach not only reduces cycle time but also helps to accelerate the pickup time for code reviews. Shorter in-progress time means focusing on splitting work into smaller batches that are easy to plan, review, and deploy.
When a bug is discovered that requires a patch to be made, a high-priority feature comes down from the CEO. In such situations, countless unexpected events may demand immediate attention, causing other ongoing work, including code reviews, to take a back seat.
Code reviews are frequently deprioritized in favor of other tasks, such as creating pull requests with your own changes. This behavior is often a result of engineers misunderstanding how reviews fit into the broader software development lifecycle (SDLC). However, it's important to recognize that code waiting for review is essentially at the finish line, ready to be incorporated and provide value. Every hour that a review is delayed means one less hour of improvement that the new code could bring to the application.
Certain teams restrict the number of individuals who can conduct PR reviews, typically reserving this task for senior members. While this approach is well-intentioned and ensures that only top-tier code is released into production, it can create significant bottlenecks, with review requests accumulating on the desks of just one or a few people. This ultimately results in slower cycle times, even if it improves code quality. Adopting a working agreement can help in monitoring and managing pull requests effectively.
Pickup time revolutionizes pull request workflow optimization, representing the transformative interval between when a pull request achieves ready-for-review status and when reviewers initiate their first action. This game-changing metric becomes particularly powerful in the context of draft PRs—pull requests that streamline works-in-progress development by remaining outside the immediate review queue until teams determine readiness.
When developers leverage draft PR capabilities, this strategic approach signals that code remains in development phases, ensuring the pickup time tracking system stays dormant. The transformation occurs when draft PRs convert to ready-for-review status, instantly activating the pickup phase optimization cycle. From this pivotal moment, pull requests enter the streamlined review queue, and AI-driven tracking systems monitor the duration spent awaiting reviewer engagement, capturing this as enhanced pickup time metrics.
For software development teams pursuing accelerated development processes and revolutionary time-to-market achievements, mastering pickup time management transforms operational efficiency. Extended pickup times reveal critical bottlenecks within review workflows, such as unclear ownership structures, overloaded reviewer capacity, or insufficient visibility into emerging PRs. By leveraging pickup time analytics, teams unlock targeted improvement opportunities, such as implementing data-driven working agreements that establish optimal pickup time thresholds for all PRs, including those transitioning from draft status.
Measuring pickup time for draft PRs transforms workflow visibility by tracking the precise duration from ready-for-review activation to initial review engagement. This powerful metric, combined with review time and merge time analytics, delivers comprehensive pull request cycle time intelligence. By monitoring these interconnected metrics, teams enhance their development velocity assessment capabilities, identify process inefficiencies, and continuously optimize their workflow systems.
To amplify process optimization outcomes, teams should systematically analyze metrics like average PR cycle time, lead time, and coding time analytics. These transformative metrics drive progress tracking, measure process change effectiveness, and ensure feedback loop optimization remains robust. For example, when average pickup time trends upward, teams can leverage these insights to recalibrate priorities or adjust reviewer assignment strategies, maintaining healthy PR pipeline flow dynamics. Automation of testing, builds, and deployments through CI/CD pipelines can reduce manual errors and improve efficiency.
In summary, pickup time—particularly as it revolutionizes draft PR workflows—represents a critical metric for transforming pull request cycle time management. By effectively measuring and optimizing pickup time, software development teams unlock bottleneck identification capabilities, accelerate review process efficiency, and deliver superior software solutions to market with unprecedented speed. Leveraging these powerful insights drives continuous improvement initiatives and empowers teams to implement data-driven decision-making processes that transform their entire development ecosystem.
Here are some steps on how you can monitor and reduce your review time
With typo, you can set the goal to keep the review time under 24 hrs recommended by us. After setting the goal, the system sends personal Slack real-time alerts when PRs are assigned to be reviewed.

Prioritize the critical functionalities and high-risk areas of the software during the review, as they are more likely to have significant issues. This can help you focus on the most critical items first and reduce review time.
Conduct code reviews frequently to catch and fix issues early on in the development cycle. This ensures that issues are identified and resolved quickly, rather than waiting until the end of the development cycle.
Establish coding standards and guidelines to ensure consistency in the codebase, which can help to identify potential issues more efficiently. Keep a close tab on the following metrics that can impact your review time -
Ensure that there is clear communication among the development team and stakeholders to quickly identify issues and resolve them timely.
Peer reviews can help catch issues that may have been missed during individual code reviews. By having team members review each other's code, you can ensure that all issues are caught and resolved quickly.
Minimizing PR review time is crucial for enhancing the team's overall productivity and efficient development workflow. By implementing these, organizations can significantly reduce cycle times and enable faster delivery of high-quality code. Prioritizing these practices will lead to continuous improvement and greater success in software development process.

In the world of software development, high performing teams are crucial for success. DORA (DevOps Research and Assessment) metrics provide a powerful framework to measure the performance of your DevOps team and identify areas for improvement. By focusing on these metrics, you can propel your team towards elite status. DORA metrics matter because they serve as key indicators of effective DevOps practices, enabling performance benchmarking and helping organizations assess their progress in software delivery.
DORA metrics act as a comprehensive framework and serve as key performance indicators (KPIs) for DevOps teams, allowing organizations to set targets and track improvements over time.
Elite teams leverage DORA metrics to optimize their workflows and achieve high performance. Sharing best practices and benchmarking with other teams helps foster improvement across the organization. Elite DevOps teams are highly skilled groups that deploy code frequently, recover from incidents rapidly, and follow best practices aligned with DORA standards.
By using insights from multiple systems and tools, organizations can automate, measure, and track DORA metrics across multiple teams, supporting scalability and collaboration.
DORA research is widely recognized in the industry, and Google Cloud supports DORA research, lending additional credibility and relevance.
Collecting and analyzing data is essential for implementing DORA metrics. It is important to collect data from various sources across the SDLC, such as source code management and CI/CD pipelines, though collecting data accurately can be challenging and resource-intensive.
DORA metrics help drive continuous improvement by identifying bottlenecks, reducing failures, and guiding ongoing enhancements to engineering performance.
The four DORA metrics are regularly updated, with DORA providing clear metrics definitions to ensure consistent performance measurement standards.
The broader role of DORA metrics extends beyond just delivery speed; the DORA metrics focus also emphasizes reliability, collaboration, and customer value in software delivery outcomes.
Elite teams stand out in the world of software development by consistently achieving outstanding software delivery performance through systematic optimization of critical performance indicators. These high performing teams excel across the four key metrics defined by DORA metrics: deployment frequency, lead time for changes, change failure rate, and time to restore service. How do they achieve such remarkable results? By mastering these metrics through comprehensive analysis of historical data, predictive modeling, and continuous monitoring, elite teams establish the benchmark for what's achievable in modern DevOps performance. Their approach involves analyzing vast datasets from multiple deployment cycles to identify optimal patterns and predict future performance trends.
What sets elite teams apart is their relentless focus on continuous improvement and their commitment to a data-driven approach that leverages advanced analytics and machine learning algorithms. They utilize DORA metrics to systematically identify bottlenecks in their software delivery process, employing sophisticated monitoring tools that collect insights from multiple systems, infrastructure components, and deployment pipelines to inform targeted improvement efforts. By implementing DORA metrics and tracking progress over time through automated dashboards and real-time monitoring systems, elite teams optimize every aspect of their CI/CD pipeline, ensuring that their software delivery process achieves both maximum efficiency and uncompromising reliability. This involves analyzing deployment patterns, resource utilization metrics, and failure correlation data to continuously refine their delivery mechanisms.
Elite teams understand that DORA metrics provide more than just numerical indicators—they offer comprehensive visibility into the health of the delivery ecosystem and illuminate specific opportunities for performance enhancement. How do they extract actionable insights from these metrics? By analyzing trends in deployment frequency, lead time for changes, and other key performance indicators through sophisticated statistical analysis and pattern recognition algorithms, these teams make informed decisions that directly drive business outcomes and systematically achieve organizational performance goals. Their analytical approach encompasses examining correlation patterns between different metrics, identifying seasonal trends, and predicting potential performance degradation before it impacts production systems.
Achieving elite status requires more than just technical expertise and tool mastery. It demands cultivating a culture of collaboration that spans cross-functional teams, fostering a willingness to experiment with innovative DevOps practices through controlled testing environments, and maintaining an unwavering commitment to collecting and analyzing comprehensive data from across the entire engineering organization. Elite teams proactively identify emerging trends through predictive analytics, address potential issues before they escalate into critical problems, and foster an environment where continuous improvement becomes an integral component of everyday work processes. This involves implementing feedback loops, conducting regular retrospectives with data-driven insights, and establishing automated systems that flag anomalies and suggest optimization opportunities.
Organizations seeking to improve their software delivery performance can extract significant value from studying and adopting the systematic practices employed by elite teams. How can they begin this transformation? By embracing a comprehensive data-driven approach that encompasses automated metric collection, implementing DORA metrics through integrated monitoring solutions, and establishing a culture focused on continuous improvement through iterative experimentation, any team can initiate the journey toward elite engineering performance. This transformation not only streamlines the delivery process through automation and optimization but also drives superior business outcomes and enables organizations to achieve their most ambitious performance goals through systematic measurement and improvement cycles.
In the next section, we'll conduct a comprehensive examination of the four DORA metrics—exploring what each metric measures through detailed analysis, understanding why each indicator matters for overall system health, and demonstrating how you can leverage these key metrics to drive systematic improvement in your software delivery process. We'll also analyze the challenges and opportunities that emerge when implementing DORA metrics, including best practices for automated data collection, advanced analytics techniques, and comprehensive analysis methodologies. By understanding and systematically applying these principles through structured implementation phases, your team can take decisive steps toward elite status and unlock the complete potential of your software delivery pipeline through data-driven optimization and continuous performance enhancement.
The DORA metric is a set of KPIs used to measure DevOps team performance, focusing on software delivery and operational reliability. DORA metrics are a set of four key metrics that measure the efficiency and effectiveness of your software delivery process:
DORA regularly updates metrics definitions to ensure clarity and alignment with industry standards.
DORA metrics provide valuable insights into the health of your DevOps practices. By tracking these metrics over time, you can identify bottlenecks in your delivery process and implement targeted improvements. It is important to regularly review DORA metrics to assess your current performance and identify areas for improvement.
Research by DORA has shown that high-performing teams (elite teams) consistently outperform low-performing teams in all four metrics. Improving DORA metrics leads to improving software delivery performance and achieving higher deployment frequency. Here’s a quick comparison:
These statistics highlight the significant performance advantage that elite teams enjoy. By striving to achieve elite performance in your DORA metrics, you can unlock faster deployments, fewer errors, and quicker recovery times from incidents. Higher deployment frequency also enables a faster time to market. To monitor improvement, it is essential to track DORA metrics consistently.
Here are some key strategies to achieve elite levels of DORA metrics:
Practical strategies for implementing DORA metrics include selecting the right DevOps tools to implement DORA metrics, integrating multiple data sources across your SDLC, and collecting data from systems such as source code management, CI/CD pipelines, and observability platforms. By collecting data and tracking DORA metrics, engineering leaders and engineering teams can identify bottlenecks, benchmark performance, and drive continuous improvement throughout their DevOps processes.
By implementing these strategies and focusing on continuous improvement, your DevOps team can achieve elite levels of DORA metrics and unlock significant performance gains. Remember, becoming an elite team is a journey, not a destination. By consistently working towards improvement, you can empower your team to deliver high-quality software faster and more reliably.
In addition to the above strategies, here are some additional tips for achieving elite DORA metrics:
By following these tips and focusing on continuous improvement, you can help your DevOps team reach new heights of performance.
As you embark on your journey to DevOps excellence, consider the potential of Large Language Models (LLMs) to amplify your team’s capabilities. LLMs can help DevOps teams and engineering teams improve DORA metrics by automating workflows, streamlining communication, and enabling better collaboration across the software development lifecycle. These advanced AI models can significantly contribute to achieving elite DORA metrics.
LLMs also offer the potential to help organizations measure and analyze other DORA metrics, such as system stability and service level objectives, providing a more comprehensive view of performance and reliability beyond the traditional four metrics.
By leveraging LLMs, both development and operations teams can benefit from enhanced automation, improved collaboration, and more effective strategies for improving DORA metrics.
By strategically integrating LLMs into your DevOps practices, you can enhance collaboration, improve decision-making, and accelerate software delivery. Remember, while LLMs offer significant potential, human expertise and oversight remain crucial for ensuring accuracy and reliability.

Cycle time is a critical metric for assessing the efficiency of your development process that captures the total time taken from the start to the completion of a task.
Coding time is the first stage i.e. the duration from the initial commit to the pull request submission. Efficiently managing and reducing coding time is crucial for maintaining swift development cycles and ensuring timely project deliveries.
Focusing on minimizing coding time can enhance their workflow efficiency, accelerate feedback loops, and ultimately deliver high-quality code more rapidly. In this blog post, we'll explore strategies to effectively manage and reduce coding time to boost your team's productivity and success.
Cycle time measures the total elapsed time taken to complete a specific task or work item from the beginning to the end of the process.
Longer cycle time leads to delayed project deliveries and hinders overall development efficiency. On the other hand, Short cycle time enables faster feedback, quicker adjustments, and more efficient development, leading to accelerated project deliveries and improved productivity.
Measuring cycle time provides valuable insights into the efficiency of a software engineering team's development process. Below are some of how measuring cycle time can be used to improve engineering team efficiency:
Coding time is the time it takes from the first commit to a branch to the eventual submission of a pull request. It is a crucial part of the development process where developers write and refine their code based on the project requirements. High coding time can lead to prolonged development cycles, affecting delivery timelines. Managing the coding time efficiently is essential to ensure the code completion is done on time with quicker feedback loops and a frictionless development process.
To achieve continuous improvement, it is essential to divide the work into smaller, more manageable portions. Our research indicates that on average, teams require 3-4 days to complete a coding task, whereas high-performing teams can complete the same task within a single day.
In the Typo platform, If your coding time is high, your main dashboard will display the coding time as red.


Benchmarking coding time helps teams identify areas where developers may be spending excessive time, allowing for targeted improvements in development processes and workflows. It also enables better resource allocation and project planning, leading to increased productivity and efficiency.
Identify the delay in the “Insights” section at the team level & sort the teams by the cycle time.
Click on the team to deep dive into the cycle time breakdown of each team & see the delays in the coding time.
There are broadly three main causes of high coding time
Frequently, a lengthy coding time can suggest that the tasks or assignments are not being divided into more manageable segments. It would be advisable to investigate repositories that exhibit extended coding times for a considerable number of code changes. In instances where the size of a PR is substantial, collaborating with your team to split assignments into smaller, more easily accomplishable tasks would be a wise course of action.
“Commit small, commit often”
While working on an issue, you may encounter situations where seemingly straightforward tasks unexpectedly grow in scope. This may arise due to the discovery of edge cases, unclear instructions, or new tasks added after the assignment. In such cases, it is advisable to seek clarification from the product team, even if it may take longer. Doing so will ensure that the task is appropriately scoped, thereby helping you complete it more effectively
There are occasions when a task can prove to be more challenging than initially expected. It could be due to a lack of complete comprehension of the problem, or it could be that several "unknown unknowns" emerged, causing the project to expand beyond its original scope. The unforeseen difficulties will inevitably increase the overall time required to complete the task.
When a developer has too many ongoing projects, they are forced to frequently multitask and switch contexts. This can lead to a reduction in the amount of time they spend working on a particular branch or issue, increasing their coding time metric.
Use the work log to understand the dev’s commits over a timeline to different issues. If a developer makes sporadic contributions to various issues, it may be indicative of frequent context switching during a sprint. To mitigate this issue, it is advisable to balance and rebalance the assignment of issues evenly and encourage the team to avoid multitasking by focusing on one task at a time. This approach can help reduce coding time.

Set goals for the work at risk where the rule of thumb is keeping the PR with less than 100 code changes & refactor size as above 50%.
To achieve the team goal of reducing coding time, real-time Slack alerts can be utilised to notify the team of work at risk when large and heavily revised PRs are published. By using these alerts, it is possible to identify and address issues, story-points, or branches that are too extensive in scope and require breaking down.
To manage workloads and assignments effectively, it is recommended to develop a habit of regularly reviewing the Insights tab, and identifying long PRs on a weekly or even daily basis. Additionally, examining each team member's workload can provide valuable insights. By using this data collaboratively with the team, it becomes possible to allocate resources more effectively and manage workloads more efficiently.
Using a framework, such as React or Angular, can help reduce coding time by providing pre-built components and libraries that can be easily integrated into the application
Reusing code that has already been written can help reduce coding time by eliminating the need to write code from scratch. This can be achieved by using code libraries, modules, and templates.
Rapid prototyping involves creating a quick and simple version of the application to test its functionality and usability. This can help reduce coding time by allowing developers to quickly identify and address any issues with the application.
Agile methodologies, such as Scrum and Kanban, emphasize continuous delivery and feedback, which can help reduce coding time by allowing developers to focus on delivering small, incremental improvements to the application
Pair programming involves two developers working together on the same code at the same time. This can help reduce coding time by allowing developers to collaborate and share ideas, which can lead to faster problem-solving and more efficient coding.
Optimizing coding time, a key component of the overall cycle time enhances development efficiency and accelerates project delivery. By focusing on reducing coding time, software development teams can streamline their workflows and achieve quicker feedback loops. This leads to a more efficient development process and timely project completions. Implementing strategies such as dividing tasks into smaller segments, clarifying requirements, minimizing multitasking, and using effective tools and methodologies can significantly improve both coding time and cycle time.

Software engineering teams are the engine that drives your product forward. They write clean, efficient code, gather and analyze requirements, design system architecture and components, and build high-quality products. And since the tech industry is ever-evolving, it is crucial to understand how well they are performing and what needs to be fixed.
This is where software development analytics tools come in. These tools provide insights into various metrics related to the development workflow, measure progress, and help to make informed decisions.
One such tool is Waydev that is used by development teams across the globe. While this is usually the best choice for the organizations, there might be chances that it doesn’t work for you.
We’ve curated the top 5 Waydev alternatives that you can consider when selecting engineering analytics tools for your company.
Waydev is a leading software development analytics platform that puts more emphasis on market-based metrics. It allows development teams to compare the ROI of specific products to identify which features need improvement or removal. It also gives insights into the cost and progress of deliverables and key initiatives. Waydev can be seamlessly integrated with Github, Gitlab, CircleCI, Azure DevOps, and other popular tools.
However, this analytics tool can be expensive, particularly for smaller teams or startups and may lack certain functionalities, such as detailed insights into pull request statistics or ticket activity.

A few of the best Waydev alternatives are:
Typo is a software engineering analytics platform that offers SDLC visibility, actionable insights, and workflow automation for building high-performing software teams. It tracks essential DORA and other engineering metrics to assess their performance and improve DevOps practices. It allows engineering leaders to analyze sprints with detailed insights on tasks and scope and provides an AI-powered team insights summary. Typo’s built-in automated code analysis helps find real-time issues and hotspots across the code base to merge clean, secure, high-quality code, faster. With its holistic framework to capture developer experience, Typo helps understand how devs are doing and what can be done to improve their productivity. Its pre-built integration in the dev tool stack can highlight developer blockers, predict sprint delays, and measure business impact.

LinearB is another software delivery intelligence platform that provides insights to help engineering teams identify bottlenecks and improve software development workflow. It highlights automatable tasks to save time and resources and enhance developer productivity. It provides real-time alerts to development teams regarding project risks, delays, and dependencies and allows teams to create customized dashboards for tracking various engineering metrics such as cycle time and DORA metrics. LinearB’s project delivery forecast alerts the team to stay on schedule and communicate project delivery status updates. It can also be integrated with third-party applications such as Jira, Slack, Shortcut, and other popular tools.

Jellyfish is an engineering management platform that aligns engineering data with business priorities. provides real-time visibility into engineering work quickly and allows the team members to track key metrics such as PR statuses, code commits, and overall project progress. It can be integrated with various development tools such as GitHub, GitLab, JIRA, and other third-party applications. Jellyfish offers multiple perspectives on resource allocation and helps track investments made during product development. It also generates reports tailored for executives and finance teams, including insights into R&D capitalization and engineering efficiency.

Swarmia is an engineering effectiveness platform that provides visibility into three key areas: business outcome, developer productivity, and developer experience. Its working agreement feature includes 20+ work agreements, allowing teams to adopt and measure best practices from high-performing teams. It tracks healthy engineering measures and provides insights into the development pipeline. Swarmia’s Investment balance gives insights into the purpose of each action and money spent by the company on each category. It can be integrated with tech tools like source code hosting, issue trackers, and chat systems.

Pluralsight Flow, a software development analytics platform, aggregates GIT data into comprehensive insights. It gathers important engineering metrics such as DORA metrics, code commits, and pull requests, all displayed in a centralized dashboard. It can be integrated with manual and automated testing such as Azure DevOps and GitLab. Pluralsight Flow offers a comprehensive view of team health, allowing engineering leaders to proactively diagnose issues. It also sends real-time alerts to keep teams informed about critical changes and updates in their workflows.
Picking the right analytics tool is important for the software engineering team. Check out these essential factors below before you make a purchase:
Consider how the tool can accommodate the team’s growth and evolving needs. It should handle increasing data volumes and support additional users and projects.
Error detection feature must be present in the analytics tool as it helps to improve code maintainability, mean time to recovery, and bug rates.
Developer analytics tools must compile with industry standards and regulations regarding security vulnerabilities. It must provide strong control over open-source software and indicate the introduction of malicious code.
These analytics tools must have user-friendly dashboards and an intuitive interface. They should be easy to navigate, configure, and customize according to your team’s preferences.
Software development analytics tools must be seamlessly integrated with your tech tools stack such as CI/CD pipeline, version control system, issue tracking tools, etc.
Given above are a few Waydev competitors. Conduct thorough research before selecting the analytics tool for your engineering team. Check whether it aligns well with your requirements. It must enhance team performance, improve code quality and reduce technical debt, drive continuous improvement in your software delivery and development process, integrate seamlessly with third-party tools, and more.
All the best!

As an engineering leader, showcasing your team’s efficiency and alignment with business goals can be challenging. DevOps metrics and KPIs are essential tools that provide clear insights into your team’s performance and the effectiveness of your DevOps practices.
Tracking the right metrics allows you to measure the DevOps processes’ success, identify areas for improvement, and ensure that your software delivery meets high standards.
In this blog post, let’s delve into key DevOps metrics and KPIs to monitor to optimize your DevOps efforts and enhance organizational performance.
DevOps metrics showcase the performance of the DevOps software development pipeline. These metrics bridge the gap between development and operations and measure and optimize the efficiency of processes and people involved. Tracking DevOps metrics enables DevOps teams to quickly identify and eliminate bottlenecks, streamline workflows, and ensure alignment with business objectives.
DevOps KPIs are specific, strategic metrics to measure progress towards key business goals. They assess how well DevOps practices align with and support organizational objectives. KPIs also provide insight into overall performance and help guide decision-making.
Measuring DevOps metrics and KPIs is beneficial for various reasons:
There are many DevOps metrics available. Focus on the key performance indicators that align with your business needs and requirements.
A few important DevOps metrics and KPIs are:
Deployment Frequency measures how often the code is deployed to production. It considers everything from bug fixes and capability improvements to new features. It monitors the rate of change in software development, highlights potential issues, and is a key indicator of agility and efficiency. High deployment Frequency indicates regular deployments and a streamlined pipeline, allowing teams to deliver features and updates faster.
Lead Time for Changes is a measure of time taken by code changes to move from inception to deployment. It tracks the speed and efficiency of software delivery and provides valuable insights into the effectiveness of development processes, deployment pipelines, and release strategies. Short lead times allow new features and improvements to reach users quickly and enable organizations to test new ideas and features.
This DevOps metric tracks the percentage of newly deployed changes that caused failure or glitches in production. It reflects reliability and efficiency and relates to team capacity, code complexity, and process efficiency, impacting speed and quality. Tracking CFR helps identify bottlenecks, flaws, or vulnerabilities in processes, tools, or infrastructure that can negatively affect the software delivery’s quality, speed, and cost.

Mean Time to Recovery measures the average time a system or application takes to recover from any failure or incident. It highlights the efficiency and effectiveness of an organization’s incident response and resolution procedures. Reduced MTTR minimizes system downtime, faster recovery from incidents, and identifies and addresses potential issues quickly.
Cycle Time metric measures the total elapsed time taken to complete a specific task or work item from the beginning to the end of the process. Measuring cycle time can provide valuable insights into the efficiency and effectiveness of an engineering team's development process. These insights can help assess how quickly the team can turn around tasks and features, identify trends and failures, and forecast how long future tasks will take.
Mean Time to Detection is a key performance indicator that tracks how long the DevOps team takes to identify issues or incidents. High time to detect results in bottlenecks that may interrupt the entire workflow. On the other hand, shorter MTTD indicates issues are identified rapidly, improving incident management strategies and enhancing overall service quality.
Defect Escape Rate tracks how many issues slipped through the testing phase. It monitors how often defects are uncovered in the pre-production vs. production phase. It highlights the effectiveness of the testing and quality assurance process and guides improvements to improve software quality. Reduced Defect Escape Rate helps maintain customer trust and satisfaction by decreasing the bugs encountered in live environments.
Code coverage measures the percentage of a codebase tested by automated tests. It helps ensure that the tests cover a significant portion of the code, and identifies untested parts and potential bugs. It assists in meeting industry standards and compliance requirements by ensuring comprehensive test coverage and provides a safety net for the DevOps team when refactoring or updating code. Hence, they can quickly catch and address any issues introduced by changes to the codebase.

Work in Progress represents the percentage breakdown of Issue tickets or Story points in the selected sprint according to their current workflow status. It monitors and manages workflow within DevOps teams. It visualizes their workload, assesses performance, and identifies bottlenecks in the dev process. Work in Progress enables how much work the team handles at a given time and prevents them from being overwhelmed.
Unplanned work tracks any unexpected interruptions or tasks that arise and prevents engineering teams from completing their scheduled work. It helps DevOps teams understand the impact of unplanned work on their productivity and overall workflow and assists in prioritizing tasks based on urgency and value.
PR Size tracks the average number of lines of code added and deleted across all merged pull requests (PRs) within a specified time period. Measuring PR size provides valuable insights into the development process, helps development teams identify bottlenecks, and streamline workflows. Breaking down work into smaller PRs encourages collaboration and knowledge sharing among the DevOps team.

Error Rates measure the number of errors encountered in the platform. It identifies the stability, reliability, and user experience of the platform. Monitoring error rates help ensure that applications meet quality standards and function as intended otherwise it can lead to user frustration and dissatisfaction.
Deployment time measures how long it takes to deploy a release into a testing, development, or production environment. It allows teams to see where they can improve deployment and delivery methods. It enables the development team to identify bottlenecks in the deployment workflow, optimize deployment steps to improve speed and reliability, and achieve consistent deployment times.
Uptime measures the percentage of time a system, service, or device remains operational and available for use. A high uptime percentage indicates a stable and robust system. Constant uptime tracking maintains user trust and satisfaction and helps organizations identify and address issues quickly that may lead to downtime.
Typo is one of the effective DevOps tools that offer SDLC visibility, developer insights, and workflow automation to deliver high-quality software to end-users. It can seamlessly integrate into tech tool stacks such as GIT versioning, issue tracker, and CI/CD tools. It also offers comprehensive insights into the deployment process through key metrics such as change failure rate, PR size, code coverage, and deployment frequency. Its automated code review tool helps identify issues in the code and auto-fixes them before you merge to master.
DevOps metrics are vital for optimizing DevOps performance, making data-driven decisions, and aligning with business goals. Measuring the right key indicators can gain insights into your team’s efficiency and effectiveness. Choose the metrics that best suit the organization’s needs, and use them to drive continuous improvement and achieve your DevOps objectives.

Software development performance metrics are quantitative measurements that show how well software projects and teams are performing across productivity, quality, efficiency, and process effectiveness. This guide is for software engineers, team leads, and managers seeking to improve software delivery through data-driven insights. Understanding these metrics is essential for improving team productivity, software quality, and aligning engineering with business goals. Key performance metrics in software development track productivity and quality, helping teams monitor progress and improve outcomes. Software development metrics include productivity, quality, and collaboration categories. This article breaks down the main categories of software development metrics, including process metrics, performance metrics, code quality metrics, focus metrics, test metrics, productivity metrics, operational metrics, and security metrics, so teams can use data to evaluate results and make practical process improvements.
Software development metrics are crucial for ensuring that projects progress as planned, identifying bottlenecks, and maintaining high standards of quality and efficiency. Regularly reviewing and analyzing these metrics allows teams to optimize processes, allocate resources effectively, and align software delivery with user needs and business objectives.
By understanding the importance of these metrics, teams can better appreciate how each category contributes to overall project success. Next, we’ll explore the main categories of software development metrics in detail.
Process Metrics are quantitative measurements that evaluate the efficiency and effectiveness of processes within an organization. Key software development metrics are used to track workflow efficiency, productivity, and quality. They assess how well processes are performing and identify areas for improvement, which organizations use to improve delivery speed and software quality.
Development Velocity is the amount of work completed by a software development team during a specific iteration or sprint. It is typically measured in terms of story points, user stories, or other units of work. This metric helps in sprint planning and allows teams to track their performance over time.
Lead Time for Changes measures the time taken by code changes to move from inception to deployment. It tracks the speed and efficiency of software delivery and provides valuable insights into the effectiveness of development processes, deployment pipelines, and release strategies.
Cycle Time measures the total elapsed time taken to complete a specific task or work item from the beginning to the end of the process. These cycle time measures show how quickly work moves through delivery, while throughput indicates the total number of tasks completed over a specific timeframe as a complementary view of flow. It helps assess how quickly the team can turn around tasks and features, identify trends and failures, and forecast how long future tasks will take.

Change Failure Rate measures the percentage of newly deployed changes that caused failure or glitches in production. It reflects reliability and efficiency and relates to team capacity, code complexity, and process efficiency, hence, impacting speed and quality. This metric also helps teams maintain code quality by showing how often releases introduce failures.
Process metrics provide foundational insights into workflow efficiency and delivery speed. Next, let’s examine performance metrics that help teams evaluate how well they are meeting their goals.
Performance metrics quantitatively measure how well an individual, team, or organization performs in various aspects of their operations. Key performance metrics in software development track productivity and quality. In software teams, specific metrics support evaluating performance and tracking development performance, and they often include developer productivity metrics alongside DORA metrics, which are industry standards for benchmarking DevOps performance. They offer insights into how well goals and objectives are being met and highlight potential bottlenecks, while balancing various metrics gives a clearer view of delivery speed, quality, and productivity.
Deployment Frequency tracks how often the code is deployed to production. It measures the rate of change in software development and highlights potential issues. A key indicator of agility and efficiency, regular deployments indicate a streamlined pipeline, which further allows teams to deliver features and updates faster.
Mean Time to Restore measures the average time taken by a system or application to recover from any failure or incident, making it a crucial metric for service continuity because it shows how quickly issues are resolved. It highlights the efficiency and effectiveness of an organization's incident response and resolution procedures.
Performance metrics help teams understand their ability to deliver reliable software quickly. Next, we’ll look at code quality metrics that ensure the maintainability and stability of your codebase.

Code Quality Metrics measure various aspects of the code quality within a software development project such as readability, maintainability, performance, and adherence to best practices. These metrics help teams maintain high standards and reduce technical debt.
Code coverage measures the percentage of a codebase that is tested; this metric determines how much of the source code is exercised by automated testing. It becomes especially important during refactoring to preserve code health, helping ensure that tests cover a significant portion of the code while identifying untested parts and potential bugs.
Code churn measures the frequency of changes made to a specific piece of code, such as a file, class, or function during development. High code churn suggests frequent modifications and potential instability, while low code churn usually reflects a more stable codebase but could also signal slower development progress. Unusually high churn can also indicate instability in code written and should be reviewed for maintainability risks.
By monitoring code quality metrics, teams can proactively address issues before they escalate. The next section covers focus metrics, which help teams target specific improvement areas.
Focus Metrics are KPIs that organizations prioritize to target specific areas of their operations or processes for improvement. They address particular challenges or goals within software development projects or organizations and offer detailed insights into targeted areas.
Developer Workload represents the count of Issue tickets or Story points completed by each developer against the total Issue tickets/Story points assigned to them in the current sprint. It helps to understand how much work developers are handling, and is crucial for balancing workloads, improving productivity, and preventing burnout.

Work in Progress represents the percentage breakdown of Issue tickets or Story points in the selected sprint according to their current workflow status. It highlights how much work the team handles at a given time, which further helps to maintain a smooth and productive workflow. Clear visibility into work in progress also improves resource allocation across the engineering team.
Customer Satisfaction tracks how happy or content customers are with a product, service, or experience. It usually involves customer satisfaction metrics such as Customer Satisfaction (CSAT) and Net Promoter Score (NPS) to measure user feedback and analyze that data to understand their satisfaction level.
Technical Debt metrics measure and manage the cost and impact of technical debt in the software development lifecycle. It helps to ensure that the most critical issues are addressed first, provides insights into the cost associated with maintaining and fixing technical debt, and identifies areas of the codebase that require improvement. Teams can also tie debt reduction to business value and business outcomes through avoided cost or ROI—for example, a $500K platform migration can save $1.5M in avoided costs, resulting in 200% ROI. They may also compare investment impact with hard data such as revenue per engineer, calculated as total revenue divided by the number of engineers.
Focus metrics allow teams to zero in on specific challenges and opportunities. Next, we’ll discuss test metrics that ensure software reliability and robustness.
Test metrics help teams assess the effectiveness of their testing processes and the quality of their software. These metrics are essential for identifying gaps in test coverage and improving overall software reliability.
Test coverage measures the percentage of the codebase or features covered by tests. It ensures that tests are comprehensive and can identify potential issues within the codebase, which further improves quality and reduces bugs.
Defect Density measures the number of defects found per unit of code or functionality (e.g., defects per thousand lines of code). It helps to assess the code quality and the effectiveness of the testing process.
Test Automation Rate tracks the proportion of test cases that are automated compared to those that are manual. It offers insight into the extent to which automation is integrated into the testing process and assesses the efficiency and effectiveness of testing practices. CI/CD practices also automate build, test, and deployment processes, reducing manual errors in software delivery.
Test metrics provide a clear picture of software quality and testing efficiency. The following section covers productivity metrics, which help teams measure and improve their output.
Productivity metrics help teams measure developer productivity and assess overall development team performance. Productivity metrics provide insights into various aspects of productivity. These developer productivity metrics help teams gain valuable insights for continuous improvement.
Code Review Time measures how long it takes for code reviews to be completed from the moment a Pull Request or code change is submitted until it is approved and merged. Code review metrics often include pull request size and review time. Regular and timely reviews foster better collaboration between team members, contribute to higher code quality by catching issues early, and ensure adherence to coding standards. In organizations that do it well, regular code reviews support knowledge sharing and can raise team-based developer productivity by 31%.
Sprint Burndown tracks the amount of work remaining in a sprint versus time for scrum teams. It helps development teams visualize progress and productivity throughout a sprint, helps identify potential issues early, and stay focused, especially when combined with DORA metrics for Scrum team performance.
Productivity metrics enable teams to continuously improve their workflow and output. Next, we’ll look at operational metrics that monitor the health and stability of software systems.
Operational Metrics are key performance indicators that provide insights into operational performance aspects, such as productivity, efficiency, and quality. They focus on the routine activities and processes that drive business operations and help to monitor, manage, and optimize operational performance.
Incident Frequency tracks how often incidents or outages occur in a system or service. It helps to understand and mitigate disruptions in system operations. High Incident Frequency indicates frequent disruptions, while low incident frequency suggests a stable system but requires verification to ensure incidents aren't underreported. It can be complemented with DORA DevOps metrics in large organizations to understand broader delivery performance.
Error Rate measures the frequency of errors occurring in the system, typically expressed as errors per transaction, request, or unit of time. It helps gauge system reliability and quality and highlights issues in performance or code that need addressing to improve overall stability, especially when interpreted alongside core DORA metrics like change failure rate and recovery time.
Mean Time Between Failures tracks the average time between system failures. It signifies how often the failures are expected to occur in a given period. High MTBF indicates that the software is less reliable and needs less frequent maintenance.
Operational metrics help teams maintain system stability and reliability. The next section focuses on security metrics, which are vital for protecting software and data.
Security Metrics evaluate the effectiveness of an organization's security posture and its ability to protect information and systems from threats. They provide insights into understanding how well security measures function, identify vulnerabilities, and security control effectiveness and can feed into broader software engineering benchmark metrics across teams.
Mean Time to Detect tracks how long a team takes to detect threats. The longer the threat is unidentified, the higher the chance of an escalated problem. MTTD helps minimize the issues' impact in the early stages and refine monitoring and alert processes.
Number of Vulnerabilities measures the total vulnerabilities identified in the codebase. It assesses the system's security posture, and remediation efforts and provides insights into the impact of security practices and tools.
Mean Time to Patch reflects the time taken to fix security vulnerabilities, software bugs, or other security issues. It assesses how quickly an organization can respond and manage vulnerabilities in the software delivery processes.
Security metrics ensure that software remains secure and resilient against threats. Finally, let’s summarize the key takeaways from using software development performance metrics.
Software development metrics play a vital role in aligning engineering progress with business goals and helping engineering leaders communicate progress with hard results. These metrics help guide software engineers in making data-driven decisions and process improvements and ensure that projects progress smoothly, boost team performance, meet user needs, and drive overall success. Agile practices emphasize iterative development and continuous improvement, while Lean principles focus on eliminating waste and optimizing flow. Regularly analyzing these data points optimizes development processes, strengthens software development practices, manages technical debt, and ultimately delivers high-quality software to the end-users. These approaches matter because companies in the top quartile of the Developer Velocity Index outperform others by four to five times.

Software development is an ever-evolving field that thrives on teamwork, collaboration, and productivity. Many organizations have started shifting towards DORA indicators and metrics to measure their development processes, as these metrics are considered the golden standards of software delivery performance.
This article is for software engineering leaders, DevOps practitioners, and development teams looking to understand and improve their DORA indicators. We will cover what DORA indicators are, common symptoms of poor performance, and strategies for improvement.
DORA (DevOps Research and Assessment) indicators are a standardized set of metrics developed by Google to measure the performance and health of software development teams, and serve as a comprehensive framework for understanding software delivery performance. These indicators are grouped into two main categories: Speed (Throughput) and Stability (Reliability). The four main DORA indicators are:
DORA stands for DevOps Research and Assessment. DORA indicators are a standardized set of metrics developed by Google to measure the performance and health of software development teams. These indicators are categorized into two main groups: Speed (Throughput) and Stability (Reliability).
These four DORA metrics help organizations evaluate process performance, benchmark against industry standards, and gain clearer business insights from engineering work, especially when teams focus on mastering the implementation and optimization of DORA metrics. In 2021, the DORA Team added Reliability as a fifth metric, focusing on how well user expectations are met, such as availability and performance.
Now that we've defined the DORA indicators, let's explore the common signs and symptoms that can negatively impact these metrics.
Deployment Frequency measures how often a team successfully deploys code to the production environment. Elite teams may do so multiple times per day. More frequent deployments help teams collect feedback sooner and iterate faster, making it a cornerstone of using DORA DevOps metrics to improve efficiency.
Lead Time for Changes measures how long it takes for code to go from commit to running in production.
Change Failure Rate indicates the percentage of changes that result in failures, including degraded service or deployments that require remediation.
Mean Time to Restore Service measures the average time to restore service after a failed deployment or incident.
Implementing DORA metrics often means combining version control, CI/CD, and observability data, which can be challenging across multiple teams.
Typo is a powerful software engineering platform that enhances SDLC visibility, provides developer insights, and automates workflows to help you build better software faster by aligning DevOps practices with DORA metrics to improve software delivery. Key features include:
DORA metrics are essential for evaluating software delivery performance. Teams can focus on one metric when needed, but together these measures support a clear DORA metrics focus and provide a more complete picture of DevOps performance and business outcomes. Addressing underlying issues affecting these metrics, such as high deployment frequency or lengthy change lead time, can lead to significant improvements in software quality and team efficiency, with smaller, faster changes helping keep the delivery process fast and reliable.
Use tools like Typo to gain deeper insights and benchmarks, enabling more effective performance enhancements. For DevOps teams, improving DORA metrics is an ongoing journey.

The SPACE framework is a multidimensional approach to understanding and measuring developer productivity. Since the teams are increasingly distributed and users demand efficient and high-quality software, the SPACE framework provides a structured way to assess productivity beyond traditional metrics.
In this blog post, we highlight the importance of the SPACE framework dimensions for software teams and explore its components, benefits, and practical applications.
The SPACE framework is a multidimensional approach to measuring developer productivity. Below are five SPACE framework dimensions:
By examining these dimensions, the SPACE framework provides a comprehensive view of developer productivity that goes beyond traditional metrics.
The SPACE productivity framework is important for software development teams because it provides an in-depth understanding of productivity, significantly improving both team dynamics and software quality. Here are specific insights into how the SPACE framework benefits software teams:
Focusing on satisfaction and well-being allows software engineering leaders to create a positive work environment. It is essential to retain top talent as developers who feel valued and supported are more likely to stay with the organization.
Metrics such as employee satisfaction surveys and burnout assessments can highlight potential bottlenecks. For instance, if a team identifies low satisfaction scores, they can implement initiatives like team-building activities, flexible work hours, or mental health resources to increase morale.
Emphasizing performance as an outcome rather than just output helps teams better align their work with business goals. This shift encourages developers to focus on delivering high-quality code that meets customer needs.
Performance metrics might include customer satisfaction ratings, bug counts, and the impact of features on user engagement. For example, a team that measures the effectiveness of a new feature through user feedback can make informed decisions about future development efforts.
The activity dimension provides valuable insights into how developers spend their time. Tracking various activities such as coding, code reviews, and collaboration helps in identifying bottlenecks and inefficiencies in their processes.
For example, if a team notices that code reviews are taking too long, they can investigate the reasons behind the delays and implement strategies to streamline the review process, such as establishing clearer guidelines or increasing the number of reviewers.
Effective communication and collaboration are crucial for successful software development. The SPACE framework fosters teams to assess their communication practices and identify potential bottlenecks.
Metrics such as the speed of integrating work, the quality of peer reviews, and the discoverability of documentation reveal whether team members are able to collaborate well. Suppose, the team finds that onboarding new members takes too long. To improvise, they can enhance their documentation and mentorship programs to facilitate smoother transitions.
The efficiency and flow dimension focuses on minimizing interruptions and maximizing productive time. By identifying and addressing factors that disrupt workflow, teams can create an environment conducive to deep work.
Metrics such as the number of interruptions, the time spent in value-adding activities, and the lead time for changes can help teams pinpoint inefficiencies. For example, a team may discover that frequent context switching between tasks is hindering productivity and can implement strategies like time blocking to improve focus.
The SPACE framework promotes alignment between team efforts and organizational objectives. Measuring productivity in terms of business outcomes can ensure that their work contributes to overall success.
For instance, if a team is tasked with improving user retention, they can focus their efforts on developing features that enhance the user experience. They can further measure their impact through relevant metrics.
The rise of remote and hybrid models results in evolvement in the software development landscape. The SPACE framework offers the flexibility to adapt to new challenges.
Teams can tailor their metrics to the unique dynamics of their work environment. So, they remain relevant and effective. For example, in a remote setting, teams might prioritize communication metrics so that collaboration remains strong despite physical distance.
Implementing the SPACE framework encourages a culture of continuous improvement within software development teams. Regularly reviewing productivity metrics and discussing them openly help to identify areas for growth and innovation.
It fosters an environment where feedback is valued, team members feel heard and empowered to contribute to increasing productivity.
The SPACE framework helps bust common myths about productivity, such as more activity equates to higher productivity. Providing a comprehensive view of productivity that includes satisfaction, performance, and collaboration can avoid the pitfalls of relying on simplistic metrics. Hence, fostering a more informed approach to productivity measurement and management.
Ultimately, the SPACE framework recognizes that developer well-being is integral to productivity. By measuring satisfaction and well-being alongside performance and activity, teams can create a holistic view of productivity that prioritizes the health and happiness of developers.
This focus on well-being not only enhances individual performance but also contributes to a positive team culture and overall organizational success.
Implementing the SPACE framework effectively requires a structured approach. It blends the identification of relevant metrics, the establishment of baselines, and the continuous improvement culture. Here’s a detailed guide on how software teams can adopt the SPACE framework to enhance their productivity:
To begin, teams must establish specific, actionable metrics for each of the five dimensions of the SPACE framework. This involves not only selecting metrics but also ensuring they are tailored to the team’s unique context and goals. Here are some examples for each dimension:

Once metrics are defined, teams should establish baselines for each metric. This involves collecting initial data to understand current performance levels. For example, a team measures the time taken for code reviews. They should gather data over several sprints to determine the average time before setting improvement goals.
Setting SMART (Specific, Measurable, Achievable, Relevant, Time-bound) goals based on these baselines enables teams to track progress effectively. For instance, if the average code review time is currently two days, a goal might be to reduce this to one day within the next quarter.
Foster a culture of open communication for the SPACE framework to be effective. Team members should feel comfortable discussing productivity metrics and sharing feedback. A few of the ways to do so include conducting regular team meetings where metrics are reviewed, challenges are addressed and successes are celebrated.
Encouraging transparency around metrics helps illustrate productivity measurements and ensures that all team members understand the rationale behind them. For instance, developers are aware that a high number of pull requests is not the sole indicator of productivity. This allows them to feel less pressure to increase activity without considering quality.
The SPACE framework's effectiveness relies on two factors: continuous evaluation and adaptation of the chosen metrics. Scheduling regular reviews (e.g., quarterly) allows to assess whether the metrics are providing meaningful insights and they need to be adjusted.
For example, a metric for measuring developer satisfaction reveals consistently low scores. Hence, the team should investigate the underlying causes and consider implementing changes, such as additional training or resources.
To ensure that the SPACE framework is not just a theoretical exercise, teams should integrate the metrics into their daily workflows. This can be achieved through:
Implementing the SPACE framework should be viewed as an ongoing journey rather than a one-time initiative. Encourage a culture of continuous learning where team members are motivated to seek out knowledge and improve their practices.
This can be facilitated through:
Utilizing technology tools can streamline the implementation of the SPACE framework. Tools that facilitate project management, code reviews, and communication can provide valuable data for the defined metrics. For example:
While the SPACE framework focuses on the importance of satisfaction and well-being, software teams should actively measure the impact of their initiatives on these dimensions. A few of the ways include follow-up surveys and feedback sessions after implementing changes.
Suppose, a team introduces mental health days. They should assess whether this leads to increased satisfaction scores or reduced burnout levels in subsequent surveys.
Recognizing and appreciating software developers helps to maintain morale and motivation within the team. The achievements should be acknowledged when teams achieve their goals related to the SPACE framework, including improved performance metrics or higher satisfaction scores.
On the other hand, when challenges arise, teams should adopt a growth mindset and view failures as opportunities for learning and improvement. Conducting post-mortems on projects that did not meet expectations helps teams identify what went wrong and how to fix it in the future.
Finally, the implementation of the SPACE productivity framework should be iterative. Teams gaining experience with the framework should continuously refine their approach based on feedback and results. It ensures that the framework remains relevant and effective in addressing the evolving needs of the development team and the organization.
Typo is a popular software engineering intelligence platform that offers SDLC visibility, developer insights, and workflow automation for building high-performing tech teams.
Here’s how Typo metrics fit into the SPACE framework's different dimensions:
Satisfaction and Well-Being: With the Developer Experience feature, which includes focus and sub-focus areas, engineering leaders can monitor how developers feel about working at the organization, assess burnout risk, and identify necessary improvements.
The automated code review tool auto-analyzes the codebase and pull requests to identify issues and auto-generate fixes before merging to master. This enhances satisfaction by ensuring quality and fostering collaboration.
Performance: The sprint analysis feature provides in-depth insights into the number of story points completed within a given time frame. It tracks and analyzes the team's progress throughout a sprint, showing the amount of work completed, work still in progress, and the remaining time. Typo’s code review tool understands the context of the code and quickly finds and fixes issues accurately. It also standardizes code, reducing the risk of security breaches and improving maintainability.
Activity: Typo measures developer activity through various metrics:
Communication & Collaboration: Code coverage measures the percentage of the codebase tested by automated tests, while code reviews provide feedback on their effectiveness. PR Merge Time represents the average time taken from the approval of a Pull Request to its integration into the main codebase.
Efficiency and Flow: Typo assesses this dimension through two major metrics:

By following the above-mentioned steps, dev teams can effectively implement the SPACE metrics framework to enhance productivity, improve developer satisfaction, and align their efforts with organizational goals. This structured approach not only encourages a healthier work culture but also drives better outcomes in software development.

Software teams are the driving force behind successful organizations. To maintain a competitive edge, optimizing engineering performance is paramount for engineering managers and leaders. This requires a deep understanding of development processes, engineering team velocity, identifying bottlenecks, and tracking key metrics. Engineering analytics tools play a crucial role in achieving these goals. While Pluralsight Flow (Gitprime) is a popular option, it may not be the ideal fit for every software team's unique needs and budget.
This article explores top alternatives to Pluralsight Flow (Gitprime), empowering you to make informed decisions and select the best solution for your specific requirements.
Pluralsight Flow (Gitprime) is an engineering intelligence platform designed to enhance team efficiency, developer productivity capabilities, and software delivery. Its core functionalities include providing deep insights into developer activity and collaboration metrics. Pluralsight Flow primarily concentrates on developer activity and collaboration metrics, helping teams understand how effectively they work together and where improvements can be made.
How do engineering intelligence platforms transform modern software organizations? By aggregating comprehensive datasets from project management tools, issue tracking systems, and code repositories, these sophisticated platforms revolutionize how engineering leaders gain visibility into every facet of their engineering organization. Let's explore how leveraging a wide array of engineering metrics enables teams to identify critical bottlenecks, optimize complex workflows, and make data-driven decisions that drive continuous improvement across development cycles. These solutions analyze historical patterns, predict future trends, and provide actionable insights that reshape how teams approach software delivery and resource optimization.
For engineering teams, the ability to visualize and analyze key metrics across the entire development process has become transformational for enhancing overall team performance. How do software engineering intelligence platforms like Pluralsight Flow impact organizational efficiency? These platforms enable organizations to monitor real-time project progress, track developer productivity patterns, and uncover hidden opportunities for workflow optimization through advanced analytics. By providing a comprehensive view of engineering activities, these intelligent systems empower engineering leaders to align their teams with strategic business objectives, optimize resource allocation based on data-driven insights, and ultimately deliver higher-quality software more efficiently while reducing time-to-market and development costs.
Pluralsight Flow offers a streamlined approach for engineering teams to quickly leverage a comprehensive software engineering intelligence platform. Organizations integrate their Git repositories—such as GitHub, GitLab, or Bitbucket—with Pluralsight Flow, which then automatically imports and processes engineering metrics to provide valuable insights into workflow optimization and team performance.
The onboarding process helps engineering leaders identify bottlenecks, improve workflow efficiency, and apply data-driven decisions for continuous improvement. A guided configuration enables teams to start analyzing their software engineering intelligence without delay. For evaluation, Pluralsight Flow offers a free trial to experience how actionable insights can enhance operational efficiency before moving to enterprise subscriptions.
Pluralsight Flow’s interface uses advanced engineering analytics and data visualization to track software development lifecycle metrics. Custom dashboards let teams focus on key indicators like cycle time, deployment frequency, and code quality through automated quality gates. This flexibility allows management to analyze project progress, allocate resources effectively, and align development workflows with business goals via KPI monitoring.
Real-time collaboration analytics and performance visualization help teams spot trends, monitor improvements, and optimize performance. The platform’s intuitive navigation and customizable reports support goal tracking and proactive issue resolution across multiple projects with integrated DevOps analytics.
Pluralsight Flow leverages machine learning to analyze extensive engineering performance data, enabling managers and teams to extract actionable insights from workflow patterns, cycle times, and deployment trends. AI-driven analytics predict bottlenecks, optimize resource allocation, and identify risks affecting development velocity. Custom dashboards provide real-time visualizations that support data-driven decisions and evidence-based optimizations throughout the development lifecycle.
Machine learning automates workflow analysis by detecting patterns in team productivity, communication, code reviews, and deployment pipelines. Predictive analytics allow teams to anticipate disruptions, implement preventive measures, and improve business outcomes. However, engineering leaders should assess if the platform’s algorithms align with their specific needs, as alternatives may offer different analytical approaches better suited to certain environments.
Organizations using Pluralsight Flow may face challenges such as a steep learning curve that slows adoption and delays benefits. Integration complexities can arise if the platform’s features don’t align with existing development processes or organizational structures, limiting effectiveness.
Data granularity and customization limitations can restrict the depth of actionable insights teams can extract. These factors highlight the need to evaluate whether Pluralsight Flow meets evolving engineering intelligence requirements or if migrating to platforms with greater customization and deeper analytics is necessary for optimal workflow optimization.
For teams seeking even deeper engineering metrics, tools like Jellyfish, LinearB, Waydev, Axify, or Code Climate can be considered.
Pluralsight Flow employs robust security frameworks, including role-based access control, to ensure only authorized users access sensitive engineering data. It supports enterprise-grade features like single sign-on (SSO) and advanced encryption, enabling development teams to securely analyze data while maintaining compliance with organizational and industry standards.
The platform offers extensive resources such as detailed documentation, tutorials, and webinars to help software engineers, managers, and DevOps professionals maximize its value. Its community forum facilitates knowledge sharing and collaboration among users, providing engineering leaders with insights and strategies to optimize performance and achieve business goals through data-driven approaches.
When evaluating software engineering intelligence platforms as alternatives to Pluralsight Flow, engineering leaders must conduct comprehensive analysis of platforms that deliver actionable engineering insights while supporting the complex operational requirements of modern development teams. Critical evaluation parameters include the platform's capability to construct customizable analytical dashboards, achieve seamless integration with existing toolchain ecosystems, and provide comprehensive engineering performance metrics including DORA (Deployment frequency, Lead time, Mean time to recovery, Change failure rate) indicators. Additionally, assessment should encompass the platform's proficiency in identifying workflow bottlenecks through advanced pattern recognition, tracking delivery risk factors across the software development lifecycle, and offering predictive analytics capabilities that enable proactive decision-making through data-driven forecasting models.
A robust engineering intelligence alternative must comprehensively address critical operational domains including technical debt quantification and management, code quality assessment through automated analysis, and developer experience optimization to ensure engineering teams can continuously enhance their development processes and deliverable outcomes. By implementing these rigorous evaluation criteria and conducting thorough technical assessments, engineering leaders can strategically select software engineering intelligence platforms that not only match existing operational requirements but significantly enhance team workflow efficiency, support evidence-based decision-making through advanced analytics, and maintain strategic alignment with long-term organizational objectives and business transformation goals.
While a valuable tool, Pluralsight Flow (Gitprime) may not be the best fit for every team due to several factors:
Some git analytics tools, such as AnalyticsVerse, enable teams to look at developer productivity across all five dimensions of the SPACE framework, which is not possible on Flow. Additionally, Waydev offers an 'AI Copilot' for predictive insights into delivery risks, as well as highly customizable role-based access control and integration with Microsoft Azure DevOps—features not available in Pluralsight Flow.
Many engineering leaders share concerns that their workplace tools don’t provide clear insights or support decision-making.

Let’s explore some leading flow alternatives to Pluralsight Flow (Gitprime):
Code review is a critical component of software development analytics platforms. Leading alternatives to Pluralsight Flow provide metrics and insights to improve the code review process, helping teams measure collaboration, identify blocked pull requests, and enhance overall developer productivity.
A popular software engineering intelligence platform that offers SDLC visibility, developer insights, and workflow automation. Typo seamlessly integrates with the tech stack, including Git, issue trackers, and CI/CD tools, for smooth data flow. It provides comprehensive insights into the deployment process through key DORA and other engineering metrics. Typo also features automated code tools to identify and auto-fix code issues before merging to master. Learn more about why companies choose Typo.
G2 reviews indicate decent user engagement with a strong emphasis on positive feedback, particularly regarding customer support.

A leading Git tracking tool that aligns engineering insights with business goals. Jellyfish analyzes engineer activities within development and management tools, providing a comprehensive understanding of product development. It offers real-time visibility into the engineering organization and team progress.
A popular DevOps platform that aims to improve software delivery flow and team productivity. It integrates with various development tools to collect and analyze software development data.

A tool that offers visibility into business outcomes, developer productivity, and developer experience. It provides quantitative insights into the development pipeline.
Waydev is a Git analytics platform that provides insights into engineering performance and helps teams improve their development process.

Assists the development team in tracking and improving DORA metrics. It provides a complete picture of existing and planned deployments and the effect of releases.
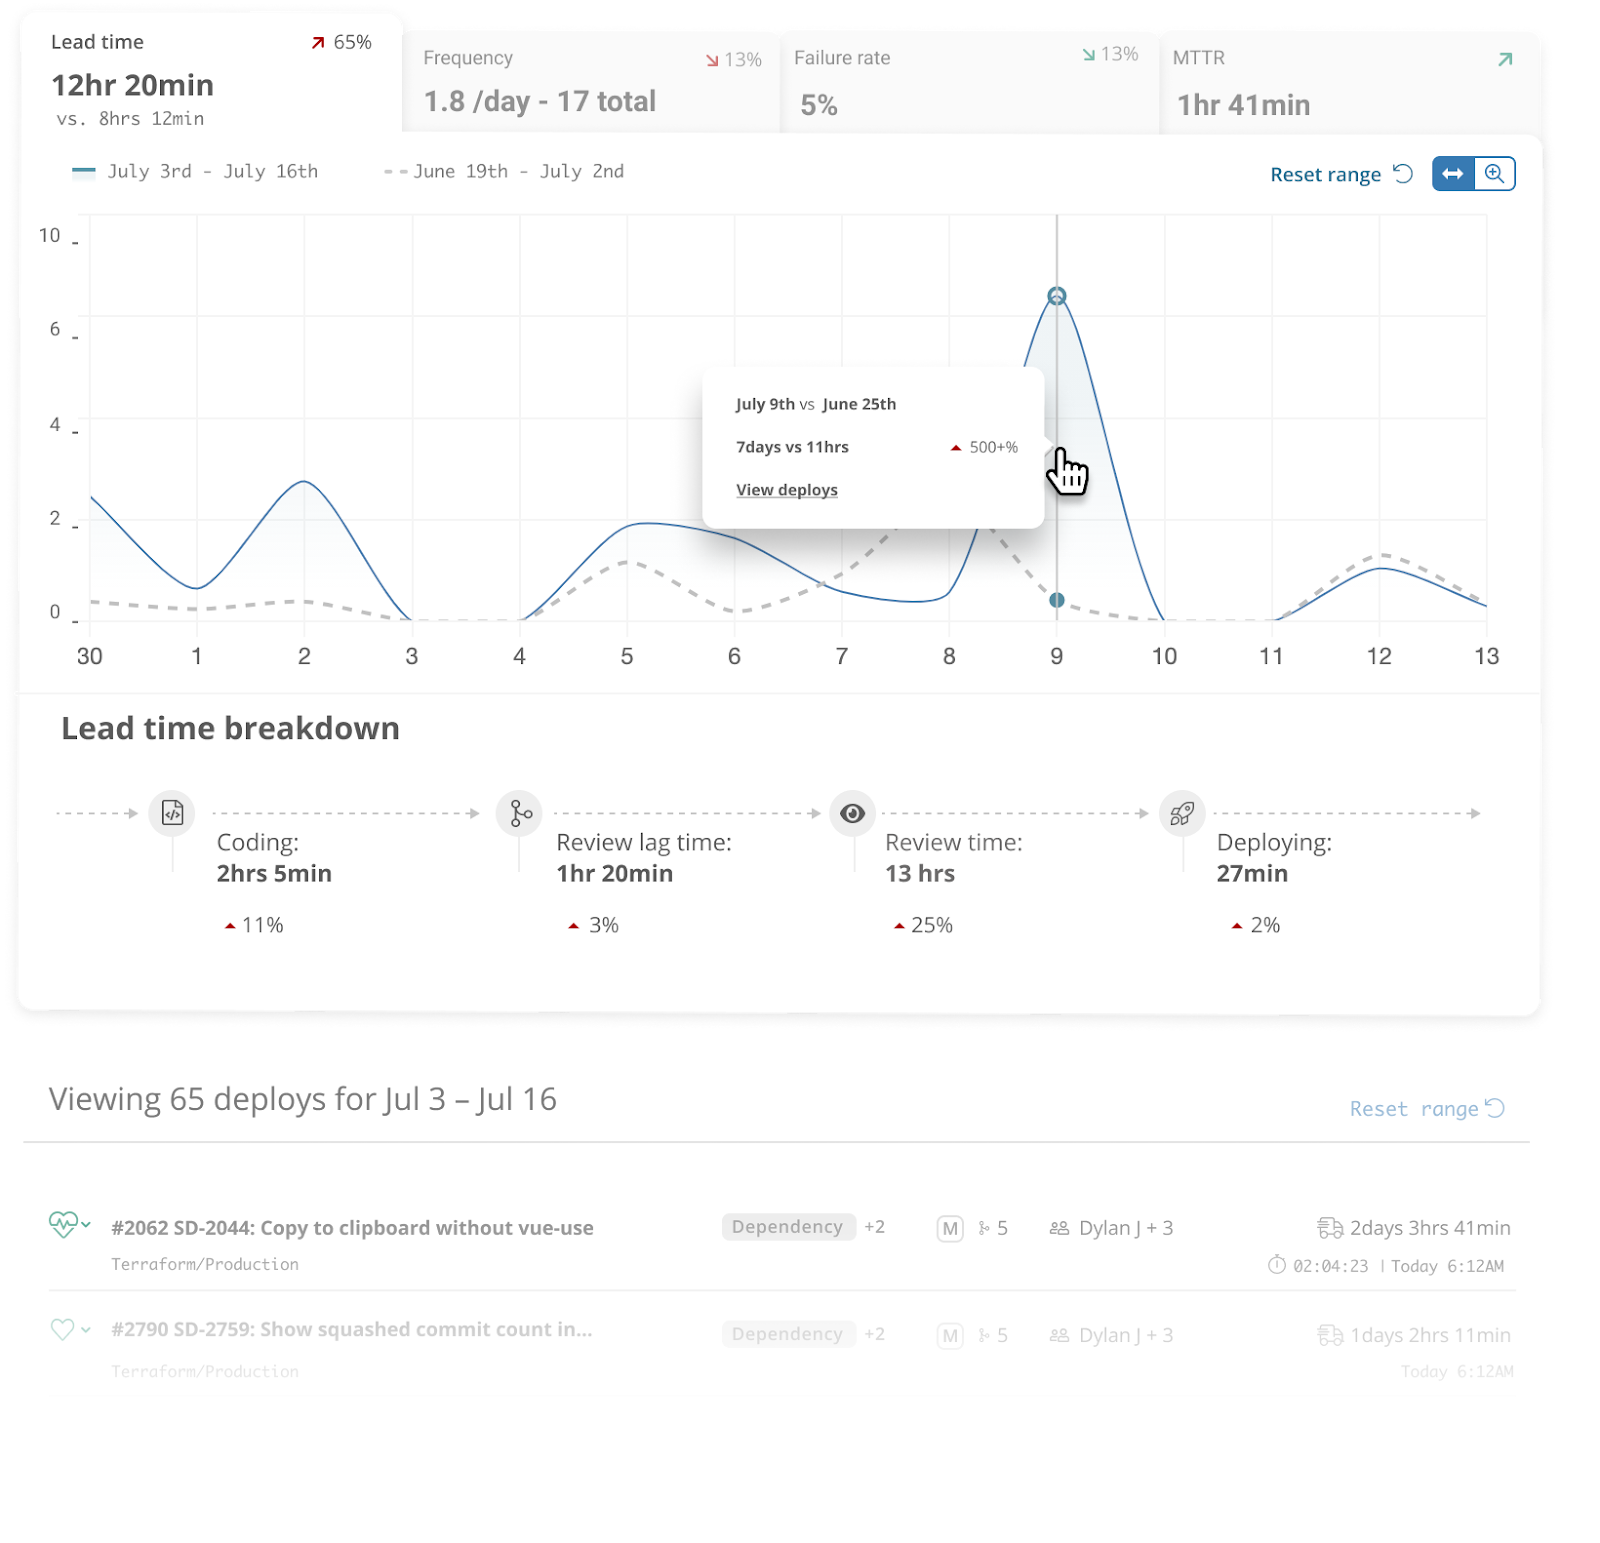
Numerous engineering organizations have demonstrated substantial optimization in operational performance metrics and development lifecycle productivity through the strategic implementation of next-generation engineering intelligence platforms and analytics frameworks. For instance, a software development team within a major enterprise-level organization leveraged an advanced platform architecture to establish comprehensive real-time observability into project execution pipelines, enabling them to rapidly identify performance bottlenecks and implement systematic resolution protocols. This strategic transformation resulted in enhanced delivery predictability and quantifiable improvements in continuous deployment frequency across their development lifecycle.
Another engineering organization, encountering challenges with workflow optimization and operational efficiency, implemented a sophisticated platform solution that provided customizable analytics dashboards and advanced data visualization capabilities. This implementation enabled them to monitor critical performance indicators (KPIs), analyze team productivity metrics, and drive continuous improvement initiatives across multiple concurrent project streams. Consequently, the team achieved superior alignment with business objectives and demonstrated measurable enhancements in overall team performance optimization.
These implementation case studies underscore the strategic value proposition of selecting appropriate engineering intelligence platform architectures. By leveraging real-time analytical insights and tailored feature sets, engineering teams can optimize their development workflows, foster cross-functional collaboration, and deliver high-quality software solutions that satisfy both technical requirements and business outcome objectives.
Engineering management platforms streamline workflows by seamlessly integrating with popular development tools like Jira, GitHub, CI/CD, Slack, and project management tools. These engineering management platforms act as comprehensive solutions that provide centralized data and insights, aligning development efforts with business goals and optimizing resource allocation. Integrating with project management tools is essential for analyzing engineering team activities, planning rollouts, tracking progress, and ensuring smooth implementation and scaling of tools. This centralized approach enables teams to efficiently manage multiple projects simultaneously, offering real-time visibility and simplifying reporting across various initiatives. For example, AllStacks empowers engineering teams to view project health and align with business objectives using machine learning to analyze data from the development process.
These integrations offer several key benefits:
By leveraging these integrations, software teams can significantly improve their productivity and focus on building high-quality products.
When selecting an alternative to Pluralsight Flow (Gitprime), several key factors should be considered:
Selecting the right engineering analytics tool is crucial for optimizing your team's performance and improving software development outcomes. By carefully considering your specific needs and exploring the alternatives presented in this article, you can find the best solution to enhance your team's efficiency and productivity.
Disclaimer: This information is for general knowledge and informational purposes only and does not constitute financial, investment, or other professional advice.

Scrum is known to be a popular methodology for software development. It concentrates on continuous improvement, transparency, and adaptability to changing requirements. Scrum teams hold regular ceremonies, including Sprint Planning, Daily Stand-ups, Sprint Reviews, and Sprint Retrospectives, to keep the process on track and address any issues.
Agile Maturity Metrics are often adopted to assess how thoroughly a team understands and implements Agile concepts. However, there are several dimensions to consider when evaluating their effectiveness.
These metrics typically attempt to quantify a team's grasp and application of Agile principles, often focusing on practices such as Test-Driven Development (TDD), vertical slicing, and definitions of "Done" and "Ready." Ideally, they should provide a quarterly snapshot of the team's Agile health.
The primary goal of Agile Maturity Metrics is to encourage self-assessment and continuous improvement. They aim to identify areas of strength and opportunities for growth in Agile practices. By evaluating different Agile methodologies, teams can tailor their approaches to maximize efficiency and collaboration.
Instead of relying solely on maturity metrics:
While Agile Maturity Metrics have their place in assessing a team’s Agile journey, they should be used in conjunction with other evaluative tools to overcome inherent limitations. Emphasizing adaptability, transparency, and honest self-reflection will yield a more accurate reflection of Agile competency and drive meaningful improvements.
Story Point Velocity is often used by Scrum teams to measure progress, but it's essential to be aware of its intrinsic limitations when considering it as a performance metric.
One major drawback is inconsistency across teams. Story Points lack a standardized value, meaning one team's interpretation can significantly differ from another's. This variability makes it nearly impossible to compare teams or aggregate their performance with any accuracy.
Story Points are most effective within a specific team over a brief period. They assist in gauging how much work might be accomplished in a single Sprint, but their reliability diminishes over more extended periods as teams may adjust their estimation models.
As teams evolve, they may choose to renormalize what a Story Point represents. This adjustment is made to reflect changes in team dynamics, skills, or understanding of the work involved. Consequently, comparing long-term performance becomes unreliable because past and present Story Points may not represent the same effort or value.
The scope of Story Points is inherently limited to within a single team. Using them outside this context for any comparative or evaluative purpose is discouraged. Their subjective nature and variability between teams prevent them from serving as a solid benchmark in broader performance assessments.
While Story Point Velocity can be a useful tool in specific scenarios, its effectiveness as a performance metric is limited by issues of consistency, short-term utility, and context restrictions. Teams should be mindful of these limitations and seek additional metrics to complement their insights and evaluations.
Understanding the distinction between bugs and stories in a Product Backlog is crucial for maintaining a streamlined and effective development process. While both contribute to the overall quality of a product, they serve unique purposes and require different methods of handling.
In summary, maintaining a clear distinction between bugs and stories isn't just beneficial; it's necessary. It allows for an organized approach to product development, ensuring that teams can address critical issues promptly while continuing to innovate and enhance. This balance is key to retaining a competitive edge in the market and ensuring ongoing user satisfaction.
When it comes to assessing Agile maturity, the focus often lands on individual perceptions of Agile concepts like TDD, vertical slicing, and definitions of "done" and "ready." While these elements seem crucial, relying heavily on self-assessment can lead to misleading conclusions. Team members may overestimate their grasp of Agile principles, while others might undervalue their contributions. This discrepancy creates an inaccurate gauge of true Agile maturity, making it a metric that can be easily manipulated and perhaps not entirely reliable.
Story point velocity is a traditional metric frequently used to track team progress from sprint to sprint. However, it fails to provide a holistic view. Teams could be investing time on bugs, spikes, or other non-story tasks, which aren’t reflected in story points. Furthermore, story points lack a standardized value across teams and time. A point in one team's context might not equate to another's, making inter-team and longitudinal comparisons ineffective. Therefore, while story points can guide workload planning within a single team's sprint, they lose their utility when used outside that narrow scope.
Evaluating quality by the number and severity of bugs introduces another problem. Assigning criticality to bugs can be subjective, and this can skew the perceived importance and urgency of issues. Different stakeholders may have differing opinions on what constitutes a critical bug, leading to a metric that is open to interpretation and manipulation. This ambiguity detracts from its value as a reliable measure of quality.
In summary, traditional metrics like Agile maturity self-assessments, story point velocity, and bug severity often fall short in effectively measuring Scrum team performance. These metrics tend to be subjective, easily influenced by individual biases, and lack standardization across teams and over time. For a more accurate assessment, it’s crucial to develop metrics that consider the unique dynamics and context of each Scrum team.
With the help of DORA DevOps Metrics, Scrum teams can gain valuable insights into their development and delivery processes.
In this blog post, we discuss how DORA metrics help boost scrum team performance.
DevOps Research and Assessment (DORA) metrics are a compass for engineering teams striving to optimize their development and operations processes.
In 2015, The DORA (DevOps Research and Assessment) team was founded by Gene Kim, Jez Humble, and Dr. Nicole Forsgren to evaluate and improve software development practices. The aim is to enhance the understanding of how development teams can deliver software faster, more reliably, and of higher quality.
Four key DORA metrics are:

Other DORA metrics can also be used to provide a more comprehensive view of software delivery performance, complementing the four metrics and helping teams balance speed and quality.
Reliability is a fifth metric that was added by the DORA research team in 2021. It is based upon how well your user’s expectations are met, such as availability and performance, and measures modern operational practices. It doesn’t have standard quantifiable targets for performance levels rather it depends upon service level indicators or service level objectives.
Organizations looking to improve their software delivery performance can implement DORA metrics to benchmark, track progress, and identify areas for improvement. DORA metrics encourage collaboration between development and operations teams, leading to the formation of multidisciplinary teams and breaking down silos between development and operations teams. By adopting the four DORA metrics, teams can make data-driven decisions to enhance both speed and stability in their DevOps practices.
Wanna Improve your Team Performance with DORA Metrics?
DORA metrics are useful for Scrum team performance because they provide key insights into the software development and delivery process. These metrics offer objective data for evaluating a team's performance and identifying areas for improvement. By helping to measure performance and enable teams to identify areas for improvement, DORA metrics drive operational performance and improve developer experience.
DORA metrics track crucial KPIs such as deployment frequency, lead time for changes, mean time to recovery (MTTR), and change failure rate, with each metric measuring a specific aspect of software delivery performance. These metric measures help Scrum teams understand their efficiency and identify areas for improvement. Shorter lead times in Change Lead Time measurements indicate faster delivery of value.
In addition to DORA metrics, Agile Maturity Metrics can be utilized to gauge how well team members grasp and apply Agile concepts. These metrics can cover a comprehensive range of practices like Test-Driven Development (TDD), Vertical Slicing, and Definitions of Done and Ready. Regular quarterly assessments can help teams reflect on their Agile journey.
Teams can streamline their software delivery process and reduce bottlenecks by monitoring deployment frequency and lead time for changes. Tracking from code commit to deployment helps measure lead time for changes and identify delays. Monitoring DORA metrics also helps teams identify bottlenecks in the development pipeline, allowing for targeted improvements at each stage. Optimizing deployment pipelines and deployment processes is important to improve deployment efficiency and productivity. Continuous integration plays a key role in ensuring code quality and deployment success throughout the development cycle. Hence, leading to faster delivery of features and bug fixes. Optimizing effective code review processes, including automation, is crucial to reduce change failure rates and improve deployment quality. Creating smaller pull requests and using smaller pull requests can increase deployment frequency and reduce lead time for changes by making work more manageable and streamlining the release process. Another key metric is Story Point Velocity, which provides insight into how a team performs across sprints. This metric can be more telling when combined with an analysis of time spent on non-story tasks such as bugs and spikes.
Tracking the change failure rate and MTTR helps software teams focus on improving the reliability and stability of their applications. These reliability metrics are measured in the production environment, where a production failure can have a significant impact on users and business operations. Addressing failures quickly is crucial to minimize downtime and restore normal service as soon as possible. Robust testing processes, especially automated testing, help catch bugs early, speed up the release cycle, and improve deployment reliability. Automated testing reduces the change failure rate and boosts overall software quality, resulting in more stable releases and fewer disruptions for users. When measuring deployment frequency, it is important to focus on successful deployments to production, as this reflects the team's ability to deliver value reliably. Consistently high change failure rate undermines the effectiveness of deployment frequency and lead time for changes.
Summing these at sprint’s end gives a clear view of improvement in handling defects.
DORA metrics give clear data that helps teams decide where to improve, making it easier to prioritize the most impactful actions for better performance and enhanced customer satisfaction. DORA metrics create a shared language and common goals across teams, helping to break down silos.
Incorporating customer feedback alongside DORA metrics enables teams to prioritize improvements that matter most to users, ensuring that changes address real customer needs and drive meaningful value.
Regularly reviewing these metrics encourages a culture of continuous improvement. Measuring deployment frequency over time helps teams track their progress and set improvement goals. This helps software development teams to set goals, monitor progress, and adjust their practices based on concrete data.
DORA metrics allow DevOps teams to compare their performance against industry standards or other teams within the organization. By leveraging industry benchmarks, teams can identify gaps and prioritize areas for improvement. Top performing teams typically deploy code multiple times a day and recover from failures quickly, while average teams often take about a week to deploy changes, highlighting the value of striving for higher efficiency and agility. This encourages healthy competition and drives overall improvement.
DORA metrics provide actionable data that helps Scrum teams identify inefficiencies and bottlenecks in their processes. Analyzing value streams and the entire software delivery process enables teams to pinpoint where value flow is obstructed and optimize the end-to-end delivery pipeline. Using flow metrics to measure and optimize the value stream from development to delivery helps assess the efficiency and impact of the entire value stream, leading to improved business outcomes. Analyzing these metrics allows engineering leaders to make informed decisions about where to focus improvement efforts and reduce recovery time. By incorporating both DORA and other Agile metrics, teams can achieve a holistic view of their performance, ensuring continuous growth and adaptation.
Firstly, understand the importance of DORA Metrics as key metrics for measuring software delivery performance, since each metric provides insight into different aspects of the development and delivery process. Together, these metrics offer a comprehensive view of the team’s performance and allow them to make data-driven decisions.
Scrum teams should start by setting baselines for each metric to get a clear starting point and set realistic goals. For instance, if a scrum team currently deploys once a month, it may be unrealistic to aim for multiple deployments per day right away. Instead, they could set a more achievable goal, like deploying once a week, and gradually work towards increasing their frequency.
Scrum teams must schedule regular reviews (e.g., during sprint retrospectives) to discuss the metrics to identify trends, patterns, and anomalies in the data. This helps to track progress, pinpoint areas for improvement, and further allow them to make data-driven decisions to optimize their processes and adjust their goals as needed.
Use the insights gained from the metrics to drive ongoing improvements and foster a culture that values experimentation and learning from mistakes. By creating this environment, Scrum teams can steadily enhance their software delivery performance. Note that, this approach should go beyond just focusing on DORA metrics. it should also take into account other factors like developer productivity and well-being, collaboration, and customer satisfaction.
Encourage collaboration between development, operations, and other relevant teams to share insights and work together to address bottlenecks and improve processes. Make the metrics and their implications transparent to the entire team. You can use the DORA Metrics dashboard to keep everyone informed and engaged.
When evaluating Scrum teams, traditional metrics like velocity and hours worked can often miss the bigger picture. Instead, teams should concentrate on meaningful outcomes that reflect their real-world impact, such as improving customer retention through frequent and reliable deployments. Here are some alternative metrics to consider:
Focusing on these outcomes shifts the attention from internal team performance metrics to the broader impact the team has on the organization and its customers. This approach not only aligns with agile principles but also fosters a culture centered around continuous improvement and customer value.
In today's fast-paced business environment, effectively measuring the performance of Scrum teams can be quite challenging. This is where the principles of Evidence-Based Management (EBM) come into play. By relying on EBM, organizations can make informed decisions through the use of data and empirical evidence, rather than intuition or anecdotal success stories.
1. Objective Metrics: EBM encourages the use of quantifiable data to assess outcomes. For Scrum teams, this might include metrics like sprint velocity, defect rates, or customer satisfaction scores, providing a clear picture of how the team is performing over time.
2. Continuous Improvement: EBM fosters an environment of continuous learning and adaptation. By regularly reviewing data, Scrum teams can identify areas for improvement, tweak processes, and optimize their workflows to become more efficient and effective.
3. Strategic Decision-Making: EBM allows managers and stakeholders to make strategic decisions that are grounded in reality. By understanding what truly works and what does not, teams are better positioned to allocate resources effectively, set achievable goals, and align their efforts with organizational objectives.
In conclusion, the integration of Evidence-Based Management into the Scrum framework offers a robust method for measuring team performance. It emphasizes objective data, continuous improvement, and strategic alignment, leading to more informed decision-making and enhanced organizational performance.
Transitioning to a new framework like Scrum can breathe life into a team's workflow, providing structure and driving positive change. Yet, as the novelty fades, teams may slip into a mindset where they believe there's nothing left to improve. Here's how to tackle this mentality:
Regular retrospectives are key to ongoing improvement. Instead of focusing solely on what's working, encourage team members to explore areas of stagnation. Use creative retrospective formats like Sailboat Retrospective or Starfish to spark fresh insights. This can reinvigorate discussions and spotlight subtle areas ripe for enhancement.
Instill a culture of continuous improvement by introducing clear, objective metrics. Tools such as cycle time, lead time, and work item age can offer insights into process efficiency. These metrics provide concrete evidence of where improvements can be made, moving discussions beyond gut feeling.
Encourage team members to pursue new skills and certifications. This boosts individual growth, which in turn enhances team capabilities. Platforms like Coursera or Khan Academy offer courses that can introduce new practices or methodologies, further refining your Scrum process.
Create an environment where feedback is not only welcomed but actively sought after. Continuous feedback loops, both formal and informal, can identify blind spots and drive progress. Peer reviews or rotating leadership roles can keep perspectives fresh.
Sometimes, complacency arises from routine. Rotate responsibilities within the team or introduce new challenges to encourage team members to think creatively. This could involve tackling a new type of project, experimenting with different tools, or working on cross-functional initiatives.
By making these strategic adjustments, Scrum teams can maintain their momentum and uncover new avenues for growth. Remember, the journey of improvement is never truly complete. There's always a new horizon to reach.
Typo is a powerful tool designed specifically for tracking and analyzing DORA metrics. It provides an efficient solution for DevOps and Scrum teams seeking precision in their performance measurement.
Wanna Improve your Team Performance with DORA Metrics?
Divided Focus: Juggling dual responsibilities often leads to neglected duties. Balancing the detailed work of a developer with the overarching team-care responsibilities of a Scrum Master can scatter attention and dilute effectiveness. Each role demands a full-fledged commitment for optimal performance.
Prioritization Conflicts: The immediate demands of coding tasks can overshadow the broader, less tangible obligations of a Scrum Master. This misalignment often results in prioritizing development work over facilitating team dynamics or resolving issues.
Impediment Overlook: A Scrum Master is pivotal in identifying and eliminating obstacles hindering the team. However, when embroiled in development, there is a risk that the crucial tasks of monitoring team progress and addressing bottlenecks are overlooked.
Diminished Team Support: Effective Scrum Masters nurture team collaboration and efficiency. When their focus is divided, the encouragement and guidance needed to elevate team performance might fall short, impacting overall productivity.
Burnout Risk: Balancing two demanding roles can lead to fatigue and burnout. This is detrimental not only to the individual but also to team morale and continuity of workflow.
Ineffective Communication: Clear, consistent communication is the cornerstone of agile success. A dual-role individual might struggle to maintain ongoing dialogue, hampering transparency and slowing down decision-making processes.
Each of these challenges underscores the importance of having dedicated roles in a team structure. Balancing dual roles requires strategic planning and sharp prioritization to ensure neither responsibility is compromised.
Leveraging DORA Metrics can transform Scrum team performance by providing actionable insights into key aspects of development and delivery. When implemented the right way, teams can optimize their workflows, enhance reliability, and make informed decisions to build high-quality software.

In this article, we've shared four key DevOps metrics, their importance and other metrics to consider.
Lots of organizations are prioritizing the adoption and enhancement of their DevOps practices, focusing on DevOps metrics to optimize the software development life cycle and increase delivery speed which enables faster market reach and improved customer service. This article is for DevOps engineers, team leads, and managers looking to understand and leverage key DevOps metrics. Tracking these metrics matters for business outcomes because they provide actionable insights that drive efficiency, quality, and alignment with business goals. By monitoring DevOps metrics, organizations can ensure their software delivery processes are both effective and adaptable, leading to improved customer satisfaction and competitive advantage.
DevOps metrics are the key indicators that showcase the performance of the DevOps software development pipeline. DevOps metrics measure the efficiency of software delivery processes. By bridging the gap between development and operations, these metrics are essential for measuring and optimizing the efficiency of both processes and people involved. DevOps metrics help teams identify bottlenecks and validate improvement efforts.
Tracking DevOps metrics allows teams to quickly identify and eliminate bottlenecks, streamline workflows, and ensure alignment with business objectives, and DORA metrics provide a comprehensive overview of software development performance.
DORA metrics include four key performance indicators. Here are the four DORA metrics to consider: Deployment Frequency, Lead Time for Changes, Change Failure Rate, and Mean Time to Recovery.
Deployment Frequency measures how often code is deployed into production per week, taking into account everything from bug fixes and capability improvements to new features. It is a key indicator of agility, and efficiency and a catalyst for continuous delivery and iterative development practices that align seamlessly with the principles of DevOps. A wrong approach in the first key metric can degrade the other DORA metrics.
These key performance indicators should be evaluated together rather than optimized in isolation, and effective DevOps measurement balances speed with reliability and quality so DORA DevOps metrics help high-performing organizations improve these indicators together for the best results.
Deployment Frequency is measured by dividing the number of deployments made during a given period by the total number of weeks/days. One deployment per week is standard. However, it also depends on the type of product.
Next, let's look at Lead Time for Changes.
Lead Time for Changes measures the time it takes for a code change to go through the entire development pipeline and become part of the final product. It is a critical metric for tracking the efficiency and speed of software delivery. The measurement of this metric offers valuable insights into the effectiveness of development processes, deployment pipelines, and release strategies.
To measure this metric, DevOps should have:
Divide the total sum of time spent from commitment to deployment by the number of commitments made; measuring DORA metrics systematically helps ensure this calculation stays consistent across teams.
Next, let's examine Change Failure Rate.
Change Failure Rate refers to the proportion or percentage of deployments causing failures or errors after release, indicating the rate at which changes negatively impact the stability or functionality of the system. A successful deployment counts only when it reaches production and remains stable by your team's standards, while pre-deployment bug fixes are not included in this metric. It reflects the stability and reliability of the entire software development and deployment lifecycle. Tracking CFR helps identify bottlenecks, flaws, or vulnerabilities in processes, tools, or infrastructure that can negatively impact the quality, speed, and cost of software delivery.
To calculate CFR, follow these steps:
A low production change failure rate signals a stable release process, and strong teams often target 0-15%, which aligns with practical DORA metrics guidance for engineering leaders.
Now, let's move on to Mean Time to Restore.
Mean Time to Restore (MTTR), also called mean time to recovery, represents the average time taken to resolve a production failure or incident and restore service in the production environment after an outage each week. Measuring "Mean Time to Restore" (MTTR) provides crucial insights into an engineering team's incident response and resolution capabilities. It helps identify areas of improvement, optimize processes, and enhance overall team efficiency.
To calculate this, follow these steps:
High-performing teams often recover in under one hour, while lower-performing teams may take up to a week, and mastering the art of DORA metrics can help teams systematically reduce MTTR.
With the four key DORA metrics covered, let's explore additional DevOps metrics that can further enhance your team's performance.
Cycle time measures the total elapsed time taken to complete a specific task or work item from the beginning to the end of the process.
Mean Time to Failure (MTTF) is a reliability metric used to measure the average time a non-repairable system or component operates before it fails, and large enterprises often combine it with DORA DevOps metrics implementation in large organizations to get a complete view of reliability and delivery performance.
Error Rates measure the number of errors encountered in the platform. It identifies the stability, reliability, and user experience of the platform.
Response time is the total time from when a user makes a request to when the system completes the action and returns a result to the user.
Typo is a powerful tool designed specifically to help DevOps teams track performance with DORA metrics and related performance metrics. Typo uses DORA metrics to boost efficiency and provides an efficient solution for development teams seeking precision in their DevOps performance measurement. DevOps metrics facilitate data-driven decision-making rather than relying on subjective opinions.
Adopting and enhancing effective DevOps practices and DevOps processes is essential for organizations that want to help a software development team improve software delivery performance and delivery performance across the software development lifecycle. Tracking these devops metrics helps teams because DevOps and DORA metrics provide specific metrics they can use to improve devops metrics, support software development processes, and deliver higher quality software tied to business outcomes, strengthening organizational performance and business results.

In today’s software development landscape, effective collaboration among teams and seamless service orchestration are essential. Achieving these goals requires adherence to organizational standards for quality, security, and compliance. Delivery metrics, software delivery KPIs, and engineering metrics are key tools for tracking and improving software delivery processes, helping organizations measure performance, identify bottlenecks, and drive continuous improvement. Without diligent monitoring, organizations risk losing sight of their delivery workflows, complicating the assessment of impacts on release velocity, stability, developer experience, and overall application performance.
To address these challenges, many organizations have begun tracking DevOps Research and Assessment (DORA) metrics. These essential metrics provide crucial insights for any team involved in software development, offering a comprehensive view of the Software Development Life Cycle (SDLC). Essential metrics help engineering managers and teams align software delivery with business goals and drive value delivery for the entire business. DORA metrics are particularly useful for teams practising DevOps methodologies, including Continuous Integration/Continuous Deployment (CI/CD) and Site Reliability Engineering (SRE), which focus on enhancing system reliability.
However, the collection and analysis of these metrics can be complex. Decisions about which data points to track and how to gather them often fall to individual team leaders. Additionally, turning this data into actionable insights for engineering teams and leadership can be challenging. Aligning software delivery metrics with business goals ensures technology initiatives deliver real value, and metrics should focus on outcomes rather than individual outputs.
Choosing the right software delivery metrics is crucial for making informed decisions that align with business objectives and improve customer experience.
The DORA research team at Google conducts annual surveys of IT professionals to gather insights into industry-wide software delivery practices. From these surveys, four key metrics have emerged as indicators of software teams’ performance, particularly regarding the speed and reliability of software deployment. Cycle time measures and deployment frequency measures are key indicators of team performance and delivery speed, helping teams understand how efficiently they deliver value. These key DORA metrics include:

DORA metrics connect production-based metrics with development-based metrics, providing quantitative measures that complement qualitative insights into engineering performance. The four key metrics are: deployment frequency measures, which assess how often code is deployed to production and correlate with the speed of the engineering team; lead time for changes, which is closely related to cycle time measures and tracks how long a work item takes from idea to completion—a critical KPI because it reflects delivery speed and highlights bottlenecks; change failure rate measures, which indicate the percentage of deployments that cause a failure in production requiring remediation; and time to restore services, which measures how quickly teams recover from failures. These metrics help teams understand their performance and progress over time.
They focus on two primary aspects: speed and stability. Deployment frequency and lead time for changes relate to throughput, while time to restore services and change failure rate address stability. High deployment frequency isn't just a sign of developer productivity; it means tighter feedback loops and lower risk per release. Additionally, flow efficiency tracks the percentage of total work time your team spends actively progressing tasks instead of waiting on dependencies, helping to identify bottlenecks and improve process speed.
Contrary to the historical view that speed and stability are opposing forces, research from DORA indicates a strong correlation between these metrics in terms of overall performance. Additionally, these metrics often correlate with key indicators of system success, such as availability, thus offering insights that benefit application performance, reliability, delivery workflows, and developer experience. Quality metrics like Change Failure Rate and Defect Density help catch issues early, potentially reducing significant financial losses from software failures. Software delivery metrics help teams understand their overall engineering performance, track their progress, and identify areas for improvement.
While DORA DevOps metrics may seem straightforward, measuring them can involve ambiguity, leading teams to make challenging decisions about which data points to use. Delivery excellence and delivery excellence metrics provide a holistic view of the software delivery process, helping to identify bottlenecks and areas for improvement. Tracking software delivery metrics encourages continuous improvement by providing concrete data to compare over time, and excellence metrics are critical for understanding efficiency in delivering quality products and services. Excellence metrics also offer a holistic view of how projects are managed and executed.
Improving visibility into software delivery metrics can lead to better team productivity and development speed, especially when coordinating multiple teams. A culture of psychological safety and transparency enhances the effectiveness of software delivery metrics, ensuring that teams feel safe to share data and insights openly.
Below are guidelines and best practices to ensure accurate and actionable DORA metrics:
These best practices help organizations collect reliable data, enabling engineering managers and teams to make informed decisions that drive continuous improvement and enhance software delivery performance.
Establishing a standardized process for monitoring DORA metrics can be complicated due to differing internal procedures and tools across teams, as well as the challenges of coordinating and managing multiple teams working on related projects. Effective team collaboration is crucial to ensure transparency, alignment, and consistent delivery across these teams. Clearly defining the scope of your analysis—whether for a specific department or a particular aspect of the delivery process—can simplify this effort. It’s essential to consider the type and amount of work involved in different analyses and standardize data points to align with team, departmental, or organizational goals.
Strong development processes also play a key role in enabling teams to recover efficiently from failures and ensure rapid incident response, minimizing downtime and maintaining robust software delivery.
For example, platform engineering teams focused on improving delivery workflows may prioritize metrics like deployment frequency and lead time for changes. In contrast, SRE teams focused on application stability might prioritize change failure rate and time to restore service. By scoping metrics to specific repositories, services, and teams, organizations can gain detailed insights that help prioritize impactful changes.
Best Practices for Defining Scope:
To maintain consistency in collecting DORA metrics, address the following questions:
1. What constitutes a successful deployment?
Establish clear criteria for what defines a successful deployment within your organization. Consider the different standards various teams might have regarding deployment stages. For instance, at what point do you consider a progressive release to be “executed”? Additionally, monitor for problematic code during deployments to prevent defective or unstable code from reaching production and to enhance software reliability.
2. What defines a failure or response?
Clarify definitions for system failures and incidents to ensure consistency in measuring change failure rates. Differentiate between incidents and failures based on factors such as application performance and service level objectives (SLOs). For example, consider whether to exclude infrastructure-related issues from DORA metrics.
3. When does an incident begin and end?
Determine relevant data points for measuring the start and resolution of incidents, which are critical for calculating time to restore services. Decide whether to measure from when an issue is detected, when an incident is created, or when a fix is deployed.
4. What time spans should be used for analysis?
Select appropriate time frames for analyzing data, taking into account factors like organization size, the age of the technology stack, delivery methodology, and key performance indicators (KPIs). Adjust time spans to align with the frequency of deployments to ensure realistic and comprehensive metrics.
Best Practices for Standardizing Data Collection:
Effective software delivery is a cornerstone of success for modern organizations navigating the fast-paced world of software development. When engineering teams focus on optimizing their software development life cycle using key metrics such as deployment frequency, lead time, and cycle time, they unlock a range of benefits that extend beyond the development pipeline.
One of the most significant advantages is improved customer satisfaction. By delivering new features and updates more frequently and reliably, teams can respond quickly to user feedback and evolving market demands, resulting in higher user satisfaction and loyalty. Enhanced delivery speed and quality also mean that software development projects are more closely aligned with business objectives, ensuring that technology investments directly support strategic goals.
Increased team productivity is another major benefit. When teams leverage valuable insights from software development metrics, they can identify and eliminate bottlenecks, streamline workflows, and foster a culture of continuous improvement. This not only accelerates the development cycle but also boosts team morale and motivation, as engineers see the direct impact of their work on business outcomes.
Furthermore, effective software delivery leads to higher overall software quality. By continuously monitoring and refining processes, teams can reduce defects, improve code stability, and ensure that each release meets high standards. This focus on quality, combined with the ability to measure performance through key metrics, empowers organizations to deliver software that delights users and drives business growth.
Ultimately, effective software delivery is about more than just speed—it’s about delivering value. By embracing continuous improvement and aligning software development efforts with business goals, organizations can achieve greater efficiency, higher quality, and lasting customer satisfaction.
Before diving into improvements, it’s crucial to establish a baseline for your current continuous integration and continuous delivery performance using DORA metrics. This involves gathering historical data to understand where your organization stands in terms of deployment frequency, lead time, change failure rate, and MTTR. Engineering managers rely on this data to track key software delivery metrics and use software delivery forecast dates, which leverage historical delivery patterns and current progress, to provide realistic estimates of when a feature will land. This baseline will serve as a reference point to measure the impact of any changes you implement.
Actionable Insights: Deployment frequency measures tell you how often your team ships code to production, serving as a key indicator of team performance and productivity. High deployment frequency isn't just a sign of developer productivity; it means tighter feedback loops, lower risk per release, and a direct positive impact on customer experience by enabling faster response to user needs. If your deployment frequency is low, it may indicate issues with your CI/CD pipeline or development process. Investigate potential causes, such as manual steps in deployment, inefficient testing procedures, or coordination issues among team members.
Strategies for Improvement:
Actionable Insights: Long change lead time often points to inefficiencies in the development process. Cycle time measures and lead time are critical for understanding how quickly work moves from idea to completion. Lead time measures the time required to complete a unit of work, referring to the overall time to deliver an increment of software from initial idea through to deployment to live. By analyzing your CI/CD pipeline, you can identify delays caused by manual approval processes, inadequate testing, or other obstacles. Reducing lead time enhances value delivery by enabling faster, more reliable releases to customers, which directly impacts customer satisfaction and team motivation.
Strategies for Improvement:
Actionable Insights: A high change failure rate is a clear sign that the quality of code changes needs improvement. Change failure rate measures the percentage of deployments that cause a failure in production requiring remediation, making it a key indicator of deployment quality and the effectiveness of development and testing practices. Tracking quality metrics such as code coverage, code complexity, and maintainability, as well as identifying problematic code early, helps prevent failures and improve software reliability. Metrics like Change Failure Rate and Defect Density help catch issues early, potentially reducing significant financial losses from software failures. This can be due to inadequate testing or rushed deployments.
Strategies for Improvement:
Actionable Insights: If your MTTR is high, it suggests challenges in incident management and response capabilities. Strong development processes and the team's ability to respond quickly are essential for minimizing MTTR and ensuring rapid recovery. Mean time to recovery measures how long it takes to recover from failure and indicates the quality of the engineering team's processes, with a target of less than 1 hour for critical services in 2026. High MTTR can lead to longer downtimes and reduced user trust.
Strategies for Improvement:
Despite the clear benefits, many teams encounter persistent challenges that can hinder their ability to deliver software efficiently and effectively. One of the most common obstacles is a lack of visibility into the software delivery process. Without clear insights into each stage of the development cycle, it becomes difficult for teams to pinpoint bottlenecks, measure performance, or make informed decisions that drive improvement.
Technical debt is another significant challenge. As software projects evolve, shortcuts and legacy code can accumulate, slowing down the development cycle and negatively impacting code quality. This can lead to increased maintenance costs and make it harder for teams to deliver new features or respond to issues quickly.
Test management also presents hurdles for many teams. Flaky tests and inadequate automated testing can undermine confidence in the deployment process, resulting in longer cycle times and increased risk of failures in production environments. Inefficient test management not only affects software quality but can also erode team morale, as developers spend more time troubleshooting test issues instead of building new functionality.
The complexity of modern software delivery, with its emphasis on continuous delivery and rapid deployment, can be overwhelming—especially for teams managing multiple projects or working across different tools and environments. Without the right software development metrics in place, it’s challenging to maintain delivery efficiency and ensure that the team’s progress aligns with business goals.
To overcome these challenges, it’s essential for development teams to focus on collecting and analyzing the right software development metrics, such as DORA metrics. By doing so, teams can gain valuable insights into their delivery process, identify areas for improvement, and implement changes that reduce failure rates, improve code quality, and enhance customer satisfaction. Addressing these common challenges head-on is key to building motivated teams, delivering high-quality software, and achieving continuous improvement in the software delivery process.
Utilizing DORA metrics is not a one-time activity but part of an ongoing process of continuous improvement, which is essential for maximizing customer satisfaction and loyalty. Establish a regular review cycle where teams assess their DORA metrics and adjust practices accordingly. This creates a culture of accountability and encourages teams to seek out ways to improve their CI/CD workflows continually.
Continuous improvement in software delivery requires a culture of learning, experimentation, psychological safety, and transparency. Engineering metrics, including DORA and other excellence metrics, should be combined with this supportive culture to improve team productivity. Tracking excellence metrics provides concrete data to compare over time, further encouraging continuous improvement and helping teams identify areas for growth.
Etsy, an online marketplace, adopted DORA metrics to assess and enhance its CI/CD workflows. By focusing on improving its deployment frequency and lead time for changes, Etsy was able to increase deployment frequency from once a week to multiple times a day, significantly improving responsiveness to customer needs. Elite teams are characterized by high deployment frequency measures and a strong focus on delivering a superior customer experience, setting a benchmark for operational excellence in software delivery.
Flickr used DORA metrics to track its change failure rate. By implementing rigorous automated testing and post-mortem analysis, Flickr reduced its change failure rate significantly, leading to a more stable production environment. Additionally, by closely monitoring change failure rate measures and incorporating quality metrics such as code coverage and maintainability, Flickr was able to further enhance deployment quality and ensure ongoing production stability.
Google’s Site Reliability Engineering (SRE) teams utilize DORA metrics to inform their practices. By focusing on MTTR, Google has established an industry-leading incident response culture, resulting in rapid recovery from outages and high service reliability. Engineering managers play a key role in this process by leveraging strong development processes and fostering effective team collaboration, which together enable quick incident response and minimize downtime.
Typo is a powerful tool designed specifically for tracking and analyzing DORA metrics. It provides an efficient solution for development teams seeking precision in their DevOps performance measurement.


DORA metrics serve as a compass for engineering teams, optimizing development and operations processes to enhance efficiency, reliability, and continuous improvement in software delivery. DORA metrics originated from the DORA team at Google Cloud, which was established to assess DevOps performance using a standard set of metrics.
The four key metrics are deployment frequency, lead time for changes, change failure rate, and mean time to recover (MTTR). These DORA metrics have been shown to predict organizational performance and business impact by linking engineering effectiveness to better business outcomes.
In this blog, we explore how DORA metrics boost tech team performance by providing critical insights into software development and delivery processes.
DORA metrics, developed by the DevOps Research and Assessment team, are a set of key performance indicators that measure the effectiveness and efficiency of software development and delivery processes. DORA metrics are considered core software delivery performance metrics for DevOps teams, serving as essential benchmarks for assessing and improving team and organizational capabilities.
They provide a data-driven approach to evaluate the impact of operational practices on software delivery performance. The original four DORA metrics—deployment frequency, lead time for changes, change failure rate, and mean time to recovery—are widely recognized as performance metrics that help measure and improve software delivery. The current five-metric model now includes reliability as the fifth metric, reflecting the evolution of DORA metrics to address system stability and resilience. These performance metrics are used to measure performance, benchmark maturity, and drive continuous improvement in software delivery.
DORA metrics have evolved from simple delivery measurements to essential strategic tools for navigating the modern software development landscape and measuring performance.
The four DORA metrics are a standardized set of DevOps performance indicators that evaluate software delivery speed, stability, and efficiency. Deployment frequency and lead time for changes are often referred to together as deployment frequency lead time, as they are crucial for benchmarking team efficiency and identifying bottlenecks in the development process.
All four DORA metrics should be analyzed together to get a complete picture of software delivery performance.
In 2021, the DORA Team added Reliability as a fifth metric. It is based upon how well the user’s expectations are met, such as availability and performance, and measures modern operational practices.
Here’s how key DORA metrics help in boosting performance for tech teams:
DORA metrics help DevOps teams identify areas for improvement, set goals for service-level agreements (SLAs), and establish objective baselines across teams, including benchmarking with other teams. They are also used to measure software development productivity and to identify best and worst practices across engineering teams, enabling the sharing of successful strategies and insights for becoming an elite team with DORA metrics.
Deployment Frequency is used to track the rate of change in software development and to highlight potential areas for improvement. Deployment frequency refers to how often code changes are released into the production deployment environment, which is a critical factor in software delivery efficiency and lead time for changes.
Improving deployment frequency involves making smaller, more frequent deployments, which increases software delivery throughput and reduces risk. This approach enables faster feedback, supports continuous improvement, and helps teams deliver value to users more quickly.
One deployment per week is standard. However, it also depends on the type of product.
Lead Time for Changes is a critical metric used to measure the efficiency and speed of software delivery. It is the duration between a code change being committed and its successful deployment to end-users.
Improving lead time for changes often involves optimizing the technology stack—including source code management, CI/CD pipelines, and infrastructure observability tools—addressing bottlenecks in the delivery pipeline, and enhancing automation.
The standard for Lead time for Change is less than one day for elite performers and between one day and one week for high performers.

CFR, or Change Failure Rate measures the frequency at which newly deployed changes lead to failures, glitches, or unexpected outcomes in the IT environment. Quality assurance practices, such as automated testing and staging, play a crucial role in reducing the change failure rate by ensuring high product quality before deployment.
Deployment rework rate is another important metric, measuring the frequency of unplanned deployments caused by production incidents.
A lower change failure rate indicates a mature development process where changes are thoroughly tested before deployment.
0% - 15% CFR is considered to be a good indicator of code quality.
MTTR, which stands for Mean Time to Recover, is a valuable metric that provides crucial insights into an engineering team’s incident response and resolution capabilities. Failed deployment recovery time, a key DORA metric, specifically measures how quickly a team can recover from a failed deployment caused by recent software changes, rather than external system issues. Tracking incidents resulting from code deployments helps teams improve operational resilience and deployment practices.
Less than one hour is considered to be a standard for teams. Time to restore service can be improved by creating a well-structured development pipeline and automating testing and deployment processes.
Code reviews and feedback loops are foundational to achieving high software delivery performance and optimizing DORA metrics. By embedding regular code reviews into the software development process, engineering teams can proactively catch bugs, enforce coding standards, and share knowledge—ultimately reducing the change failure rate and elevating software quality. These reviews act as a safeguard, ensuring that only well-vetted code reaches production, which minimizes the risk of production failures and accelerates the time to restore service when issues do arise.
Feedback loops, whether through automated testing, peer review, or post-incident retrospectives, empower teams to learn from every deployment. By analyzing what went well and what could be improved, teams can refine their deployment processes, shorten lead times, and increase deployment frequency without sacrificing quality. Elite teams that prioritize both code reviews and robust feedback mechanisms consistently outperform others in DORA metrics, achieving lower failure rates and faster recovery times.
Cultivating a culture that values open communication and continuous improvement is essential. Engineering leaders should encourage transparent discussions about code quality and incident response, making it safe for teams to learn from mistakes. When code reviews and feedback loops are ingrained in the development process, teams are better equipped to deliver reliable software, respond quickly to incidents, and drive ongoing delivery performance improvements.
Firstly, you need to collect DORA Metrics effectively. Collecting data for DORA metrics requires a comprehensive technology stack, including source code management, CI/CD pipelines, and observability tools, to ensure accurate and complete measurement. This can be done by integrating tools and systems to gather data on key DORA metrics. There are various DORA metrics trackers in the market that make it easier for development teams to automatically get visual insights in a single dashboard. The aim is to collect the data consistently over time to establish trends and benchmarks.
The next step is to analyze them to understand your development team’s performance. DORA metrics are often broken into four performance categories: low performers, medium performers, high performers, and elite performers. Start by comparing metrics to the DORA benchmarks to see if the team is an Elite, High, Medium, or Low performer. Organizations can benchmark their performance against industry standards to set realistic goals and track progress over time. Identifying high performing teams and learning from their practices can help drive organizational improvements and provide valuable benchmarking insights. Ensure to look at the metrics holistically as improvements in one area may come at the expense of another. So, always strive for balanced improvements. Regularly review the collected metrics to identify areas that need the most improvement and prioritize them first. Don’t forget to track the metrics over time to see if the improvement efforts are working.
Leverage the DORA metrics to drive continuous improvement in engineering practices. DORA metrics serve as a continuous improvement tool, helping teams set goals based on current performance and measure progress, while also building consensus for technical and resource investments. It is crucial that teams understand DORA metrics to identify inefficiencies, improve response times, and drive better performance. As organizations increase AI adoption, it is important to monitor the impact on DORA metrics, since AI can boost productivity but may also increase code complexity, potentially affecting delivery stability and throughput. Additionally, collecting customer feedback is essential to guide continuous improvement and assess the value delivered to end users. Discuss what’s working and what’s not and set goals to improve metric scores over time. Don’t use DORA metrics on a sole basis. Tie it with other engineering metrics to measure it holistically and experiment with changes to tools, processes, and culture.
Encourage practices like:
Maximizing the value of DORA metrics requires a strategic approach grounded in best practices that foster continuous improvement and data-driven decision-making. To start, organizations should automate as much of the software delivery process as possible. Implementing automated testing and deployment processes not only reduces lead time but also increases deployment frequency, allowing teams to deliver value to customers faster and more reliably.
Regular code reviews and structured feedback loops are equally important. By systematically reviewing code and gathering feedback after each deployment, teams can identify areas for improvement, reduce change failure rates, and enhance overall software quality. These practices help teams catch issues early and adapt quickly to changing requirements.
Identifying and addressing bottlenecks in the software delivery process is another key best practice. DORA metrics provide the data needed to pinpoint where delays or failures occur, enabling teams to focus their efforts where they will have the greatest impact on delivery performance. Engineering leaders should use these insights to set clear, achievable goals and track progress over time, fostering a culture of continuous improvement.
Finally, it’s essential to regularly review and refine DORA metrics to ensure they remain relevant as the organization evolves. By following these best practices—automation, code reviews, feedback loops, bottleneck identification, and ongoing metric refinement—organizations can improve their software delivery performance and achieve stronger business outcomes.
While DORA metrics offer powerful insights into software delivery performance, adopting them can present several challenges, especially for organizations with complex software development environments. One of the most common hurdles is collecting and integrating data from diverse sources, such as version control systems, CI/CD pipelines, and incident management tools. Ensuring data accuracy and consistency across these platforms is critical for reliable metrics.
Interpreting DORA metrics correctly is another challenge. Without proper context, teams may misread the data, leading to misguided decisions or misplaced priorities. It’s important for engineering teams to understand what each metric truly represents and how it aligns with their specific delivery performance goals.
Prioritizing improvements can also be difficult, as multiple areas may require attention simultaneously. Deciding where to focus resources—whether on reducing lead time, improving deployment processes, or enhancing automated testing—requires clear goals and alignment across teams.
Implementing changes to improve DORA metrics often demands significant effort, particularly if it involves overhauling existing deployment processes or introducing new tools and frameworks. This can be time-consuming and may face resistance from teams accustomed to established workflows.
To overcome these challenges, organizations should start by setting clear objectives for their DORA metrics initiative, investing in the right tools and infrastructure to support data collection and analysis, and providing training and support for engineering teams. By addressing these common obstacles head-on, organizations can successfully implement DORA metrics and drive meaningful improvements in software delivery performance.
Typo is a powerful tool designed specifically for tracking and analyzing DORA metrics, providing an alternative and efficient solution for development teams seeking precision in their DevOps performance measurement.

DORA metrics are not just metrics; they are strategic navigators guiding tech teams toward optimized software delivery. By focusing on key DORA metrics, tech teams can pinpoint bottlenecks and drive sustainable performance enhancements.
DORA metrics also help teams evaluate business impact and organizational performance by providing an objective look at ROI and the progress of engineering initiatives.
Start leveraging DORA metrics to transform your engineering outcomes today.

The DORA (DevOps Research and Assessment) metrics have emerged as a north star for assessing software delivery performance. DORA metrics provide key performance indicators that help organizations measure and improve software delivery speed and reliability. The fifth metric, Reliability is often overlooked as it was added after the original announcement of the DORA research team.
The DORA metrics team originally defined four metrics—deployment frequency, lead time for changes, mean time to recovery, and change failure rate—as the core set for evaluating DevOps team performance in terms of speed and stability. Implementing DORA metrics requires organizations to collect data from various tools and systems to ensure accurate measurement and actionable insights.
In this blog, let’s explore Reliability and its importance for software development teams. Platforms like Google Cloud offer infrastructure and tools to support the collection and analysis of DORA metrics.
DevOps Research and Assessment (DORA) metrics are a compass for engineering teams striving to optimize their development and operations processes. These metrics serve as a key tool for DevOps teams to assess performance, set goals, and drive continuous improvement in their workflows.
In 2015, The DORA (DevOps Research and Assessment) team was founded by Gene Kim, Jez Humble, and Dr. Nicole Forsgren to evaluate and improve software development practices. The aim is to enhance the understanding of how development teams can deliver software faster, more reliably, and of higher quality. DORA metrics are used to measure performance and benchmark a team's performance against other teams, helping organizations identify best practices and improve overall efficiency.
Four key metrics are:
Reliability is a fifth metric that was added by the DORA team in 2021. It is based upon how well your user’s expectations are met, such as availability and performance, and measures modern operational practices. It doesn’t have standard quantifiable targets for performance levels rather it depends upon service level indicators or service level objectives.
While the first four DORA metrics (Deployment Frequency, Lead Time for Changes, Change Failure Rate, and Mean Time to Recover) target speed and efficiency, reliability focuses on system health, production readiness, and stability for delivering software products.
Reliability comprises various metrics used to assess operational performance including availability, latency, performance, and scalability that measure user-facing behavior, software SLAs, performance targets, and error budgets. Reliability also plays a key role in ensuring the delivery of customer value and aligning software outcomes with business goals. It has a substantial impact on customer retention and success. Customer feedback is an important indicator for measuring the effectiveness of reliability efforts.
Understanding value streams and applying value stream management practices can help teams optimize reliability across the entire development process.
A few indicators include:
Structured testing processes and thorough code review processes are essential for reducing failures and improving reliability. Each metric measures a specific aspect of reliability, helping teams identify areas for improvement.
These metrics provide a holistic view of software reliability by measuring different aspects such as failure frequency, downtime, and the ability to quickly restore service. Tracking these few indicators can help identify reliability issues, meet service level agreements, and enhance the software’s overall quality and stability.
The fifth DevOps metric, Reliability, significantly impacts overall performance. Adopting effective DevOps practices and building a strong DevOps team are key to achieving high reliability. Here are a few ways:
4.3. Faster Recovery from Failures
When failures occur, a reliable system can recover quickly, minimizing downtime and reducing the impact on users. This is often measured by the Mean Time to Recovery (MTTR). Multidisciplinary teams help break down silos and improve collaboration, which enhances reliability.
Reliability directly impacts an organization's performance and its ability to ensure the organization successfully releases high-quality software.
Tracking reliability metrics like uptime, error rates, and mean time to recovery allows DevOps teams to proactively identify and address issues. Therefore, ensuring a positive customer experience and meeting their expectations.
Automating monitoring, incident response, and recovery processes helps DevOps teams to focus more on innovation and delivering new features rather than firefighting. This boosts overall operational efficiency.
Reliability metrics promote a culture of continuous learning and improvement. This breaks down silos between development and operations, fostering better collaboration across the entire DevOps organization.
Reliable systems experience fewer failures and less downtime, translating to lower costs for incident response, lost productivity, and customer churn. Investing in reliability metrics pays off through overall cost savings.
Reliability metrics offer valuable insights into system performance and bottlenecks. Continuously monitoring these metrics can help identify patterns and root causes of failures, leading to more informed decision-making and continuous improvement efforts.
Tracking reliability serves as a cornerstone of effective software delivery performance. As organizations strive to implement DORA metrics and optimize their software delivery process, leveraging the right tools and technologies becomes essential for DevOps teams aiming to deliver better software, faster.
Let's explore the diverse solutions available to help development and operations teams monitor and measure key metrics—including deployment frequency, lead time for changes, change failure rate, and time to restore service. These tools not only support the collection of critical data but also provide actionable insights that drive continuous improvement across the entire value stream.
Monitoring and logging solutions such as Splunk, Datadog, and New Relic offer real-time visibility into application performance, error rates, and incidents. These comprehensive platforms transform how teams track and analyze their software delivery metrics.
By tracking these indicators, teams can quickly identify bottlenecks, monitor system health, and ensure that reliability targets are consistently met across all deployment environments.
CI/CD solutions like Jenkins, GitLab CI/CD, and CircleCI automate the build, testing, and deployment processes. This automation serves as a gateway to enhanced deployment frequency and reduced lead time for changes.
This automation is key to increasing deployment frequency and reducing lead time for changes, enabling high-performing teams to deliver new features and updates with confidence across multiple deployment stages.
Version control systems such as Git are fundamental for tracking code changes, supporting collaboration among multiple teams, and maintaining a clear history of deployments. These systems comprise comprehensive change management and collaboration capabilities.
This transparency is vital for measuring deployment frequency and understanding the impact of each change on overall delivery performance throughout the development lifecycle.
Incident management solutions like PagerDuty empower teams to respond rapidly to production issues, minimizing downtime and reducing the time to restore service. These platforms transform how organizations handle service disruptions and maintain operational excellence.
Effective incident management is crucial for maintaining customer satisfaction and meeting service level objectives across all production environments.
Value stream management solutions such as Plutora provide a holistic view of the entire software delivery process. These comprehensive platforms transform how teams visualize and optimize their delivery workflows.
By visualizing the end-to-end flow of work, these tools help teams identify bottlenecks, optimize flow time measures, and maximize business value delivered to customers throughout the entire delivery pipeline.
In addition to these core technologies, many organizations are adopting flow metrics to measure the movement of business value across the entire value stream. Flow metrics complement DORA metrics by offering insights into the end-to-end flow of software delivery.
Flow metrics help teams pinpoint inefficiencies and drive continuous improvement across all phases of the software delivery lifecycle.
High-performing teams combine DORA metrics with flow metrics and leverage these tools to monitor, analyze, and enhance their software delivery throughput. This integration comprises comprehensive performance measurement and optimization capabilities that ensure efficient development and deployment of high-quality software.
By continuously collecting data and refining their processes, engineering leaders and DevOps teams can implement DORA metrics effectively, improve organizational performance, and achieve better business outcomes.
Ultimately, tracking reliability with the right tools and technologies is essential for any organization that wants to optimize its software delivery performance. The deployment phase involves releasing these optimized delivery capabilities to development teams, serving as a gateway to post-implementation activities like maintenance and continuous optimization. By embracing a culture of continuous improvement and leveraging actionable insights, teams can deliver high-quality software, increase customer satisfaction, and stay ahead in today's competitive landscape through comprehensive reliability tracking and performance optimization.
The reliability metric with the other four DORA DevOps metrics offers a more comprehensive evaluation of software delivery performance. By focusing on system health, stability, and the ability to meet user expectations, this metric provides valuable insights into operational practices and their impact on customer satisfaction.

Software delivery is harder to reason about than it used to be. Teams ship more code, use more tools, and deploy more frequently, but the question that keeps surfacing in leadership meetings is the same one it was five years ago: are we actually getting better?
DORA metrics exist to answer that question with data instead of intuition.
Developed by the DevOps Research and Assessment team (now part of Google Cloud), the DORA framework provides a shared, evidence-based language for measuring software delivery performance. It has become the most widely adopted measurement system in engineering, used by thousands of organizations to understand how work moves from commit to production and how stable it remains once it gets there.
But if your understanding of DORA stopped at the original four metrics and the elite/high/medium/low tiers, it is time to update. The framework has evolved significantly. It now includes a fifth metric (Rework Rate), a quasi-metric (Reliability), and a complete replacement of the old performance tiers with seven team archetypes.
This guide covers what DORA metrics are, how they changed in 2024 and 2025, how AI is reshaping their interpretation, and how engineering leaders can use them to drive real improvement in 2026, especially when paired with a practical 2026 guide for engineering leaders on using all five DORA metrics.
DORA metrics are performance measurements that help teams deliver software more efficiently and quickly by tracking four core metrics: deployment frequency, lead time for changes, change failure rate, and mean time to recover (MTTR). These metrics are designed to measure team-level system capabilities, not individual performance, ensuring the focus remains on collective improvement and avoiding counterproductive behaviors.
The original framework included four metrics. As of 2025, it includes five formal metrics and one quasi-metric, grouped into two categories, and many teams still look for a comprehensive overview of DORA metrics and their role in software delivery performance.
Reliability sits alongside the five formal metrics as a broader indicator of operational performance. It captures the overall dependability of the system from an end-user perspective, separate from the deployment-specific signals that Change Failure Rate and Rework Rate track.
Before DevOps practices became mainstream, most organizations assumed throughput and stability were inherently opposed. Ship faster, expect more breakage. The DORA research proved this wrong. When you align development and operations around the same goals, the things teams do to improve throughput also increase stability. Automating deployments to increase speed, for example, also makes deployments more reliable and repeatable.
This is the core insight: speed and stability are not a trade-off. They reinforce each other when the right practices are in place.
For engineering leaders, DORA metrics serve as a common language across teams. In large organizations where multiple teams work on different products with different release cadences, DORA provides a consistent vocabulary for discussing delivery performance. A VP of Engineering can compare cycle time patterns across ten teams without relying on each team’s self-reported narrative.
Focused improvement is another key benefit. Retrospectives generate ideas, but those ideas do not always translate into measurable outcomes. DORA metrics close that loop and provide a baseline for setting goals, measuring progress, and helping teams identify areas that need improvement. As reliable metrics and practical key performance indicators, they let teams identify areas for improvement, and a practical overview of DORA metrics and how to implement them effectively can help leaders turn data into action. The statistical model of practices and capabilities produced by the research offers concrete experiments teams can run to improve and drive continuous improvement.
Alignment with business outcomes is a third function. DORA research across multiple years has consistently shown that teams performing well on these metrics are more likely to meet organizational performance targets, and research has found elite performers are twice as likely to meet those targets. The metrics connect engineering work to business goals without requiring individual-level tracking. DORA metrics reflect team-wide system capabilities, not individual performance reviews.
For years, DORA benchmarked teams into four performance tiers: elite, high, medium, and low. These tiers became the most widely cited element of the framework. Teams chased "elite" status. Dashboards color-coded against them. But the tiers were never meant to be used that way.
As RedMonk's analysis pointed out, DORA used cluster analysis, not fixed performance thresholds. Teams were not ranked against static definitions of what it meant to be "elite." The clusters were determined each year based on what metrics loaded together. Many organizations took a descriptive model and treated it as a prescriptive scorecard, but DORA was always intended to be a pattern detector, not a ruler.
In the 2025 report, DORA retired the four-tier classification entirely.
In place of the performance tiers, the 2025 report introduced seven team archetypes based on throughput, stability, and team well-being. The shift is significant: knowing your team type draws a map of what capabilities to improve, something the old performance tiers never did well.
The seven archetypes are:
Two teams can show similar DORA scores for completely different reasons. One may be genuinely healthy and well-balanced. Another may be performing under unsustainable pressure. The archetype model captures that distinction, where a single metric dashboard cannot.
The model is built on eight drivers of holistic performance, including burnout, friction, and time spent on valuable work. These dimensions form the foundation for the archetypes, ranging from Legacy Bottleneck (about 11% of respondents) to Harmonious High Achievers (roughly 20%).
The 2025 report was renamed from "State of DevOps" to "State of AI-Assisted Software Development." That is not a cosmetic change. It is a change of scope for the entire report.
According to the Google Cloud announcement, 90% of survey respondents report using AI at work. More than 80% believe it has increased their productivity. But the relationship between AI adoption and DORA metrics is more complicated than the adoption numbers suggest.
The central finding of the 2025 report is direct: AI does not fix a team; it amplifies what is already there. Strong teams use AI to become even better and more efficient when they have already mastered the core DORA metrics and their implementation. Struggling teams find that AI only highlights and intensifies their existing problems.
This has practical implications for how engineering leaders interpret their DORA numbers:
Alongside the team archetypes, the 2025 report introduced the DORA AI Capabilities Model, identifying seven foundational practices that determine whether AI benefits scale beyond individuals to organizational performance:
The model reinforces a theme that runs through the entire report: the greatest return comes not from the AI tools themselves, but from a strategic focus on the quality of internal platforms, the clarity of workflows, and the alignment of teams.
The 2025 DORA report found that 90% of organizations have adopted at least one platform, and there is a direct correlation between a high-quality internal platform and an organization's ability to unlock the value of AI. Platform engineering is not optional infrastructure. It is the foundation that determines whether AI tools accelerate delivery or accelerate dysfunction.
The metrics are only useful if they drive action. Here are the patterns that consistently show up when teams use DORA data well.
Never optimize one category at the expense of the other. A team with high deployment frequency but a climbing change failure rate is not improving. They are accelerating into instability. These are specific metrics for understanding devops performance, and reducing batch size is a practical way to improve throughput and stability over time.
The most useful diagnostic pairs:
PR size is not a DORA metric, but it is one of the strongest predictors of DORA outcomes. Large PRs take longer to review, are harder to reason about, and carry a higher probability of introducing defects. Teams that enforce PR size discipline (keeping changes under 200 lines where practical) consistently show better lead times and lower change failure rates.
In an AI-augmented environment, this matters more than before. AI tools can generate large volumes of code quickly, which often translates to larger PRs. Without explicit guardrails, the ease of generation works against the discipline of small, reviewable changes.
The relationship between review practices and stability metrics is well-documented in DORA research. Teams with thorough review processes show lower change failure rates and lower rework rates, which helps teams ship quality software. Teams where PRs merge with minimal or no review show the opposite pattern. Better lead time for changes usually comes from agile ways of working, automated code reviews, small batch deployments, streamlined processes, and automated testing.
With AI-generated code now comprising a growing share of merged PRs, the review step has shifted from “checking a colleague’s work” to “verifying machine-generated output against system context.” This is a different cognitive task. It requires reviewers to evaluate not just correctness, but architectural fit, security implications, and long-term maintainability.
DORA metrics focus on the deployment pipeline, but they can be combined with sprint-level signals to create a fuller picture of delivery health:
DORA metrics provide a strong foundation, but they were designed to measure delivery performance, not the full engineering experience. Several complementary frameworks have emerged.
The SPACE framework, co-authored by Nicole Forsgren (a founder of the DORA research program), measures developer productivity across five dimensions: Satisfaction, Performance, Activity, Communication, and Efficiency. It intentionally includes qualitative measures like satisfaction and well-being alongside quantitative delivery signals, and a deeper guide to mastering developer productivity with the SPACE framework can help teams operationalize these ideas.
SPACE is most useful when teams have already established DORA baselines and want to understand why their numbers look the way they do. A step-by-step view of how to measure developer productivity with SPACE makes it easier to connect delivery signals with human factors. A team with strong DORA metrics but declining satisfaction scores is at risk of attrition, something DORA alone would not surface.
The DX Core 4 framework focuses on four dimensions: Speed, Effectiveness, Quality, and Impact. It layers business outcome alignment on top of delivery metrics, helping organizations avoid optimizing one dimension at the expense of the others, similar to how a holistic SPACE-based approach to developer experience and productivity balances well-being with performance.
DORA is the right starting point for any team that does not yet have a structured measurement practice. It is simple, well-researched, and directly actionable. As teams mature, layering SPACE or DX Core 4 on top provides richer diagnostic capability without replacing the DORA baseline.
The 2025 DORA report itself makes this point: simple software delivery metrics alone are not sufficient. But they remain the strongest common baseline for delivery performance.
For teams that do not yet track DORA metrics, the path to implementation is straightforward:
The DORA framework has come a long way from four metrics and four tiers. It now encompasses five delivery metrics, a reliability quasi-metric, seven team archetypes, and an AI capabilities model. The 2025 report drew on nearly 5,000 technology professionals and over 100 hours of qualitative interviews.
The core message has not changed: teams that invest in strong engineering foundations, clear workflows, and healthy cultures deliver better software. What has changed is the context. AI has made it easier to generate code and harder to verify whether that code is actually improving outcomes. The bottleneck has shifted from production to verification.
DORA metrics remain the best shared baseline for understanding delivery performance. They are not sufficient on their own, and the DORA team says as much. But any measurement strategy that does not include them is missing the foundation.
The question for engineering leaders is no longer whether to track DORA metrics. It is whether you are reading them with the nuance that 2026 demands.

The rapid evolution of artificial intelligence (AI) is transforming the landscape of software development and delivery. For engineering leaders and DevOps professionals, understanding how to measure and optimize performance in this new era is more critical than ever. This article focuses on DORA metrics in the AI era, examining how these industry-standard benchmarks are evolving alongside AI and DevOps trends. We will explore why DORA metrics remain foundational, how they are being adapted to address the unique challenges of AI-driven development, and what new metrics are emerging to provide a more complete picture of modern software delivery. By understanding these changes, engineering leaders and DevOps professionals can ensure their teams remain competitive, resilient, and innovative in a rapidly changing environment.
As organizations increasingly adopt AI-assisted coding and automation, the traditional DORA metrics—long used to evaluate and enhance software development practices—are being re-examined. This article will address how DORA metrics in the AI era are evolving, why they matter for modern software delivery, and what new approaches are necessary to measure success in AI-driven workflows.
DORA metrics are the industry-standard benchmarks used by engineering teams to measure the speed, stability, and overall efficiency of software delivery, and a comprehensive overview of DORA metrics can help teams apply them effectively. The standard DORA framework tracks five key performance indicators: Deployment Frequency, Lead Time for Changes, Change Failure Rate, Failed Deployment Recovery Time, and Deployment Rework Rate.
Originally introduced by the DevOps Research and Assessment (DORA) group and popularized in the book Accelerate, these metrics provide a quantitative foundation for assessing and improving software delivery performance. In the AI era, they remain essential, but their limitations are becoming more apparent as AI-generated code and automation reshape development workflows.
Deployment Frequency measures how often code is successfully released to production. High deployment frequency indicates increased agility and the ability to respond quickly to market demands.
Lead Time for Changes measures the total time it takes for a code commit to successfully run in production. Short lead times are crucial for rapid delivery and seizing new business opportunities.
Change Failure Rate tracks the percentage of deployments that cause a failure in production, requiring a hotfix or rollback. A lower CFR enhances user experience and builds trust by reducing failures.
Failed Deployment Recovery Time (also known as Mean Time to Recover) measures how long it takes to restore services when a production incident occurs. Optimizing MTTR minimizes downtime and improves user satisfaction.
Deployment Rework Rate is tracked by the standard DORA framework and measures the proportion of deployments that require rework or additional fixes after initial release.
In 2021, DORA introduced Reliability as an additional metric, assessing operational performance through factors like availability, latency, and scalability. While not always quantifiable with a single target, reliability metrics help teams understand user-facing behavior and system robustness.
Now that we've defined the core DORA metrics, let's explore their ongoing role in DevOps performance and how they are adapting to the challenges of the AI era.
DORA metrics continue to serve as a baseline for measuring DevOps performance, providing actionable insights into the effectiveness of software delivery and operational capabilities, especially for teams mastering the implementation of DORA metrics in day-to-day practice. However, as AI becomes more integrated into development workflows, these metrics are being re-evaluated for their sufficiency.
Transition: As valuable as DORA metrics are, the rise of AI in software development is exposing their limitations and driving the need for new, AI-aware metrics.
While DORA metrics remain foundational, they are increasingly seen as insufficient in the AI era, and many teams now recognize that DORA metrics alone are insufficient to capture the full impact of AI on engineering performance. The introduction of AI coding tools and automation has changed the dynamics of software delivery in several ways:
To address these gaps, new metrics are being introduced:
These new metrics, as outlined in the Developer AI Impact Framework, are designed to provide a more comprehensive view of engineering performance in an AI-driven environment. By extending DORA metrics with measures like AI Code Share, Code Durability, and Innovation Rate, teams can better understand the true impact of AI on software delivery.
Transition: With these new challenges and metrics in mind, let's look at the key predictions for how DORA metrics will continue to evolve in the DevOps landscape.
Organizations will continue to use DORA as a baseline during AI adoption. However, as AI-generated code changes deployment frequency and lead time, DORA metrics will be extended to better reflect AI-driven workflows. Engineering leaders will integrate DORA with DevOps tools and track new metrics to benchmark performance and evaluate AI impact and ROI.
As systems grow more complex, observability and monitoring become essential. Enhanced observability helps detect issues introduced by AI-generated code earlier in the pipeline, impacting metrics like MTTR and CFR by enabling faster detection and resolution, especially when supported by an AI-powered engineering analytics platform for SDLC and DORA metrics.
Organizations are integrating DORA metrics with the SPACE framework to gain visibility into team health, collaboration, and human factors. This holistic approach combines technical outcomes with developer satisfaction and collaboration, ensuring that increased deployment frequency from AI does not come at the expense of meaningful output, and can be strengthened by platforms that help track and improve DORA metrics with Typo.
AI and ML technologies are reshaping software delivery. Integrating them with DORA metrics helps teams interpret how AI coding tools change delivery signals. New metrics like AI Code Share and Code Durability are essential for understanding the quality and longevity of AI-generated code, as faster code generation can shift bottlenecks to code review and deployment, especially when leveraging platforms that show how Typo uses DORA metrics to boost efficiency.
DORA metrics alone are insufficient; cultural transformation is required. Teams must focus on morale, collaboration, and psychological safety to navigate the transition to AI-driven workflows, especially as short-term metric volatility may occur during adoption.
With rising cyber-attacks, integrating security metrics with DORA provides a comprehensive view of software development performance, balancing speed and efficiency with security and risk management.
Transition: To stay ahead of these trends, organizations must adopt proactive strategies for measuring and improving software delivery in the AI era.
Transition: Leveraging the right tools can make tracking and interpreting DORA metrics—and their AI-era extensions—much easier and more actionable.
Typo is a software engineering intelligence platform that offers SDLC visibility, developer insights, and workflow automation to build better programs faster. It helps teams maintain DORA visibility while adding context for AI-era interpretation, so they can understand delivery speed and stability beyond traditional metrics alone.
Typo's DORA metrics dashboard features a user-friendly interface and robust capabilities tailored for DevOps excellence, closely aligning with best practices for building an effective DORA metrics dashboard. The dashboard aggregates data from multiple sources and presents it visually for engineering leaders and development teams.
Typo’s dashboard provides clear, intuitive visualizations of the four key DORA metrics—Deployment Frequency, Change Failure Rate, Lead Time for Changes, and Mean Time to Restore—displayed by week so teams can compare trends without relying solely on raw counts.
By providing benchmarks, Typo allows teams to compare their performance against industry standards and their own historical data, helping them track improvements or identify regressions, similar to capabilities found in the best DORA metrics trackers.
Find out what it takes to build reliable high-velocity dev teams
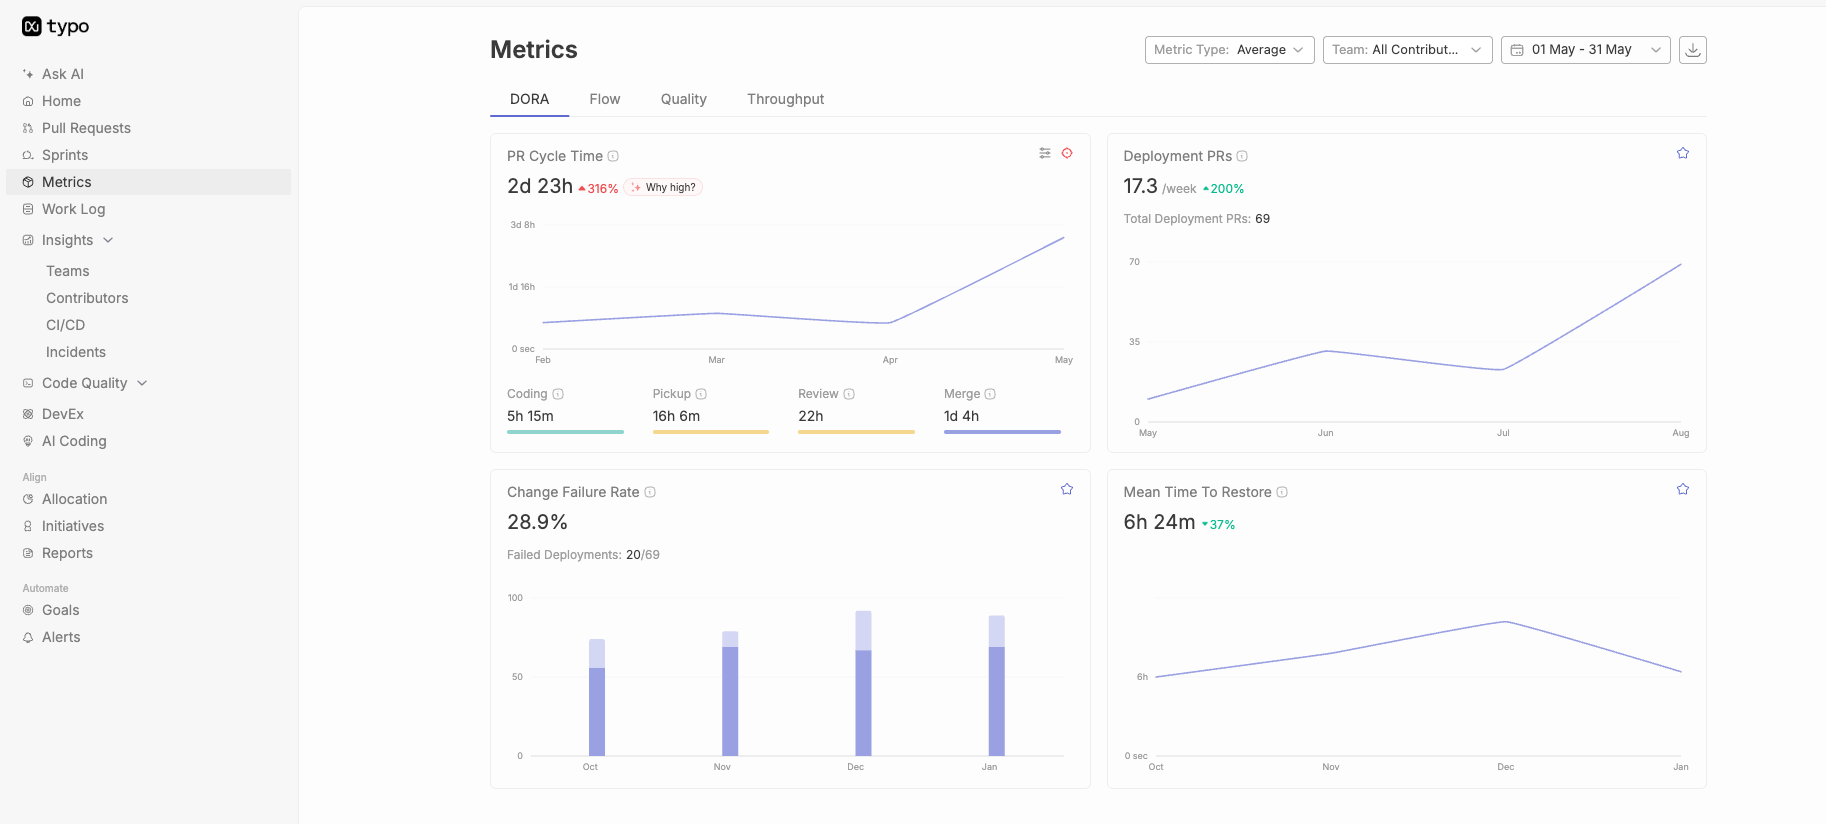
The rising adoption of DORA metrics in DevOps marks a significant shift toward data-driven software delivery practices. Integrating these metrics with operations, tools, and cultural frameworks enhances agility and resilience. However, as AI transforms software development, extending DORA with new metrics like AI Code Share, Code Durability, and Innovation Rate is essential for capturing the true impact of AI on engineering performance. Staying ahead of the curve requires continuous learning, automation, collaboration, and a culture of improvement to harness DORA metrics—and their AI-era extensions—for sustained innovation and success.

Cycle time is one of the important metrics in software development. It measures the time taken from the start to the completion of a process, providing insights into the efficiency and productivity of teams. Understanding and optimizing cycle time can significantly improve overall performance and customer satisfaction.
But why does Cycle Time truly matter? Think of Cycle Time as the speedometer of your engineering efforts. By measuring and improving Cycle Time, teams can innovate faster, outpace competitors, and retain top talent. Beyond engineering, it's also a vital indicator of business success.
Many teams believe their processes prove they care about speed, yet some may not be measuring any form of actual speed. Worse, they might rely on metrics that lead to dysfunction rather than genuine efficiency. This is where the insights of experts like Mary and Tom Poppendieck come into play. They emphasize that even teams who think they are efficient can benefit from reducing batch sizes and addressing capacity bottlenecks to significantly lower Cycle Time.
Rather than trusting your instincts, supplement them with quantitative measures. Tracking Cycle Time not only reduces bias but also establishes a reliable baseline for driving improvement, ensuring your team is truly operating at its peak potential.
This blog will guide you through the precise cycle time calculation, highlighting its importance and providing practical steps to measure and optimize it effectively.
Cycle time measures the total elapsed time taken to complete a specific task or work item from the beginning to the end of the process.
It is important to differentiate cycle time from other related metrics such as lead time, which includes all delays and waiting periods, and takt time, which is the rate at which a product needs to be completed to meet customer demand. Understanding these differences is crucial for accurately measuring and optimizing cycle time.
To gain a deeper understanding, consider the following related terms:
By familiarizing yourself with these terms, you can better understand the nuances of cycle time and how it interacts with other key performance metrics. This holistic view is essential for streamlining operations and improving efficiency.
To calculate total cycle time, you need to consider several components:
Tracking Cycle Time consistently across an organization plays a crucial role in understanding and improving the efficiency of an engineering team. Cycle Time is a measure of how long it takes for a team to deliver working software from start to finish. By maintaining consistency in how this metric is defined and measured, organizations can gain a reliable picture of their software delivery speed.
Here's why consistent tracking is significant:
Ultimately, the significance lies in its ability to offer a clear direction for improving workflow efficiency and ensuring teams continually enhance their performance.

Step 1: Identify the start and end points of the process:
Clearly define the beginning and end of the process you are measuring. This could be initiating and completing a task in a project management tool.
Step 2: Gather the necessary data
Collect data on task durations and time tracking. Use tools like time-tracking software to ensure accurate data collection.
Step 3: Calculate net production time
Net production time is the total time available for production minus any non-productive time. For example, if a team works 8 hours daily but takes 1 hour for breaks and meetings, the net production time is 7 hours.
Step 4: Apply the cycle time formula
The formula for cycle time is:
Cycle Time = Net Production Time / Number of Work Items Completed
Cycle Time= Number of Work Items Completed / Net Production Time
Example calculation
If a team has a net production time of 35 hours in a week and completes 10 tasks, the cycle time is:
Cycle Time = 35 hours / 10 tasks = 3.5 hours per task
Cycle Time= 10 tasks / 35 hours =3.5 hours per task
An ideal cycle time should be less than 48 hours. Shorter cycle times in software development indicate that teams can quickly respond to requirements, deliver features faster, and adapt to changes efficiently, reflecting agile and responsive development practices.
Understanding Cycle Time is crucial in the context of lean manufacturing and agile development. It acts as a speedometer for engineering teams, offering insights into how swiftly they can innovate and outperform competitors while retaining top talent.
When organizations practice lean or agile development, they often assume their processes are speedy enough, yet they may not be measuring any form of speed at all. Even worse, they might rely on metrics that can lead to dysfunction rather than true agility. This is where Cycle Time becomes invaluable, providing a quantitative measure that can reduce bias and establish a reliable baseline for improvement.
Longer cycle times in software development typically indicate several potential issues or conditions within the development process. This can lead to increased costs and delayed delivery of features. By reducing batch sizes and addressing capacity bottlenecks, as highlighted by experts in lean principles, even the most seemingly efficient organizations can significantly reduce their Cycle Time.
Rather than relying solely on intuition, supplementing your understanding with Cycle Time metrics can align development practices with business success, ensuring that your processes are truly lean and agile.
Defining the start and end of cycle time in software development can be quite complex, primarily because software doesn't adhere to the same tangible boundaries as manufacturing processes. Below are some key challenges:
Unlike manufacturing, where the beginning of a process is clear-cut, software development drifts into a gray area. Determining when exactly work begins is not straightforward. Does it start when a problem is identified, when a hypothesis is proposed, or only when coding commences? The early stage of software development involves a lot of brainstorming and planning, often referred to as the “fuzzy front end,” where tasks are less defined and more abstract.
The conclusion of the software cycle is also tricky to pin down. While delivering the final product—the deployment of production code—may seem like the logical end-point, ongoing iterations and updates challenge this notion. The very nature of software, which requires regular updates and maintenance, blurs the line between development and post-development.
To manage these challenges, software development is typically divided into design and delivery phases. The design phase encompasses all activities prior to coding, like research and prototyping, which are less predictable and harder to measure. On the other hand, the delivery phase, when code is written, tested, and deployed, is more straightforward and easier to track since it follows a set routine and timeframe.
External factors like changing client requirements or technological advancements can alter both the start and end points, requiring teams to revisit earlier phases. These interruptions make it difficult to have a standard cycle time, as the goals and constraints continually shift.
By recognizing these challenges, organizations can better strategize their approach to measure and optimize cycle time, ultimately leading to improved efficiency and productivity in the software development cycle.
When calculating cycle time, it is crucial to account for variations in the complexity and size of different work items. Larger or more complex tasks can skew the average cycle time. To address this, categorize tasks by size or complexity and calculate cycle time for each category separately.
Control charts are a valuable tool for visualizing cycle time data and identifying trends or anomalies. You can quickly spot variations and investigate their causes by plotting cycle times on a control chart.
Performing statistical analysis on cycle time data can provide deeper insights into process performance. Metrics such as standard deviation and percentiles help understand the distribution and variability of cycle times, enabling more precise optimization efforts.
In order to effectively track task durations and completion times, it’s important to utilize time tracking tools and software such as Jira, Trello, or Asana. These tools can provide a systematic approach to managing tasks and projects by allowing team members to log their time and track task durations consistently.
Consistent data collection is essential for accurate time tracking. Encouraging all team members to consistently log their time and task durations ensures that the data collected is reliable and can be used for analysis and decision-making.
Visual management techniques, such as implementing Kanban boards or other visual tools, can be valuable for tracking progress and identifying bottlenecks in the workflow. These visual aids provide a clear and transparent view of task status and can help teams address any delays or issues promptly.
Optimizing cycle time involves analyzing cycle time data to identify bottlenecks in the workflow. By pinpointing areas where tasks are delayed, teams can take action to remove these bottlenecks and optimize their processes for improved efficiency.
Measuring and improving Cycle Time significantly enhances your team’s efficiency. Delivering value to users more quickly not only speeds up the process but also shortens the developer-user feedback loop. This quick turnaround is crucial in staying competitive and responsive to users’ needs.
As you streamline your development process, removing roadblocks becomes key. This reduction in hurdles not only minimizes Cycle Time but also decreases sources of frustration for developers. Happier developers are more productive and motivated, setting off a Virtuous Circle of Software Delivery. This cycle encourages them to continue optimizing and improving, thus maintaining minimized Cycle Times.
Continuous improvement practices, such as implementing Agile and Lean methodologies, are effective for improving cycle times continuously. These practices emphasize a flexible and iterative approach to project management, allowing teams to adapt to changes and make continuous improvements to their processes.
Furthermore, studying case studies of successful cycle time reduction from industry leaders can provide valuable insights into efficient practices that have led to significant reductions in cycle times. Learning from these examples can inspire and guide teams in implementing effective strategies to reduce cycle times in their own projects and workflows.
By combining these strategies, teams can not only minimize Cycle Time effectively but also foster an environment of continuous growth and innovation.
Cycle Time, often seen as a measure of engineering efficiency, extends its influence far beyond the technical realm. At its core, Cycle Time reflects the speed and agility with which an organization operates. Here's how it can impact business success beyond just engineering:
In summary, Cycle Time is more than just a measure of workflow speed; it's a vital indicator of a company's overall health and adaptability. It influences everything from innovation cycles and competitive positioning to employee satisfaction and cross-functional productivity. By optimizing Cycle Time, businesses can ensure they are not just keeping pace but setting the pace in their industry.
Typo is an innovative tool designed to enhance the precision of cycle time calculations and overall productivity.
It seamlessly integrates Git data by analyzing timestamps from commits and merges. This integration ensures that cycle time calculations are based on actual development activities, providing a robust and accurate measurement compared to relying solely on task management tools. This empowers teams with actionable insights for optimizing their workflow and enhancing productivity in software development projects.
Here’s how Typo can help:
Automated time tracking: Typo provides automated time tracking for tasks, eliminating manual entry errors and ensuring accurate data collection.
Real-time analytics: With Typo, you can access real-time analytics to monitor cycle times, identify trends, and make data-driven decisions.
Customizable dashboards: Typo offers customizable dashboards that allow you to visualize cycle time data in a way that suits your needs, making it easier to spot inefficiencies and areas for improvement.
Seamless integration: Typo integrates seamlessly with popular project management tools, ensuring that all your data is synchronized and up-to-date.
Continuous improvement support: Typo supports continuous improvement by providing insights and recommendations based on your cycle time data, helping you implement best practices and optimize your workflows.
By leveraging Typo, you can achieve more precise cycle time calculations, improving efficiency and productivity.
In dealing with variability in task durations, it’s important to use averages as well as historical data to account for the range of possible durations. By doing this, you can better anticipate and plan for potential fluctuations in timing.
When it comes to ensuring data accuracy, it’s essential to implement a system for regularly reviewing and validating data. This can involve cross-referencing data from different sources and conducting periodic audits to verify its accuracy.
Additionally, when balancing speed and quality, the focus should be on maintaining high-quality standards while optimizing cycle time to ensure customer satisfaction. This can involve continuous improvement efforts aimed at increasing efficiency without compromising the quality of the final output.
Accurately calculating and optimizing cycle time is essential for improving efficiency and productivity. By following the steps outlined in this blog and utilizing tools like Typo, you can gain valuable insights into your processes and make informed decisions to enhance performance. Start measuring your cycle time today and reap the benefits of precise and optimized workflows.

As DevOps practices continue to evolve, it’s crucial for organizations to effectively measure DevOps metrics to optimize performance.
Here are a few common mistakes to avoid when measuring these metrics to ensure continuous improvement and successful outcomes:
In 2024, the landscape of DevOps metrics continues to evolve, reflecting the growing maturity and sophistication of DevOps practices. The emphasis is to provide actionable insights into the development and operational aspects of software delivery.
The integration of AI and machine learning (ML) in DevOps has become increasingly significant in transforming how teams monitor, manage, and improve their software development and operations processes. Apart from this, observability and real-time monitoring have become critical components of modern DevOps practices in 2024. They provide deep insights into system behavior and performance and are enhanced significantly by AI and ML technologies.
Lastly, Organizations are prioritizing comprehensive, real-time, and predictive security metrics to enhance their security posture and ensure robust incident response mechanisms.
DevOps metrics track both technical capabilities and team processes. They reveal the performance of a DevOps software development pipeline and help to identify and remove any bottlenecks in the process in the early stages.
Below are a few benefits of measuring DevOps metrics:
When clear objectives are not defined for development teams, they may measure metrics that do not directly contribute to strategic goals. This leads to scattered efforts and teams may achieve high numbers in certain metrics without realizing they are not contributing meaningfully to overall business objectives. This may also not provide actionable insights and decisions might be based on incomplete or misleading data. Lack of clear objectives makes it challenging to evaluate performance accurately and makes it unclear whether performance is meeting expectations or falling short.
Below are a few ways to define clear objectives for DevOps metrics:
Organizations usually focus on delivering products quickly rather than quality. However, speed and quality must work hand in hand. DevOps tasks must be accomplished by maintaining high standards and must be delivered to the end users on time. Due to this, the development team often faces intense pressure to deliver products or updates rapidly to stay competitive in the market. This can lead them to focus excessively on speed metrics, such as deployment frequency or lead time for changes, at the expense of quality metrics.
It is usually believed that the more metrics you track, the better you’ll understand DevOps processes. This leads to an overwhelming number of metrics, where most of them are redundant or not directly actionable. It usually occurs when there is no clear strategy or prioritization framework, leading teams to attempt to measure everything that further becomes difficult to manage and interpret. Moreover, it also results in tracking numerous metrics to show detailed performance, even if those metrics are not particularly meaningful.
Engineering leaders often believe that rewarding performance will motivate developers to work harder and achieve better results. However, this is not true. Rewarding specific metrics can lead to an overemphasis on those metrics at the expense of other important aspects of work. For example, focusing solely on deployment frequency might lead to neglecting code quality or thorough testing. This can also result in short-term improvements but leads to long-term problems such as burnout, reduced intrinsic motivation, and a decline in overall quality. Due to this, developers may manipulate metrics or take shortcuts to achieve rewarded outcomes, compromising the integrity of the process and the quality of the product.
Without continuous integration and testing, bugs and defects are more likely to go undetected until later stages of development or production, leading to higher costs and more effort to fix issues. It compromises the quality of the software, resulting in unreliable and unstable products that can damage the organization’s reputation. Moreover, it can result in slower progress over time due to the increased effort required to address accumulated technical debt and defects.
Below are a few important DevOps metrics:
Deployment Frequency measures the frequency of code deployment to production and reflects an organization’s efficiency, reliability, and software delivery quality. It is often used to track the rate of change in software development and highlight potential areas for improvement.

Lead Time for Changes is a critical metric used to measure the efficiency and speed of software delivery. It is the duration between a code change being committed and its successful deployment to end-users. This metric is a good indicator of the team’s capacity, code complexity, and efficiency of the software development process.

Change Failure Rate measures the frequency at which newly deployed changes lead to failures, glitches, or unexpected outcomes in the IT environment. It reflects the stability and reliability of the entire software development and deployment lifecycle. It is related to team capacity, code complexity, and process efficiency, impacting speed and quality.

Mean Time to Recover is a valuable metric that calculates the average duration taken by a system or application to recover from a failure or incident. It is an essential component of the DORA metrics and concentrates on determining the efficiency and effectiveness of an organization’s incident response and resolution procedures.

Optimizing DevOps practices requires avoiding common mistakes in measuring metrics. To optimize DevOps practices and enhance organizational performance, specialized tools like Typo can help simplify the measurement process. It offers customized DORA metrics and other engineering metrics that can be configured in a single dashboard.
Sign up now and you’ll be up and running on Typo in just minutes

We're on a mission to build engaged, productive tech teams. Try it out for free!


Follow us on:
We're on a mission to build engaged, productive tech teams. Try it out for free!
Follow us on:


