Software engineering teams are crucial for the organization. They build high-quality products, gather and analyze requirements, design system architecture and components, and write clean, efficient code. Hence, they are the key drivers of success.
Measuring their success and considering if they are facing any challenges is important. And that’s how Engineering Analytics Tools comes to the rescue. One of the popular tools is LinearB, which engineering leaders and CTOs across the globe have widely used. However, many organizations seek a LinearB alternative to better align with their unique requirements. LinearB lacks built-in AI/ML forecasting for software delivery, which can be a limitation for teams looking for advanced predictive capabilities.
While this is usually the best choice for organizations, there might be chances that it doesn’t work for you. Worry not! We’ve curated the top 6 LinearB alternatives that you can take note of when considering engineering analytics tools for your company. In addition to analytics, you may want to consider an engineering management platform—a comprehensive solution that supports strategic planning, financial integration, and team performance monitoring, going beyond basic analytics to help align engineering efforts with business goals.
In the domain of engineering analytics and performance optimization, numerous development organizations initially gravitate toward LinearB as their primary solution for monitoring and optimizing software development life cycle workflows. However, the heterogeneous nature of engineering teams and their specialized requirements often reveals that LinearB's architectural limitations and feature constraints can significantly impede an organization's capacity to derive comprehensive engineering intelligence and execute truly data-driven decision-making processes.
This technological gap necessitates the exploration of LinearB alternatives that deliver enhanced analytical capabilities, sophisticated metrics aggregation, and advanced workflow optimization features specifically engineered to support diverse engineering methodologies and organizational objectives.
Contemporary software engineering intelligence platforms—exemplified by sophisticated solutions such as Typo and Jellyfish—provide comprehensive analytical frameworks that encompass multi-dimensional performance metrics, advanced bottleneck identification algorithms, and predictive optimization capabilities for development workflows.
These platforms transcend conventional metric collection by implementing machine learning-driven engineering intelligence that empowers development teams to execute strategic, data-informed decisions while continuously optimizing their software engineering processes through automated analysis and trend prediction. Jellyfish, designed for larger organizations, excels at combining engineering metrics with comprehensive financial reporting, making it a strong contender for enterprises seeking integrated insights.
Through systematic evaluation of LinearB alternatives, engineering organizations can identify platforms that demonstrate superior alignment with their specific technological requirements, deployment architectures, and performance objectives, thereby ensuring optimal access to actionable insights and comprehensive analytics necessary for achieving competitive advantage in today's rapidly evolving software engineering ecosystem. Alternatives to LinearB include Jellyfish, Swarmia, Waydev, Haystack, and Axify, each with its own focus.
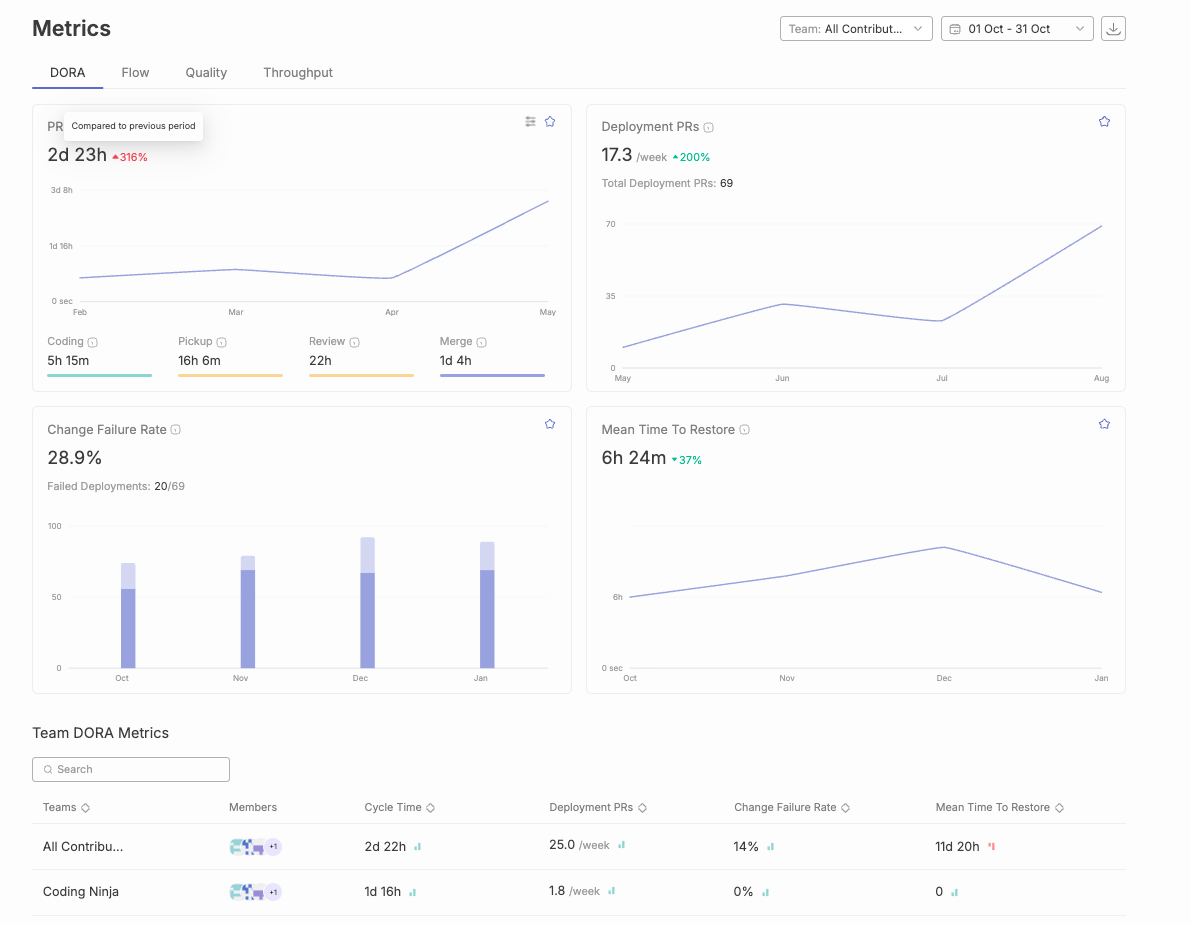
LinearB is a well-known software engineering analytics platform that measures GIT data, tracks DORA metrics, and collects data from other tools. By combining visibility and automation, it enhances operational efficiency and provides a comprehensive view of performance. Additionally, it delivers real-time metrics to help teams monitor progress and identify issues as they arise. Its project delivery forecasting and goal-setting features help engineering leaders stay on schedule and monitor team efficiency. LinearB can be integrated with Slack, JIRA, and popular CI/CD tools. However, LinearB has limited features to support the SPACE framework and individual performance insights.

Worry not! We’ve curated the top 6 LinearB alternatives that you can take note of when considering engineering analytics tools for your company.
However, before diving into these alternatives, it’s crucial to understand why some organizations seek other options beyond LinearB. Despite its popularity, there are notable limitations that may not align with every team's needs:
Understanding these limitations can help you make an informed decision as you explore other tools that might better suit your team's unique needs and workflows, especially when it comes to optimizing your team's performance and integrating with project management tools.
Besides LinearB, there are other leading alternatives as well.
Take a look below:
Typo is another popular software engineering intelligence platform that offers SDLC visibility, developer insights, and workflow automation for building high-performing tech teams. It can be seamlessly integrated into the tech tools stack including the GIT version (GitHub, GitLab), issue tracker (Jira, Linear), and CI/CD (Jenkins, CircleCI) tools to ensure a smooth data flow. Typo also offers comprehensive insights into the deployment process through key DORA and other engineering metrics. With its automated code tool, the engineering team can identify code issues and auto-fix them before merging to master.
G2 Reviews Summary - The review numbers show decent engagement (11-20 mentions for pros, 4-6 for cons), with significantly more positive feedback than negative. Notable that customer support appears as a top pro, which is unique among the competitors we've analyzed.
Freemium plan with premium plans starting from USD 20 / Git contributor / month billed annually.
Jellyfish is a leading GIT tracking tool for tracking metrics by aligning engineering insights with business goals. It analyzes the activities of engineers in a development and management tool and provides a complete understanding of the product. Jellyfish shows the status of every pull request and offers relevant information about the commit that affects the branch. It can be easily integrated with JIRA, Bitbucket, Gitlab, and Confluence.
G2 Reviews Summary - The feedback shows strong core features but notable implementation challenges, particularly around configuration and customization.
Link to Jellyfish's G2 reviews

Quotation on Request
Swarmia is a popular tool that offers visibility across three crucial areas: business outcome, developer productivity, and developer experience. It provides quantitative insights into the development pipeline. It helps the team identify initiatives falling behind their planned schedule by displaying the impact of unplanned work, scope creep, and technical debt. Swarmia can be integrated with tech tools like source code hosting, issue trackers, and chat systems.
G2 Reviews Summary - The reviewsgives us a clearer picture of Swarmia's strengths in alerts and basic metrics, while highlighting its limitations in customization and advanced features.

Freemium plan with premium plans starting from USD 39 / Git Contributor / month billed annually.
Waydev is a software development analytics platform that uses an agile method for tracking output during the development process. It puts more stress on market-based metrics and gives cost and progress of delivery and key initiatives. Its flexible reporting allows for building complex custom reports. Waydev can be seamlessly integrated with Gitlab, Github, CircleCI, AzureOPS, and other well-known tools.
G2 Reviews Summary - The very low number of reviews (only 1-2 mentions per category) suggests limited G2 user feedback for Waydev compared to other platforms like Jellyfish (37-82 mentions) or Typo (20-25 mentions). This makes it harder to draw reliable conclusions about overall user satisfaction and platform performance.

Freemium plan with premium plans starting from USD 29 / Git Contributor / month billed annually.
Pluralsight Flow provides a detailed overview of the development process and helps identify friction and bottlenecks in the development pipeline. It tracks DORA metrics, software development KPIs, and investment insights which allows for aligning engineering efforts with strategic objectives. Pluralsight Flow can be integrated with various manual and automated testing tools such as Azure DevOps, and GitLab.
G2 Reviews Summary - The review numbers show moderate engagement (6-12 mentions for pros, 3-4 for cons), placing it between Waydev's limited feedback and Jellyfish's extensive reviews. The feedback suggests strong core functionality but notable usability challenges.
Link to Pluralsight Flow's G2 Reviews

Freemium plan with premium plans starting from USD 38 / Git Contributor / month billed annually.
Sleuth assists development teams in tracking and improving DORA metrics. It provides a complete picture of existing and planned deployments as well as the effect of releases. Sleuth gives teams visibility and actionable insights on efficiency and can be integrated with AWS CloudWatch, Jenkins, JIRA, Slack, and many more.
G2 Reviews Summary - Similar to Waydev, Sleuth has very limited G2 review data (only 1 mention per category). The extremely low number of reviews makes it difficult to draw meaningful conclusions about the platform's overall performance and user satisfaction compared to more reviewed platforms like Jellyfish (37-82 mentions) or Typo (11-20 mentions). The feedback suggests strengths in visualization and integrations, but the sample size is too small to be definitive.

Quotation on Request.
Selecting the optimal LinearB alternative necessitates a comprehensive analysis framework that examines your engineering organization's specific technical requirements, operational workflows, and strategic development objectives. This involves evaluating whether your development teams require sophisticated external benchmarking capabilities to conduct comparative performance analysis against industry-standard metrics, or if real-time data streaming and live dashboard functionality represent critical infrastructure components for your continuous integration and deployment pipelines. These platforms must deliver quantitative analytics that facilitate data-driven decision-making processes, support automated performance optimization algorithms, and enable strategic roadmap planning through predictive modeling and historical trend analysis.
The evaluation process also encompasses identifying tools that streamline resource allocation algorithms, enhance project delivery forecasting accuracy through machine learning models, and provide robust support infrastructure for ongoing engineering operations and maintenance workflows. Platforms such as Typo, Jellyfish, and Pluralsight Flow each demonstrate distinct architectural strengths and specialized capabilities, requiring engineering teams to analyze factors including API integration flexibility, customization framework extensibility, advanced analytics depth, and scalability patterns for enterprise-level implementations.
These tools leverage sophisticated data processing engines to analyze development velocity metrics, code quality indicators, and team productivity patterns. By systematically evaluating these technical parameters and operational requirements, engineering organizations can identify a LinearB alternative that not only addresses their current infrastructure demands but also provides horizontal scalability to accommodate evolving development methodologies, ultimately optimizing software delivery pipelines and achieving measurable business impact through enhanced engineering productivity.
Engineering management platforms streamline workflows by seamlessly integrating with popular development tools like Jira, GitHub, CI/CD and Slack. Platforms like Code Climate Velocity also offer integration capabilities, focusing on code quality and developer analytics. This integration offers several key benefits:
By leveraging these integrations, teams can significantly improve their productivity and focus on building high-quality products.
For engineering teams operating in today's software development landscape, implementing data-driven decision making methodologies has become fundamental to achieving operational excellence and establishing sustainable continuous improvement frameworks. LinearB alternatives serve as comprehensive analytics platforms that provide extensive engineering intelligence, offering detailed historical data analysis, real-time performance metrics, and predictive insights that systematically inform every stage of the development lifecycle. These sophisticated tools analyze vast datasets from version control systems, CI/CD pipelines, and project management platforms to deliver actionable intelligence that transforms how engineering organizations operate and make strategic decisions.
Through access to granular engineering metrics and comprehensive analytical insights, development teams can execute informed decision-making processes regarding resource allocation strategies, project delivery forecasting methodologies, and workflow optimization techniques. These advanced platforms enable engineering organizations to identify performance trends across multiple development cycles, anticipate potential bottlenecks and technical challenges, and proactively address accumulated technical debt through data-backed remediation strategies. The systematic analysis of code review cycles, deployment frequencies, and developer productivity patterns ensures that all engineering efforts remain strategically aligned with broader business objectives while maintaining optimal development velocity and code quality standards.
By leveraging sophisticated data analytics capabilities and machine learning algorithms, engineering teams can establish a robust culture of continuous improvement that enhances cross-functional collaboration and delivers measurable organizational outcomes. LinearB alternatives empower development organizations to transcend intuition-based decision making and eliminate guesswork from their operational processes, ensuring that every strategic decision is grounded in reliable empirical data and comprehensive engineering intelligence derived from real-world development patterns and performance metrics.
Software development analytics tools are important for keeping track of project pipelines and measuring developers' productivity. It allows engineering managers to gain visibility into the dev team performance through in-depth insights and reports.
Take the time to conduct thorough research before selecting any analytics tool. It must align with your team's needs and specifications, facilitate continuous improvement, and integrate with your existing and forthcoming tech tools.
All the best!


Implement engineering metrics, gather SDLC insights & set continuous improvement goals in your dev teams.
Try Live Demo
We're on a mission to build engaged, productive tech teams. Try it out for free!


Follow us on:


