

AI coding tools are everywhere. Your teams are using them. Output is up, cycles are shorter, and from the outside, everything looks like it's working.
But if you're an engineering leader responsible for delivery at scale, you've probably noticed something harder to explain: the numbers look good, yet confidence hasn't kept up. Planning feels less predictable. Reviews take longer or get thinner. Rework appears in places it didn't before. The system is faster, but it's also harder to reason about.
This is the core problem with AI measurement today. The metrics most organizations rely on were designed for a purely human workflow. They measure activity, not the way AI is reshaping the system underneath.
This post summarizes the AEGIS framework, a practical approach to measuring and governing AI across the software delivery lifecycle, built for engineering leaders who need to make decisions about AI with clarity, not assumptions.
Most engineering organizations track AI adoption through usage rates. How many developers have access. How many are actively using AI tools. How often AI-assisted PRs are being merged.
These numbers tell you that AI is present. They don't tell you what AI is doing to your delivery system.
The problem runs deeper than missing dashboards. When AI accelerates one part of the workflow, it shifts pressure to other parts. Code gets written faster, but reviews absorb more complexity. Merge frequency increases, but so does the surface area for defects. Cycle times drop, but the bottleneck moves from authoring to verification, and nobody adjusts the process to account for it.
Traditional metrics miss this because they were never designed to capture system-level shifts. Velocity, story points, lines of code, these are pre-AI signals. In an AI-assisted workflow, more output can mean more risk, and faster cycles can mean less control.
Engineering leaders need a measurement approach that captures what AI actually changes, not just where AI is used.
Before introducing the framework, it's worth naming the patterns that consistently mislead leadership when AI measurement is done with legacy tools.
The adoption fallacy. Teams are using AI, so leadership assumes it's creating value. But usage alone does not measure impact or prove business value. AI makes it easy to produce more, not necessarily better. Without examining what happens after code is written, high adoption can feel reassuring while problems quietly accumulate downstream.
The velocity fallacy. Cycles are shorter, so the assumption is that delivery is healthier. But faster doesn't always mean better, and speed often comes with a trade off in control. In many teams, speed comes from compressing review time or pushing understanding downstream. The system looks faster, but oversight has thinned and rework is deferred.
The stability blind spot. Nothing has broken yet, so risk must be low. AI-related issues rarely fail loudly at first. Bigger changes, lighter reviews, deferred cleanup, these build gradually and surface all at once. By the time the signal is visible, relying on a single metric has already hidden how much the cost of correction has compounded.

These are not failures of judgment. They are the predictable outcome of applying outdated measurement to a changed system.
AEGIS is a system-level AI measurement framework that helps engineering leaders measure, interpret, and govern the impact of AI across the software delivery lifecycle, and it pairs naturally with modern software engineering intelligence platforms that aggregate delivery, quality, and developer-experience data. It is a core part of governing an AI system, not just observing it.
It doesn't produce a single score. It doesn't rank developers. It doesn't compare AI vendors. What it does is provide a structured lens for understanding how AI is changing delivery behavior, so leaders can make decisions based on evidence rather than assumption.
AEGIS evaluates AI's impact across five interconnected dimensions. Many frameworks begin with three dimensions: utilization, impact, and cost. AEGIS extends that baseline for software development use so teams can connect AI activity to reliability, fairness, and business impact.
Adoption looks at where AI is truly embedded in work, not just enabled. Which teams rely on it, for what types of tasks, and at what depth. Common adoption metrics include daily active users, and usage data should show how often and by whom AI assistants are used. Two teams with the same output can be operating in completely different ways, and that difference matters for risk and capability.
Execution focuses on how delivery flow is shifting. Changes in throughput, cycle time distributions, bottleneck relocation, whether AI is smoothing work or creating bursts and stalls. To understand effects on engineering performance and developer productivity, AEGIS uses the same metrics already tracked in software delivery rather than inventing a separate signal. AEGIS treats these patterns as signals about the system, not as proof of success.
Guardrails measures whether acceleration is staying safe. Review depth during code review, quality metrics, failure rate patterns, change failure rate movement, and defect rate shifts on AI generated code all matter here. The question is whether quality controls are holding up as the pace of delivery increases.
Integrity asks what the codebase will feel like a year from now. Maintainability, readability, churn, architectural consistency, and dependence on reasoning that no human fully reviewed. This is also where teams need to monitor model performance, data quality, fairness, and robustness as machine-generated outputs influence the codebase over time. This is where long-term cost accumulates invisibly.
Sustainability looks at the humans in the system. Workload distribution, context switching, cognitive strain, reviewer concentration, and whether teams are building skills or building dependency. It also includes developer experience, since developers report time savings differently from measurable delivery gains. A system that delivers today but exhausts teams tomorrow is not a system that scales.
These dimensions are intentionally interdependent. Strong adoption can reduce integrity if understanding falls. Better execution can weaken guardrails if reviews thin out. The value of AEGIS is in reading them together, not in isolation.

The full framework, including the Decision Matrix, quarterly review template, and implementation guide, is available in the complete e-book: Measuring and Governing AI in Software Delivery.
The framework should define objectives, metrics, and evaluation methods, then be reviewed continuously as the AI system and user behavior change, ideally supported by a modern engineering intelligence platform that unifies these signals.
Download the AEGIS Framework E-book →
For engineering leaders, the question is never "is AI good or bad?" It is "how is AI reshaping our system, and at what cost?" Interpreting an ai measurement framework means tying AI-assisted coding impact metrics to broader outcomes and business goals, not just delivery movement.
AEGIS surfaces four patterns that matter most at the leadership level.
When speed increases and quality stays stable, AI is providing structural leverage. Existing practices are absorbing the acceleration. Developers often report AI time savings of about 3.9 hours a week from reduced coding time, but measured PR throughput gains are often much smaller. The risk here is complacency, assuming today's stability guarantees tomorrow's.
When speed increases and quality drops, AI is creating hidden technical debt. Production time compresses while verification burden expands. Reviews get thinner. Post-merge fixes increase. Architecture drifts under syntactically correct code. Generative AI can both address and exacerbate technical debt, and AI-assisted changes can raise change failure rate by about 2 percentage points, with some teams seeing failure rates rise by 50% after adoption. This is a governance gap, not a tooling problem.
When signals diverge across stages, the organization is running two operating models simultaneously. AI accelerates creation but isn't integrated into review. Ownership boundaries assume human authorship, which complicates AI-powered remote code reviews. Workflow alignment has not caught up with tooling adoption.
When the system degrades despite healthy throughput, AI is amplifying pre-existing weaknesses. Where tests were brittle, reviews informal, or architecture undocumented, AI accelerates the failure path. AI usage can grow 65% while median time savings in output metrics stay closer to 8%, so throughput alone does not tell the full story. The remedy is process architecture, not more model architecture, backed by AI-powered engineering analytics that expose where the system is actually straining.
Frameworks fail when they stop at observation. AEGIS is designed as a deliberate measurement strategy that moves from evaluation to action.
The AEGIS Decision Matrix maps signals along two axes: Impact (synthesizing Adoption and Execution signals) and Risk (synthesizing Guardrails, Integrity, and Sustainability). These two axes are independent. High impact does not imply low risk. Leaders should compare adoption with development productivity instead of assuming one stands in for the other, because impact evaluates whether AI improves productivity and output quality.
This creates four quadrants, each with a clear leadership response, especially when paired with an AI engineering intelligence platform that surfaces impact and risk signals in real time.
Scale (high impact, low risk): AI is delivering measurable improvements without degrading quality or team health. Expand usage, codify patterns, invest in enablement, and consider AI-native engineering intelligence to standardize how you track those gains. But scale incrementally and keep watching signals across cycles.
Stabilize (high impact, high risk): AI is improving execution but introducing hidden costs. Add guardrails, constrain usage in high-risk domains, improve workflow design. This is the most common and most important quadrant for mature organizations.
Investigate (low impact, low risk): AI usage is safe but benefits are unclear. Improve measurement quality, segment by work type, run targeted experiments. The industry-wide benchmark for monthly active AI tool users is 93%, and 93% of developers use AI tools monthly, so AI tool adoption rates should be tracked alongside their impact on productivity rather than treated as proof of value on their own, much like data- and empathy-driven efficiency practices track both delivery and satisfaction. Don't force scale. Lack of impact is often about context, not tooling.
Step back (low impact, high risk): AI is neither improving outcomes nor remaining safe. Reduce scope, re-baseline workflows, reassess fit for specific teams or code paths. Once the organization is reading adoption and impact together, compare different tools and tool integrations before expanding usage again. Stepping back is a governance success, not a failure.
Each placement should be reviewed quarterly, at the leadership level, with a short evidence summary and a defined next action.

Even with a structured framework, AI measurement can go wrong in predictable ways, and these common pitfalls usually come from reading activity too quickly as impact.
Treating adoption as success is the most common one. High usage can coexist with flat delivery outcomes when AI is applied to the wrong stages or tasks. Most teams overread adoption metrics when trust in AI-generated code is still uneven. Measuring where AI is used and what actually improves are two different exercises.
Reading short-term speed as long-term improvement is equally dangerous. Many AI-related quality issues, rework, architectural drift, operational load, appear weeks or months later. Quarterly review windows exist for this reason.
Using AI metrics to judge individuals destroys signal quality. When AI output gets tied to performance, people optimize for appearance over outcomes. Only 46% of developers fully trust AI-generated code, which is one reason subjective trust and local behavior can distort the data. Trust erodes. Measurement becomes unreliable. AEGIS operates at the system and cohort level for exactly this reason.
Locking decisions too early is the subtlest trap. Early AI gains lead to aggressive scaling and fixed policies. Teams adopt AI too quickly when they lock policies before they have a baseline. But AI impact stabilizes only after workflows, reviews, and ownership models adjust. Early conclusions are often reversed later, at higher cost.
AI has moved past the adoption phase for most organizations. The question is no longer whether to use AI in software development, but how to lead an AI-native engineering organization that AI is actively reshaping; in some environments, including Google, roughly 30% of new code is AI-generated.
That requires measurement that captures system behavior, not local acceleration. Leaders need to measure AI's impact across the full software development process, not just code authoring or time saved writing code. It requires separating impact from risk so both can be governed independently, using a mix of automated signals and human evaluation from the engineering team. And it requires treating AI adoption as an evolving condition, not a one-time rollout.
AEGIS provides the structure for that. Not a dashboard, not a score, but a leadership framework for understanding what AI is actually doing to your delivery system and making decisions you can defend with evidence.
The full framework, including the Decision Matrix, quarterly review template, and implementation guide, is available in the complete e-book: Measuring and Governing AI in Software Delivery—with senior engineers as part of the governance loop that turns framework signals into decisions.
Download the AEGIS Framework E-book →

Choosing the right engineering management platform is more critical than ever in 2026. This guide reviews the best alternatives to Jellyfish for engineering leaders, managers, and decision-makers who are seeking to optimize team performance, align engineering with business goals, and adapt to the rapidly evolving landscape of AI, developer experience, and workflow automation. With the increasing importance of actionable insights, real-time data, and seamless integration, selecting the right platform can directly impact your organization’s ability to deliver value, improve productivity, and stay competitive.
Jellyfish built its reputation as the pioneer engineering management platform. Since launching in 2017, the company has raised $114.5 million in funding from Accel, Insight Partners, and Tiger Global. Its core strength is aligning engineering work with business objectives, giving CFOs and VPs of Engineering a shared language around investment allocation, resource planning, engineering effort, and resource allocation—key aspects tracked by such platforms for effective capacity planning and workload management.
That positioning served enterprise buyers well for years. But the engineering intelligence category has shifted. AI coding tools are now standard across most teams. The 2025 DORA Report introduced new measurement frameworks. Developer experience has become a board-level priority. Today, aligning engineering activities with business goals and supporting business teams with actionable insights is critical for organizations seeking to optimize outcomes.
Platforms must now provide seamless integration with existing tools to enable real-time data aggregation, supporting new measurement frameworks and the growing focus on developer experience.
The question is no longer “Where is my engineering time going?” It is “How do I measure the real impact of AI tools on delivery, code quality, and developer experience, all at once?” Making data-driven decisions is now essential for evaluating the impact of engineering investments and driving continuous improvement.
If you are evaluating Jellyfish alternatives, you are likely dealing with one or more of these friction points.
Jellyfish is a capable platform for enterprise engineering management. It does several things well: investment allocation, capacity planning, R&D cost reporting, and executive dashboards. For organizations with deep Jira workflows and clean data hygiene, it provides solid visibility into where engineering time goes. Jellyfish focuses on quantitative metrics and tracking key metrics, offering dashboards and reports that help monitor team performance, but it may lack qualitative and tailored insights that provide a more complete understanding of engineering productivity.
But several patterns consistently push teams toward alternatives.
Pricing requires a sales conversation. Jellyfish does not publish pricing publicly. According to Vendr’s 2026 analysis, buyers with 50–150 engineering seats on annual contracts often see pricing in the range of $50,000–$120,000 per year. For mid-market teams with 50–200 engineers, that is a significant commitment before you have even seen the platform in action.
Setup and onboarding take time. Multiple competitor analyses and user reviews on G2 note that Jellyfish has a steep learning curve. Users report that training is vital to use the product well, and initial configuration can take weeks. Several G2 reviewers cite complex setup and the need for dedicated staff to manage the platform.
Heavy Jira dependency. Jellyfish treats Jira as its primary system of record. For teams using Linear, GitHub Issues, or hybrid setups, this Jira-centricity can become a constraint. As Faros AI’s analysis points out, Jellyfish’s approach can undercount engineering activities not tied to Jira issues. When only quantitative data is considered, technical debt and workflow bottlenecks can be overlooked, impacting long-term engineering efficiency.
Limited AI coding impact measurement until recently. Jellyfish launched AI Impact tracking in late 2024 and has expanded it since. However, many teams evaluating alternatives report needing deeper AI measurement: not just adoption tracking (who is using Copilot or Cursor), but actual impact on cycle time, code quality, and PR outcomes across AI-assisted versus non-AI PRs.
No automated code review. Jellyfish does not include a code review agent. If you want AI-powered code review alongside your engineering analytics, you need a separate tool or a platform that bundles both.
Customization gaps. G2 reviews consistently flag limited customization as a friction point. Of the top complaint themes, 21 mentions specifically call out lack of custom reporting flexibility, and 19 mentions note limited features and integration depth. Teams increasingly need comprehensive code insights and tailored insights to better understand team performance and address unique workflow challenges.
Many software teams struggle with the limitations of purely quantitative data, realizing it doesn't tell them how to improve or what's happening outside of platforms like Git and Jira, which can hinder actionable progress and slow development speed.
Before comparing specific platforms, it helps to know what separates a useful engineering intelligence tool from one that creates more dashboard fatigue. Here is what matters in 2026. Seamless integration with existing tools and customizable dashboards is essential for capturing real time data, enabling actionable insights, and supporting better decision-making across engineering teams.
Effective AI-powered workflow optimization requires tools that provide clear, actionable insights to highlight bottlenecks in the development process and offer specific recommendations for data-driven improvements. Seamless integration with existing tools is crucial for automatic data capture and improved decision-making.
Alternatives to Jellyfish, such as DX, LinearB, Swarmia, Haystack, Waydev, and Pluralsight Flow, address the main limitations of Jellyfish by offering a more comprehensive approach to engineering management. These platforms combine both qualitative and quantitative insights, allowing teams to track performance and identify bottlenecks more effectively. Platforms like Swarmia and Pluralsight Flow provide engineering teams with tools that focus on team dynamics and workflow optimization, which can be more beneficial than Jellyfish's top-down reporting approach. Jellyfish is often criticized for its limited customization and lack of focus on developer experience, which has led many teams to seek alternatives that offer better insights into daily challenges faced by developers. Additionally, alternatives like Haystack and Waydev emphasize real-time insights and proactive identification of bottlenecks, enhancing team productivity compared to Jellyfish's more rigid reporting structure.
When evaluating alternatives to Jellyfish, it's important to consider how some platforms position themselves as engineering effectiveness platforms—offering not just analytics, but comprehensive solutions for operational efficiency, code quality, and developer productivity. The table below compares seven alternatives across the capabilities that matter most for engineering leaders in 2026.
Notably, alternatives to Jellyfish such as DX and Typo AI combine both qualitative and quantitative insights, enabling teams to track performance and identify bottlenecks more effectively than platforms focused solely on high-level metrics.
Typo AI is an engineering effectiveness platform that combines SDLC visibility, AI coding tool impact measurement, automated AI code reviews, and developer experience surveys in a single product. It provides comprehensive code insights and tracks DORA and SPACE metrics to help teams optimize productivity, software health, and operational efficiency. Typo connects to GitHub, GitLab, Bitbucket, Jira, Linear, and CI/CD pipelines.
Where Typo differs from Jellyfish is scope and speed. Jellyfish focuses primarily on engineering-to-business alignment, investment allocation, and financial reporting. Typo starts from how work actually moves through the SDLC and layers in AI impact, code quality, and developer experience on top of that foundation, reflecting its broader mission to redefine engineering intelligence.
Key strengths:
Customer proof points:
Typo is a G2 Leader with 150+ reviews, trusted by 1,000+ engineering teams, and featured in Gartner’s Market Guide for Software Engineering Intelligence Platforms.
Best for: Engineering teams at mid-market SaaS companies (50–500 engineers) who need unified visibility across delivery, AI impact, code quality, and developer experience, without the enterprise pricing or multi-week onboarding—and who are evaluating why companies choose Typo for this use case.
LinearB focuses on engineering workflow automation, DORA metrics, and cycle time analytics. As an engineering analytics tool, it provides instant insights and workflow automation, delivering automated improvement actions like PR bots and alerts that help teams enforce working agreements around PR size, review turnaround, and merge frequency.
Where LinearB stands out: It is actionable at the team level. Instead of high-level allocation reporting, LinearB provides specific bottleneck identification, tracks key engineering metrics, and offers automated fixes. The free tier is generous for small teams, making it an accessible starting point.
Where it falls short versus Jellyfish alternatives: LinearB does not include native AI coding impact measurement. It does not offer automated code review. And it lacks DevEx survey capabilities. Teams who need to measure how AI tools affect delivery or who want code review bundled into their analytics platform will need to look elsewhere.
Best for: Engineering managers focused on process efficiency who want automated interventions in their development pipeline, particularly those starting with a free-tier budget. Alternatives like Haystack and Waydev emphasize real-time insights and proactive identification of bottlenecks, enhancing team productivity.
Swarmia combines DORA metrics with developer experience signals. It tracks cycle time, deployment frequency, and review throughput alongside “working agreements” that let teams set norms like PR size limits and review turnaround expectations. Swarmia helps development teams and software development teams track quality metrics and improve team's productivity by providing actionable insights and real-time analytics.
Where Swarmia stands out: Clean UX. Team-first approach. Positions itself explicitly as the “humane alternative to engineering surveillance,” which resonates with engineering leaders who care about developer experience as much as process metrics. The company raised €10 million in June 2025, signaling continued growth.
Where it falls short: No automated code review. Limited AI coding impact measurement. Limited customization for complex enterprise needs. G2 and Reddit discussions consistently cite feature depth as the primary gap compared to more comprehensive platforms.
Best for: Teams starting their metrics journey who want clean dashboards and team-first norms without enterprise complexity.
DX (formerly GetDX) is an engineering intelligence platform founded by the researchers who created the DORA, SPACE, and DevEx frameworks. It combines structured developer surveys with system metrics through its Data Cloud product to measure developer experience, productivity friction, and organizational health, while also measuring developer productivity and individual performance metrics. DX incorporates developer feedback as a qualitative element, ensuring that both quantitative data and direct input from developers are used to identify issues and suggest improvements.
Where DX stands out: Deep research pedigree. The DX Core 4 framework is becoming a standard reference in the DevEx space. No other tool has the same academic backing for its measurement methodology. DX leverages the SPACE framework (Satisfaction, Performance, Activity, Communication, Efficiency) to provide a holistic view of developer experience and productivity.
Where it falls short: DX is primarily a survey and sentiment platform. It incorporates self reported metrics from developers, which complements system-generated data, but does not include automated code review, native AI coding impact measurement, or deep SDLC analytics. If you need to see how work moves through your pipeline, diagnose PR bottlenecks, or track AI tool impact on cycle time, DX will not cover those use cases alone.
Best for: Organizations investing heavily in developer experience improvement and platform engineering who want the most rigorous DevEx measurement methodology available.
Haystack is a lightweight engineering analytics platform focused on DORA metrics, delivery visibility, and team health. It targets teams that want engineering metrics without the complexity of enterprise platforms, while providing real time data and real time visibility for distributed teams and software teams.
Where Haystack stands out: Quick setup, transparent pricing, and a focused feature set that does not overwhelm smaller teams. For engineering managers overseeing 5–50 developers who need basic delivery visibility, Haystack provides fast time-to-value.
Where it falls short: No AI coding impact measurement. No automated code review. No DevEx surveys. As teams scale past 50–100 engineers or need to measure AI tool ROI, Haystack’s feature set may not keep pace.
Best for: Small-to-mid engineering teams (under 50 developers) who want straightforward delivery metrics without enterprise complexity or pricing.
Waydev is an engineering intelligence platform that uses DORA metrics, the SPACE framework, developer experience insights, and AI capabilities to provide delivery analytics. It automatically tracks work from Git activity, visualizes project timelines, and includes basic code review workflow features, while also offering detailed analytics on pull requests and the entire development lifecycle.
Where Waydev stands out: Automated work logs from Git activity eliminate manual entry. Project timeline visualization gives clear progress views. Sprint planning integration supports agile workflows. Waydev also supports the software delivery process by providing engineering insights that help teams optimize performance and identify bottlenecks.
Where it falls short: AI coding impact measurement is limited. Code review capabilities are basic compared to dedicated AI code review tools. DevEx survey depth does not match platforms like DX or Typo.
Best for: Teams that want Git-level activity analytics with automated work tracking and sprint planning support.
Pluralsight Flow (formerly GitPrime) tracks coding activity: commits, lines of code, code churn, and review patterns. It was acquired by Appfire from Pluralsight in February 2025 and now operates as a standalone product within the Appfire ecosystem alongside BigPicture PPM and 7pace Timetracker. Flow also enables tracking of individual performance and individual performance metrics, providing visibility into productivity metrics and key metrics for both teams and developers—similar to platforms like Code Climate Velocity.
Where Flow stands out: Mature Git activity analytics with ML-powered insights. The Appfire ecosystem positions it alongside project management tools. For organizations already invested in Pluralsight for developer training, Flow provides natural synergy.
Where it falls short: No AI coding impact measurement. No automated code review. No DevEx surveys. No manager productivity agents. The platform focuses on Git-level patterns rather than full SDLC visibility, and it does not cover sprint analytics, deployment metrics, or incident tracking.
Best for: Large organizations that want mature Git analytics and are already invested in the Appfire or Pluralsight ecosystem.
The right platform depends on what gap Jellyfish is not filling for your team. Here is a framework for making the decision. For engineering organizations, leveraging data-driven approaches and data-driven insights is essential—these enable leaders to make informed decisions, optimize workflows, and align engineering efforts with strategic goals.
If your primary need is measuring AI coding tool impact: Typo is the strongest option for improving developer productivity with AI intelligence. It natively tracks GitHub Copilot, Cursor, Claude Code, and CodeWhisperer, and compares AI-assisted versus non-AI PR outcomes on cycle time, quality, and developer experience. Jellyfish added AI Impact tracking recently, but Typo’s approach measures verified impact, not just adoption.
If you need automated code review bundled with analytics: Typo is the only platform on this list that includes a context-aware AI code review agent alongside SDLC analytics, AI impact measurement, and DevEx surveys. Every other alternative requires a separate code review tool. Typo also supports engineering productivity and team efficiency by surfacing actionable metrics and workflow bottlenecks.
If your primary need is developer experience measurement: DX offers the deepest research-backed methodology. Typo offers DevEx surveys combined with delivery analytics and AI impact in one platform. The tradeoff is depth of DevEx research (DX) versus breadth of the platform (Typo).
If budget is your primary constraint: LinearB’s free tier or Swarmia’s transparent pricing provide accessible starting points. Typo also offers flexible plans and a self-serve free trial with no sales call required.
If you need enterprise finance alignment: Jellyfish may still be the right choice. Its investment allocation, R&D capitalization, and DevFinOps features are designed for CFO-level conversations. Jellyfish stands out for tracking engineering investments and aligning them with business outcomes. No alternative on this list matches Jellyfish’s depth in financial engineering reporting.
The 2025 DORA Report found that 90% of developers now use AI coding tools. But the report also found that AI amplifies existing practices rather than fixing broken ones. Teams with poor DORA baselines do not improve with AI. They accelerate their dysfunction.
This creates a measurement problem. Most organizations track AI tool adoption through license counts. They know how many seats are active. They do not know whether those tools are actually improving delivery speed, code quality, or developer experience. Tracking engineering effort and resource allocation is essential for understanding the true impact of AI tools, as it reveals how team resources are distributed and whether productivity gains are realized.
That gap is why AI coding impact measurement has become the defining capability in the engineering intelligence category. It is not enough to know that 80% of your team uses Copilot. You need to know whether AI-assisted PRs merge faster, introduce more rework, or create code quality issues that show up downstream—while also optimizing the development process and engineering processes for improved developer productivity and addressing technical debt.
Platforms that can answer that question, with verified data from your actual engineering workflow, are the ones worth evaluating.
Jellyfish built a strong foundation in the engineering management space. For enterprise teams that need deep investment allocation, R&D capitalization, and finance alignment, it remains a capable option.
But the category has evolved. AI coding tools have changed what engineering leaders need to measure. Developer experience has become a board-level priority. The importance of software delivery, team collaboration, and operational efficiency has grown as organizations seek platforms that optimize the entire development lifecycle. And the bar for setup speed and pricing transparency has risen.
If you are looking for a platform that covers SDLC visibility, AI coding impact measurement, automated code reviews, and developer experience in a single product, with a setup that takes 60 seconds instead of 60 days, Typo is worth evaluating.
What is Jellyfish used for?
Jellyfish is an engineering management platform that aligns engineering work with business objectives. It provides visibility into investment allocation, resource planning, R&D capitalization, and delivery metrics. It integrates with Jira, GitHub, GitLab, and other development tools.
How much does Jellyfish cost?
Jellyfish does not publish pricing publicly. Based on Vendr’s 2026 market data, annual contracts for 50–150 engineering seats typically range from $50,000 to $120,000, depending on modules, integrations, and contract terms.
What are the main limitations of Jellyfish?
Common friction points reported by users include: steep learning curve and complex initial setup, heavy dependency on Jira data quality, no automated AI code review capability, limited custom reporting flexibility, lack of customizable dashboards, limited tracking of quality metrics, and opaque pricing that requires a sales conversation.
Does Jellyfish measure AI coding tool impact?
Jellyfish added AI Impact tracking in late 2024, which measures AI tool adoption and usage across coding assistants like GitHub Copilot and Cursor. However, other engineering analytics tools provide more granular analysis of pull requests and quality metrics, enabling deeper AI-vs-non-AI PR comparison at the delivery impact level. Platforms like Typo provide more granular measurement.
What is the best Jellyfish alternative for mid-market teams?
For mid-market engineering teams (50–500 engineers) that need unified SDLC visibility, AI coding impact measurement, automated code review, and DevEx surveys in a single platform, Typo offers the most comprehensive coverage with the fastest setup (60 seconds) and self-serve pricing.

AI impact on DORA metrics reveals a striking productivity paradox: individual developers merged 98% more pull requests while organizational software delivery performance remained essentially flat. The 2025 DORA Report—retitled “State of AI-assisted Software Development”—surveyed nearly 5,000 technology professionals and uncovered that AI tools amplify existing team capabilities rather than universally improving delivery metrics.
This article covers the 2025 DORA Report findings, the seven team archetypes that replaced traditional performance tiers, and practical measurement strategies for engineering leaders navigating AI adoption. The target audience includes VPs and Directors of Engineering responsible for measuring AI tool ROI, deployment frequency improvements, and overall engineering performance. Understanding why AI benefits vary so dramatically across teams has become essential for any organization investing in AI coding assistants.
Direct answer: AI acts as an amplifier that magnifies whatever work practices, cultural health, and platform maturity already exist in an organization. Strong teams see gains; teams with foundational challenges see their dysfunction worsen. This means engineering leaders must fix DORA metric baselines before expecting AI investment to deliver meaningful improvement.
By the end of this article, you will understand:
The 2025 DORA Report introduced a critical framing: AI acts as an “amplifier” or “multiplier” rather than a universal productivity booster. According to DevOps research conducted by Google Cloud, organizations with strong engineering systems, healthy data ecosystems, and mature internal platforms see positive gains from AI adoption. Organizations with weak foundations see those weaknesses magnified—higher change failure rate, more production failures, and increased rework.
AI adoption among software professionals surged to approximately 90% in 2025, up from roughly 75% the previous year. Most professionals now use AI tools daily, with median usage around two hours per day. Over 80% report improved individual productivity, and roughly 59% report improved code quality. Yet these perception-based gains don’t translate uniformly to organizational performance—the core insight that defines the AI era for engineering teams.
The DORA framework historically tracked four core metrics—Change Lead Time, Deployment Frequency, Change Failure Rate, and Mean Time to Recovery—as the foundation for measuring software delivery performance. These four metrics were used to categorize teams into different performance levels and benchmark improvement areas. In 2024, the DORA framework evolved to include five metrics, adding Deployment Rework Rate and removing the elite/high/medium/low performance tiers that defined earlier reports.
Throughput metrics now include:
Instability metrics include:
The addition of Rework Rate acknowledges that failures aren’t always outright rollbacks. Many disruptions are remediated via additional fixes, and tracking this provides a more complete picture of delivery stability. New metrics added to the DORA framework include Deployment Rework Rate and measures of AI Code Share, Code Durability, and Complexity-Adjusted Throughput.
Deployment Rework Rate measures the frequency of unplanned deployments required due to production issues.
AI Code Share tracks the proportion of code generated by AI tools.
Code Durability assesses how long code survives without major rework.
Complexity-Adjusted Throughput accounts for the complexity of changes when measuring delivery speed.
This evolution directly addresses AI-era challenges where AI-generated code may increase deployment volume while simultaneously creating quality assurance burdens downstream. Lead Time for Changes can drop initially as AI accelerates code writing, but bottlenecks may shift to code review, increasing the review time significantly. Tracking code that survives without major rework over time is also important for understanding long-term stability.
Research shows that platform engineering stands out as the primary enabler of successful AI adoption. Approximately 90% of organizations have adopted at least one internal developer platform, and 76% have dedicated platform teams. High-quality internal platforms correlate strongly with AI amplification benefits—teams can move faster because CI/CD pipelines, monitoring, version control practices, and developer experience infrastructure absorb the increased code velocity AI enables, especially when they already understand the importance of DORA metrics for boosting tech team performance.
Without strong platforms, AI tools’ output creates chaos. More committed code flowing through immature pipelines leads to bottlenecks in code review, longer queues, and ultimately more deployments fail. The DORA AI capabilities model emphasizes that platform prerequisites must exist before AI adoption can translate individual developer productivity into organizational outcomes.
This connection between foundational capabilities and the productivity paradox explains why some high performing teams thrive with AI while others struggle.
The productivity paradox represents the most significant finding from 2025: individual developers produce dramatically more output, but engineering teams don’t see proportional improvements in delivery speed or business outcomes. Faros AI, analyzing telemetry from over 10,000 developers, quantified this gap with precision that survey data alone cannot provide, which underscores both the strengths and pros and cons of DORA metrics for continuous delivery.
At the individual level, AI assisted coding delivers measurable improvements:
Individual developers report that AI coding assistants help them code faster, produce better documentation, and move through routine tasks with less friction. These gains are real and substantial. The challenge is that individual productivity improvements don’t automatically flow through to organizational performance.
Despite the surge in individual output, Faros AI’s telemetry revealed that organizational delivery metrics—deployment frequency, lead time, and the ability to quickly restore service after incidents (recovery speed)—showed no noticeable improvement. The traditional DORA metrics remained essentially flat across their sample.
Worse, several quality and efficiency signals degraded:
This data reveals where AI benefits evaporate: somewhere between individual contribution and organizational delivery, bottlenecks absorb the productivity gains. The complete picture shows AI helps individual developers produce more, but without corresponding improvements in review processes, pipeline efficiency, and quality assurance, that output creates downstream burden rather than business outcomes and often surfaces as classic signs of declining DORA metrics.
The DORA AI capabilities model identifies seven foundational practices that determine whether AI adoption succeeds or fails at the organizational level:
Teams that score well on these seven capabilities convert AI adoption into real performance benefits. Teams lacking these foundations experience the amplifier effect negatively—AI magnifies their dysfunction rather than solving it.
The 2025 DORA Report replaced the traditional linear performance tiers (Elite, High, Medium, Low) with seven team archetypes. This shift reflects a more nuanced understanding that team performance is multidimensional—throughput matters, but so does instability, team health, valuable work time, friction, and burnout, which aligns with newer DORA metrics guides for engineering leaders that emphasize a broader view of performance.
The seven archetypes are built from multiple dimensions, which still rely on mastering core DORA metrics implementation:
Gene Kim and the DORA researchers developed this framework because teams with identical DORA metrics might have vastly different experiences and outcomes. A team deploying frequently with low failure rate but high burnout requires different interventions than one with the same metrics but healthy team dynamics.
Prioritize establishing basic CI/CD pipelines, test coverage, build quality, and simple rollback mechanisms. AI adoption before these foundations exist will amplify chaos.
Address technical debt, modularize monolithic systems, and create internal platforms to standardize processes. AI tools can help with code modernization, but platform investment must come first.
Identify process friction—reviews, decision bottlenecks, approval chains—and streamline or automate them. Adding AI-generated code to a team already drowning in review backlog makes things worse.
Guard against quality degradation by monitoring instability metrics closely. Success creates risk: as throughput increases, maintaining code quality and architecture discipline becomes harder.
Challenge: HR hierarchies define teams administratively, but actual collaboration patterns don’t match org charts. AI tool adoption may be high in one administrative group while the engineers actually working together span multiple groups.
Solution: Combine HR hierarchies with telemetry data to measure actual collaboration patterns. Track who reviews whose code, who co-authors changes, and where knowledge flows. This provides a more accurate picture of where AI adoption is actually impacting delivery.
Challenge: Developers move between teams, change roles, and contribute to multiple repositories. Attributing AI impact to specific teams or projects becomes unreliable.
Solution: Track AI-influenced code contributions across team boundaries with proper tooling. Engineering intelligence platforms like Typo can measure AI-influenced PR outcomes with verified data rather than relying on license adoption estimates or self-reported usage, which is critical when implementing DORA DevOps metrics in large organizations.
Challenge: Traditional DORA metrics don’t distinguish between AI generated code and human-written code. You can’t assess whether AI is helping or hurting without this visibility.
Solution: Layer AI adoption rate, acceptance rates, and quality impact on traditional DORA metrics. Track:
Challenge: AI productivity gains evaporate somewhere in the delivery pipeline, but without end-to-end visibility, you can’t identify where.
Solution: Implement Value Stream Management to track flow from ideation through commit, review, QA, deploy, and post-release monitoring. This stream management approach reveals where time or defects accumulate—often in review queues or integration testing phases that become bottlenecks when AI dramatically increases deployment frequency upstream, and it depends on accurately measuring DORA metrics across the pipeline.
The 2025 DORA Report confirms that AI amplifies existing team patterns rather than uniformly improving software delivery performance. Teams with strong DORA baselines, mature platforms, and healthy engineering cultures see AI benefits compound. Teams with foundational challenges see AI worsen their dysfunction. The productivity paradox—individual gains that don’t translate to organizational outcomes—will persist until engineering leaders address the bottlenecks between developer output and business value delivery.
Immediate actions for engineering leaders:
The window for action is approximately 12 months. Organizations that successfully integrate AI with strong DORA foundations will achieve meaningful improvement in delivery speed and quality. Those that add AI to broken systems will see competitive disadvantages compound as their instability metrics worsen while competitors pull ahead.
Related topics worth exploring: Value Stream Management for end-to-end visibility, DevEx measurement for understanding developer friction, and AI ROI frameworks that connect tool investment to business outcomes.
The 2025 DORA Report found that approximately 90% of developers now use AI tools, with over 80% reporting productivity gains at the individual level. The central finding is that AI acts as an amplifier—magnifying organizational strengths and weaknesses rather than uniformly improving performance.
The report introduced seven critical capabilities that determine whether AI benefits scale to organizational performance: governance clarity, healthy data ecosystems, AI-accessible internal data, strong version control practices, small-batch workflows, user-centric focus, and quality internal platforms.
Notably, DORA researchers found no correlation between AI adoption and increased developer burnout, possibly because developers feel more productive even when downstream organizational stress increases.
AI improves individual developer metrics but creates organizational delivery challenges. Teams with strong DORA baselines see amplified benefits; weak teams see amplified dysfunction.
Quality and stability signals often worsen despite throughput improvements. Faros AI telemetry showed bug rates increased approximately 9% and code review time increased 91% as AI-generated code volume overwhelmed review capacity.
Platform engineering maturity determines AI success more than tool adoption rates. Organizations with strong CI/CD pipelines, monitoring, and internal platforms convert AI productivity into delivery improvements. Organizations lacking these foundations see AI create more chaos.
Deployment frequency increases due to AI-generated code volume, but this may not reflect meaningful output. More deployments don’t automatically translate to faster value delivery if those deployments require rework or cause production incidents.
Lead time for changes reduces for individual contributions, but review bottlenecks increase as reviewers struggle to keep pace with higher code volume. The 91% increase in review time documented by Faros AI shows where individual lead time gains get absorbed.
Engineering leaders need to measure complexity-adjusted throughput rather than raw deployment counts. Failed deployment recovery time becomes a more critical metric than traditional MTTR because it captures the full cost of instability.
The seven team archetypes are: Harmonious High-Achievers, Pragmatic Performers, Stable and Methodical, Constrained by Process, Legacy Bottleneck, High Impact Low Cadence, and Foundational Challenges.
Each archetype requires different AI adoption strategies and measurement approaches. Multidimensional classification considers throughput, stability, team well-being, friction, and time spent on valuable work—not just the four traditional DORA metrics.
One-size-fits-all AI strategies fail because a Legacy Bottleneck team needs platform investment before AI adoption, while Constrained by Process teams need to streamline workflows first. Harmonious High-Achievers can adopt AI aggressively but must monitor quality degradation.
Engineering leaders should combine traditional DORA metrics with AI adoption rates and code quality indicators. This means tracking not just deployment frequency and lead time, but also AI-influenced PR outcomes, PR size trends, review time changes, and rework rate.
Track AI-influenced PR outcomes with verified data rather than license adoption estimates. Engineering intelligence platforms like Typo provide visibility into actual AI usage patterns and their correlation with delivery and quality outcomes, complementing high-level resources that keep DORA metrics explained with practical insights.
Implement Value Stream Management to identify where AI gains evaporate in the delivery pipeline. Often, review queues, integration testing, or deployment approval processes become bottlenecks that absorb individual productivity improvements before they translate to business outcomes.
Use engineering intelligence platforms to correlate AI usage with delivery metrics, quality signals, and developer experience indicators. This comprehensive measurement approach provides actionable insights that surface problems before they compound.
GitHub Copilot, Cursor, and Claude Code represent the three dominant paradigms in AI coding tools for 2026, each addressing fundamentally different engineering workflow needs. With 85% of developers now using AI tools regularly and engineering leaders actively comparing options in ChatGPT and Claude conversations, choosing the right ai coding assistant has become a strategic decision with measurable impact on delivery speed and code quality.
This guide covers performance benchmarks, pricing analysis, enterprise readiness, and measurable productivity impact specifically for engineering teams of 20-500 developers. It falls outside our scope to address hobbyist use cases or tools beyond these three leaders. The target audience is engineering managers, VPs of Engineering, and technical leads who need data-driven comparisons rather than developer preference debates.
The direct answer: GitHub Copilot excels at IDE integration and enterprise governance with 20M+ users and Fortune 100 adoption. Cursor leads in flow state maintenance and multi file editing for small-to-medium tasks. Claude Code dominates complex reasoning and architecture changes with its 1M token context window and 80.8% SWE-bench score.
By the end of this comparison, you will:
While these three tools boost individual productivity, measuring their actual impact on delivery speed and code quality requires dedicated engineering intelligence platforms that track AI-influenced outcomes across your entire codebase.
The 2026 landscape of ai coding tools has crystallized into three distinct approaches: IDE-integrated completion tools that augment familiar interfaces, AI-native editing environments that reimagine the development workflow entirely, and terminal-based autonomous agents that execute complex tasks independently. Understanding these categories is essential because each addresses different engineering bottlenecks.
IDE-integrated tools like GitHub Copilot work within your existing development environment. GitHub Copilot is an extension that works across multiple IDEs, providing the only tool among the three that supports a wide range of editors without requiring a switch. Developers keep their familiar interface, existing extensions, and muscle memory while gaining inline suggestions and chat capabilities. This approach minimizes change management friction and enables gradual adoption across teams using VS Code, JetBrains, or Neovim.
Standalone solutions like Cursor require switching development environments entirely. Cursor is a standalone IDE built as a VS Code fork with AI integrated into every workflow, making it a complete editor redesigned around AI-assisted development. As a vs code fork, Cursor maintains familiarity but demands that teams switch editors and migrate configurations. This tradeoff delivers deeper AI integration at the cost of adoption friction. Enterprise teams often find IDE-integrated approaches easier to roll out, while power users willing to embrace change may prefer the cohesion of AI-native environments.
Code completion tools focus on high-frequency, low-friction suggestions. You write code, and the ai generated code appears inline, accepted with a single keystroke. This approach optimizes for flow state and immediate productivity on the current file.
Autonomous coding through agent mode takes a fundamentally different approach. You describe a task in natural language descriptions, and the terminal agent executes multi step tasks across multiple files, potentially generating entire features or refactoring existing codebases. Claude Code is a terminal-based AI coding agent that autonomously writes, refactors, debugs, and deploys code, providing a unique approach compared to IDE-integrated tools. Claude Code leads this category, achieving higher solve rates on complex problems but requiring developers to adapt to conversational coding workflows.
The choice between approaches depends on your primary bottleneck. If developers spend most time on incremental coding, autocomplete delivers immediate time saved. If architectural changes, debugging intermittent issues, or navigating very large codebases consume significant cycles, autonomous agents provide greater leverage.
Building on these foundational distinctions, each tool demonstrates specific capabilities and measurable impact that matter for engineering teams evaluating options.
GitHub Copilot serves over 20 million developers and has become the Fortune 100 standard for ai assisted development. Its deep integration with the github ecosystem provides seamless workflow integration from code completion through pull request review.
Core strengths: Cross-IDE support spans visual studio, VS Code, JetBrains, Neovim, and CLI tools. Enterprise compliance features include SOC 2 certification, IP indemnification, and organizational policy controls. The Business tier ($19/user/month) provides admin controls and 300 premium requests monthly; Enterprise ($39/user/month) adds repository indexing, custom fine-tuned models (beta), and 1,000 premium requests.
Measurable impact: Best for enterprise teams needing consistent autocomplete across diverse development environments. Studies show inline suggestion acceptance rates of 35-40% without further editing. Agent mode and code review features enable multi file changes, though not as autonomously as Claude Code.
Key limitations: The context window presents the most significant constraint. While GPT-5.4 theoretically supports ~400,000 tokens, users report practical limits around 128-200K tokens with early summarization. For complex tasks spanning multiple files or requiring deep understanding of existing codebase, this limitation affects output quality.
Cursor positions itself as the ai coding tool for developers who want AI woven into every aspect of their workflow. Cursor is a standalone IDE built as a VS Code fork with AI integrated into every workflow, making it a complete editor redesigned around AI-assisted development. As a standalone ide based on a code fork of VS Code, it attracts over 1 million users seeking deeper integration than plugin-based approaches.
Core strengths: Composer mode enables multi file editing with context awareness across your entire project. Background cloud agents handle complex refactoring while you work on other tasks. Supermaven autocomplete achieves approximately 72% acceptance rates in benchmarks, significantly higher than alternatives for simple completions.
Measurable impact: Cursor completes SWE-bench tasks approximately 30% faster than Copilot for small-to-medium complexity work. First-pass correctness reaches ~73% overall, with ~42-45% of inline suggestions accepted without further editing. The tool excels at maintaining flow state, staying out of the way until needed.
Key limitations: Requires teams to switch editors, creating adoption friction. Token-based pricing through cursor pro can become unpredictable for heavy usage limits. On hard tasks, correctness drops to ~54% compared to Claude Code’s ~68%. The underlying model determines actual capabilities, making performance variable depending on configuration.
Claude Code operates as a terminal agent optimized for autonomous coding on complex tasks. Claude Code is a terminal-based AI coding agent that autonomously writes, refactors, debugs, and deploys code, providing a unique approach compared to IDE-integrated tools. Its 200K standard context window (up to 1M in enterprise/beta tiers) enables reasoning across entire codebases that would overwhelm other tools.
Core strengths: The largest context window available enables architectural changes, legacy system navigation, and debugging intermittent issues that require understanding thousands of files simultaneously. Agent teams enable parallel workflows. The 80.8% SWE-bench Verified score demonstrates superior performance on complex problems. VS Code and JetBrains extensions add claude code to existing workflows for those who prefer IDE integration.
Measurable impact: Claude code leads on first-pass correctness at ~78% overall, reaching ~68% on hard tasks versus Cursor’s ~54%. Pull request acceptance rates show 92.3% for documentation tasks and 72.6% for new features. Complex refactoring executes approximately 18% faster than Cursor.
Key limitations: Terminal-only primary interface requires learning curve for developers accustomed to IDE-centric workflows. Usage based pricing for extended context can become expensive for teams regularly using 1M-token sessions. Performance degrades around 147-150K tokens before auto-compaction triggers, requiring prompt engineering to manage context effectively.
Interpreting benchmark data requires understanding that synthetic benchmarks don’t directly translate to productivity gains in your specific codebase and workflow patterns.
SWE-bench Verified measures complex correctness on real-world code tasks. Claude Code (Opus 4.5) achieves ~80.9%, Cursor ~48%, and Copilot ~55% in comparable benchmark sets. These differences become more pronounced on hard tasks requiring multi step problems across multiple files.
HumanEval and MBPP test function-level code generation. Claude Opus 4.6 reaches ~65.4% on Terminal-Bench 2.0; Cursor’s newer Composer variants achieve ~61-62%. These benchmarks better predict inline suggestion quality than autonomous task completion.
Real-world accuracy patterns:
Interpretation guidance: Benchmark scores indicate ceiling performance under controlled conditions. Actual productivity impact depends on task distribution, codebase characteristics, and how well the tool matches your workflow patterns.
Synthesis:
Direct licensing costs:
Team cost scenarios:
Hidden costs matter:
Teams using cli tools extensively may find Claude Code’s terminal agent more accessible option despite the learning curve.
Developer resistance challenge: Teams using VS Code or JetBrains resist switching to Cursor’s standalone ide, even though it’s a vs code fork with a familiar interface. Exporting configurations, adjusting plugin sets, and changing muscle memory creates friction that individual developers often avoid.
Solution:
Code privacy challenge: All three tools process code through external ai models, raising IP protection concerns. Different tools offer different guarantees about data retention and model training.
Solution:
The brutal truth: These tools report adoption metrics—suggestions accepted, completions generated, features used—but none tell you their actual impact on your DORA metrics. License adoption doesn’t equal delivery speed improvement.
Solution:
Specific measurement approaches (pros and cons of relying on DORA alone):
Tool choice depends on team size, existing IDE preferences, and the complexity distribution of your codebase work. GitHub copilot vs cursor vs claude code isn’t a simple “best tool” question—it’s a workflow fit question requiring measurement to answer definitively.
The game changer isn’t choosing the right answer among these other tools—it’s implementing measurement infrastructure to track actual engineering impact rather than license deployment counts. Without that measurement, you’re guessing at ROI rather than proving it.
Related topics worth exploring: AI-assisted coding impact and best practices, engineering intelligence platforms for DORA metrics tracking, AI code review automation, and hybrid tool strategies for different tasks across your organization.
Which AI coding tool has the best ROI for engineering teams?
ROI depends on three factors: team size, codebase complexity, and measurement infrastructure. For enterprise teams prioritizing governance and minimal disruption, GitHub Copilot typically delivers fastest time-to-value. For teams doing heavy refactoring, Cursor’s multi-file capabilities justify the IDE migration cost. For complex architectures or legacy systems, Claude Code’s context window provides unique capabilities. Without measuring actual DORA metric impact, ROI claims remain speculative.
Can you use multiple AI coding tools together effectively?
Yes, hybrid approaches are increasingly common. Many teams use GitHub Copilot for daily inline suggestions, Cursor for complex refactoring sessions, and add claude code for architectural analysis or debugging multi step problems. The key is matching each tool to specific task types rather than forcing single-tool standardization, drawing on broader AI coding assistant evaluations and developer productivity tooling strategies.
How do you measure if AI coding tools are actually improving delivery speed?
Focus on DORA metrics: deployment frequency, lead time for changes, change failure rate, and mean time to recovery. Track these metrics before AI tool adoption, then measure changes over 30-90 day periods. Compare PR cycle times for AI-influenced commits versus non-AI commits. Engineering intelligence platforms like Typo provide this measurement across all three tools, and resources such as a downloadable DORA metrics guide can help structure your approach.
Which tool is best for teams using legacy codebases?
Claude Code’s 1M token context window makes it uniquely capable of reasoning across very large codebases without losing context. It can analyze entire codebases that would exceed other tools’ limits. For legacy systems requiring understanding of interconnected components across hundreds of files, this context advantage is significant.
What’s the difference between AI code completion and autonomous coding?
Code completion provides inline suggestions as you write code—high frequency, immediate, minimal disruption. Autonomous coding executes entire tasks from plain language descriptions, making multi file changes, generating api endpoints, or refactoring components. Completion optimizes flow state for solo developer work; autonomous agents leverage AI for complex tasks that would otherwise require hours of manual effort.
How do enterprise security requirements affect tool choice?
GitHub Copilot Enterprise offers the most comprehensive compliance features: SOC 2 certification, IP indemnification, organizational policy controls, and explicit guarantees about code not being used for model training. Cursor’s enterprise features are less publicly documented. Claude Enterprise offers compliance plans but terminal-based workflows may require additional security review. Response cancel respond policies and data retention terms vary by tier—evaluate enterprise agreements carefully.
PR cycle time measures the duration from pull request creation to merge into the main branch—and it’s the most actionable metric engineering leaders can move quickly. Code review cycle time, specifically, is the period from when a pull request is submitted until it is merged, serving as a critical indicator of development velocity and team collaboration efficiency. Elite teams achieve total cycle times under 24 hours, while median performers take 2-5 days. That gap represents days of delayed features, slower feedback loops, and compounding context switching costs across your entire development pipeline. High code review cycle times often indicate communication gaps, unclear requirements, or overburdened reviewers, while consistently low cycle times suggest efficient collaboration and well-defined review processes.
This guide covers how to measure PR cycle time components, break down the different phases of the cycle, interpret benchmarks for your team size, diagnose root causes of delays, and implement proven reduction strategies. As an essential part of DORA metrics for engineering performance, understanding PR cycle time is crucial for evaluating engineering team performance and efficiency and for appreciating why PR cycle time is often a better metric than velocity. The target audience is engineering managers, VPs of Engineering, and team leads managing 5-50 developers who want to accelerate their software development process without sacrificing code quality.
The short answer: Reduce PR cycle time through smaller PRs (< 200 lines), automated triage and reviewer assignment, clear code ownership, and AI-powered pre-screening that catches issues before human reviewers engage. Keeping pull requests small and manageable is key—research shows that PRs with over 200 changes often deter reviewers, while smaller PRs lead to quicker, more effective code reviews.
By the end of this guide, you will:
PR cycle time, often referred to as code review cycle time, is the total elapsed time from when a pull request is opened until it successfully merges into the main branch. This key metric measures the duration of the code review process and is central to DORA’s Lead Time for Changes—one of the four key metrics that distinguish elite engineering organizations from average performers. Understanding cycle time vs lead time within DORA metrics clarifies how PR cycle time fits into broader delivery performance. Code review cycle time can be broken down into different phases, such as initial development, waiting time, and review, to pinpoint where delays occur and optimize each segment for efficiency.
Understanding cycle time requires breaking it into these distinct phases, because the interventions for each are different. Tracking other pull request metrics—like PR Pickup Time and PR size—alongside PR review time and overall cycle time helps teams identify bottlenecks and target improvements more effectively. A team with high PR pickup time needs different solutions than one with slow merge times. High cycle time is often a sign of inefficiency and can indicate hidden problems within the workflow. Shorter PR cycle times usually indicate smoother workflows, while longer cycle times often signal hidden problems such as unclear ownership or overloaded reviewers.
PR pickup time measures the duration from PR creation until the first reviewer begins reviewing. This is the waiting period where new code sits idle, and it typically dominates overall cycle time.
In an analysis of 117,413 reviewed pull requests, median pickup time was approximately 0.6 hours—but the P90 (slowest 10%) reached 128.9 hours. That’s over five days of waiting before anyone even looks at the code change.
High PR pickup time correlates directly with reviewer availability, team awareness of pending reviews, and lack of automated assignment. When it’s unclear who should review a PR, developers passively wait for someone else to pick it up. Ensuring the team is promptly notified when a PR exists is essential to avoid unnecessary delays and keep the workflow moving.
Managing review requests and making sure PRs are reviewed in a timely manner is crucial for reducing pickup time. Dashboards that track pending review requests and highlight bottlenecks can help teams respond faster and improve overall PR cycle time.
Review time covers the active period from first review through final approval. This includes reading code, providing feedback, waiting for author responses, and iterating through review rounds. Code reviews are an essential process for maintaining code quality and delivery speed, but complex PRs can significantly increase review time due to the additional effort required to understand and assess them.
Key factors affecting review duration include pull request size, code complexity, and reviewer experience with the codebase. Large pull requests take exponentially longer—not just because there’s more code, but because reviewers defer them, requiring more context switching when they finally engage. Common causes of long PR cycle times include large pull requests, unclear ownership, and overloaded reviewers, which can create bottlenecks in the review process.
The tradeoff between review depth and speed is real. Teams must decide how much scrutiny different types of changes warrant. A one-line configuration fix shouldn’t require the same review process as complex changes to core business logic.
Merge time is the interval from final approval to actual merge into the main branch. This phase is often overlooked, but in the same GitHub dataset, P90 merge delay reached 19.6 hours.
Technical factors driving merge time include CI/CD pipeline duration, merge conflicts with other branches, required compliance checks, and branch policies that restrict merge windows. Teams with long-running test suites or manual deployment gates see this phase balloon.
Understanding each component matters because you can’t fix what you don’t measure. A team might assume review quality is the problem when actually their developers are waiting days for the first comment. The next section establishes benchmarks so you can identify where your team falls.
Industry benchmarks provide context for your team’s performance, but they require interpretation based on your specific situation. Metrics like code review cycle time and other pull request metrics—such as PR Pickup Time, overall cycle time, and PR size—are important benchmarks for assessing team performance and identifying bottlenecks in your workflow, especially when you follow the dos and don'ts of using DORA metrics effectively. A 24-hour cycle time means something different for a 5-person startup versus a 50-person team in regulated fintech. Frequent measurement of key performance indicators (KPIs) helps teams understand which strategies are effective in reducing PR cycle time and optimizing development velocity.
Based on aggregated data from DORA reports, Typo and CodePulse research, code review cycle time benchmarks break down as follows:
For teams of 5-50 engineers specifically: elite performers achieve under 12-24 hours total code review cycle time, with first review happening within four hours during business hours.
The median reviewed PR on public GitHub takes approximately 3 hours total—but P90 reaches 149 hours. That spread indicates most PRs move quickly, but a significant tail of delayed reviews drags down team velocity.
Effective measurement requires tracking each phase separately rather than just total duration. Breaking down the process into different phases enables more targeted improvements:
Tracking other pull request metrics such as PR Pickup Time and PR size alongside these phases provides additional insight into where delays or inefficiencies occur in the pull request process.
Consider business hours versus calendar time. An 18-hour cycle time that spans overnight isn’t the same as 18 hours during working hours. Some tools normalize for this; others require manual interpretation.
Typo surfaces real-time PR analytics that break down these components automatically, helping engineering leaders identify bottlenecks without manual data collection. The platform tracks cycle time trends across teams and repos, flagging when metrics drift outside acceptable ranges and making it easier to track and improve DORA metrics across your SDLC.
Benchmarks shift based on team composition and business context:
Small teams (5-10 engineers): Expect shorter cycle times due to higher code familiarity and simpler coordination. Target <4 hours for elite performance.
Medium teams (10-50 engineers): Coordination overhead increases. Target <24 hours for strong performance. Cross-team reviews and code ownership complexity require explicit processes.
Regulated industries: Compliance requirements, security reviews, and audit trails legitimately extend cycle time. Focus on reducing variance and eliminating unnecessary delays rather than hitting startup-speed benchmarks.
High-risk code changes: Critical paths warrant thorough review despite longer cycle times. The goal isn’t uniform speed—it’s appropriate speed for each type of change.
With benchmarks established, the next section covers specific interventions proven to reduce cycle time.
These strategies come from teams that have achieved measurable improvements—not theoretical best practices. Setting WIP limits and actively managing review PRs are proven methods to reduce PR cycle time, as they help prevent bottlenecks and maintain a steady workflow. Each intervention addresses specific phases of the PR cycle and includes implementation guidance. Effective PR teams can save up to 40% of their time by streamlining processes and eliminating bottlenecks through structured workflows.
Pull request size is the single strongest predictor of cycle time. Typo data shows small PRs get picked up 20× faster than large ones. The relationship is exponential, not linear. Complex PRs—those with many files changed or large code diffs—tend to slow down reviews, increase the risk of bugs, and create bottlenecks for both authors and reviewers.
Implementation steps:
For example, a team working on a major refactor initially submitted a single complex PR with over 1,000 lines changed. Reviewers hesitated to pick it up, and the PR sat idle for days. After splitting the work into five smaller PRs, each focused on a specific module, reviews were completed within hours, and feedback was more actionable.
Smaller PRs benefit everyone: authors get faster feedback, reviewers maintain focus without context switching overload, and the team catches issues earlier in the development process. Keeping pull requests small and manageable significantly enhances the likelihood of timely reviews, as large or complex PRs often deter reviewers and delay progress.
When it’s unclear who should review a PR, it sits in limbo. Automated assignment eliminates this ambiguity and ensures that every team member is promptly notified when a PR exists, reducing the risk of overlooked or stalled pull requests. Managing review requests effectively—by tracking pickup times and monitoring pending review requests—helps teams identify bottlenecks and maintain steady progress.
Implementation steps:
Clear expectations around response times eliminate ambiguity and ensure reviews and merges are completed in a timely manner, which is essential for maintaining workflow efficiency and reducing waiting.
Supporting practices:
Async norms work because they remove negotiation overhead. Reviewers know what’s expected; authors know when to escalate, helping the team consistently complete reviews and merges in a timely manner.
AI-powered pre-screening represents the largest recent advancement in reducing cycle time. These tools act as a first reviewer, catching issues before human reviewers engage and transforming how AI is used in the code review process.
Atlassian’s internal deployment of their AI code review agent reduced PR cycle time by approximately 45%. Their median time from open to merge had crept above 3 days, with pickup waits averaging 18 hours. After implementing AI pre-screening, the wait for first feedback dropped to effectively zero.
How AI code review helps:
Typo customers have seen substantial improvements: StackGen achieved 30% reduction in PR review time, and JemHR improved PR cycle time by 50%. These gains come from reducing review iterations—AI code reviews catch what would otherwise require human feedback rounds.
The balance between automation and human judgment matters. AI handles mechanical checks; humans focus on architecture, logic, and maintainability. This division makes both more effective.
Even teams committed to improvement hit obstacles. These are the most frequent bottlenecks and proven solutions. Setting WIP limits helps manage work-in-progress and prevent bottlenecks, while tracking other pull request metrics—such as PR Pickup Time, cycle time, and PR size—enables teams to monitor and optimize the entire pull request process. Additionally, mapping workflows visually, creating standard operating procedures (SOPs), and implementing a RACI matrix are effective strategies for improving PR processes and reducing cycle time.
Problem: Senior engineers become bottlenecks, reviewing most PRs while their queues grow.
Solution: Implement load balancing across team members. Cross-train developers on different code areas so multiple people can approve in each subsystem. Track review distribution metrics and adjust when imbalance appears.
Problem: PRs sit waiting because no one knows who should review them.
Solution: CODEOWNERS files combined with automated assignment rules. Define clear escalation paths for when owners are unavailable. Every directory should have at least two qualified reviewers.
Problem: Constant PR notifications interrupt deep work, leading developers to ignore them entirely.
Solution: Batch review sessions instead of interrupt-driven reviews. Configure intelligent notification filtering that surfaces urgent items while batching routine reviews. Some teams find dedicated “review o’clock” times effective.
Problem: Some changes genuinely can’t be decomposed easily, especially migrations or refactoring.
Solution: Establish different review processes for known-large changes. Use incremental migration strategies where possible. When large PRs are unavoidable, schedule dedicated review time with appropriate reviewers rather than expecting async turnaround.
Reducing PR cycle time requires a systematic approach across three dimensions: controlling PR size, automating triage and initial review, and establishing clear team processes. The teams seeing 30-50% improvements aren’t doing one thing differently—they’re applying multiple interventions that compound.
Immediate next steps:
Related areas to explore: Overall DORA metrics optimization connects PR cycle time to broader delivery performance, including CI/CD optimization using DORA metrics. Developer experience measurement helps identify whether cycle time improvements translate to actual productivity gains. Understanding how AI coding tools impact your metrics ensures you’re measuring what matters as development practices evolve.
See PR Analytics in Typo to track cycle time components and identify bottlenecks in real time. The platform surfaces where your team loses time across the entire code review process, enabling targeted interventions rather than guesswork.
What’s the difference between PR cycle time and lead time for changes?
PR cycle time measures from pull request creation to merge. DORA’s Lead Time for Changes spans from first commit to running in production—a broader measure that includes time before PR creation and deployment time after merge. PR cycle time is a subset of lead time and typically the most actionable component for engineering teams to improve when you are mastering the art of DORA metrics.
How do I convince my team to keep PRs smaller without sacrificing quality?
Frame it as reducing cognitive load, not cutting corners. Smaller PRs get faster, more thorough reviews because reviewers can actually focus. Share data: PRs under 200 lines get reviewed 20× faster. Start with guidelines rather than hard limits, and celebrate examples of good decomposition. Feature flags enable shipping incomplete features safely, removing the pressure to batch everything into large PRs.
Should we prioritize speed over thorough code review?
No—but the framing is misleading. Smaller PRs enable both speed and thoroughness. A reviewer spending 20 focused minutes on a 100-line PR catches more issues than spending 90 distracted minutes on a 500-line PR. Optimize for review quality per line of code, not absolute time spent. Reserve intensive review for high-risk changes; routine changes can move faster.
How does AI code review impact overall cycle time?
AI code review primarily reduces pickup time (providing instant first feedback) and review iterations (catching issues authors would otherwise need to fix after human review). Atlassian saw 45% cycle time reduction; Exceeds AI data shows PRs with AI assistance close in 2.1 days versus 4.2 days without. The tradeoff: some research indicates AI-assisted PRs may have higher defect density, so human review remains essential for complex changes.
What’s a realistic target for teams just starting to optimize PR cycle time?
Start with reducing time to first review by 25% and ensuring 80%+ of PRs stay under 200 lines. For a team currently at 3-5 day cycle times, target reaching <48 hours within a quarter. Elite performance (<12 hours) typically requires multiple optimization cycles. Focus on consistency before speed—reducing variance in your slowest PRs often matters more than improving your already-fast ones.
This article is for software developers, project managers, and technical leads who want to understand the SDLC coding phase to ensure efficient, high-quality software delivery. The SDLC coding phase is the stage in the Software Development Life Cycle (SDLC) where your project transitions from design documents to actual, working software. If you’re searching for information about the SDLC coding phase, this guide confirms the topic and provides a comprehensive overview of what happens during this critical stage, who is involved, and which best practices and tools are essential for success.
The SDLC coding phase is when developers convert software design into code, following best practices such as adhering to coding standards, using version control, conducting code reviews, writing clean and maintainable code, ensuring modularity for scalability, performing unit testing, documenting code, and leveraging CI/CD for automation.
The Software Development Life Cycle (SDLC) consists of seven essential phases: Planning, Requirements Analysis, Design, Coding, Testing, Deployment, and Maintenance. The SDLC is the backbone of modern software development, providing a structured approach for development teams to transform ideas into high quality software products. The SDLC outlines a series of well-defined phases—planning, requirements gathering, design, coding, testing, deployment, and maintenance—that guide the software development process from start to finish. By following the development life cycle SDLC, organizations can manage complexity, align with business objectives, and ensure that the final product meets user expectations.
A disciplined SDLC helps development teams minimize risks, control costs, and deliver reliable software that stands up to real-world demands. Whether you’re building a new SaaS platform or enhancing an existing system, a robust software development life cycle ensures that every stage of the development process is accounted for, resulting in software that is both functional and maintainable throughout its software development life.
With a clear understanding of the SDLC’s structure, let’s explore the different models used to implement these phases.
Selecting the right SDLC model is a critical decision that shapes the entire software development process. There are several popular SDLC models, each designed to address different project needs and team dynamics:
Choosing the right SDLC model depends on factors like project complexity, team size, stakeholder involvement, and the need for adaptability. For example, the agile model is often preferred for complex projects where requirements may evolve, while the Waterfall model can be effective for projects with stable, well-understood requirements. Understanding the strengths and limitations of different sdlc models helps teams select the right SDLC methodology for their unique context.
With an understanding of SDLC models, let's focus on the coding phase and its role in the software development process.
The Coding phase in the Software Development Life Cycle (SDLC) is when engineers and developers start converting the software design into tangible code.
The coding phase transforms design artifacts—architecture diagrams, API contracts, and database schemas—into working software components. This is the development stage where abstract concepts become executable code that users can interact with. At this stage, developers translate the system design into actual code, ensuring that the software functions as intended. The coding phase focuses on transforming key components of the system design into reliable, maintainable, and efficient working software.
Key activities during the SDLC coding phase include adhering to coding standards, utilizing version control, and conducting thorough AI-assisted code reviews to ensure quality.
Before writing code begins, the coding phase depends on validated requirements and approved designs. During the Coding phase, developers use an appropriate programming language to write the code, guided by the Software Design Document (SDD) and coding guidelines. Software developers need clear inputs: system architecture documentation, data flow diagrams, API specifications, and detailed component designs. Without these, teams risk building features that don’t match project requirements.
Once implementation wraps up, the coding phase feeds directly into the testing phase and deployment phase through:
The development phase serves dual purposes. It’s both a production step where software development teams write code and a critical feedback point. During implementation, developers often discover design gaps, requirement ambiguities, or technical constraints that weren’t visible during planning. This makes the coding phase essential for risk assessment and continuous improvement throughout all SDLC phases.
Now that we’ve defined the coding phase and its importance, let’s look at how to prepare for successful implementation.
Strong preparation during late design and early implementation reduces costly rework. For projects kicking off in Q1 2025, getting this foundation right determines whether your team delivers high quality software on schedule.
Before any developer opens their IDE, these artifacts must exist:
Development teams need alignment on how they’ll work together:
Before coding starts, every developer needs:
A team is “ready to code” when any developer can clone the repository, run the build, and execute tests within 30 minutes of setup.
With preparation complete, let’s examine the core activities that define the coding phase.
The coding phase isn’t just writing code—it’s a structured set of activities spanning design refinement to integration. Software engineering practices have evolved significantly, and modern coding involves collaboration, automation, and continuous validation.
Typical development process tasks include:
The organization of these tasks can vary depending on the software development model chosen. Different software development models, such as Waterfall, Agile, or DevOps, influence how the coding phase is structured, managed, and integrated with other SDLC stages.
A typical daily developer workflow looks like this:
How coding is organized depends on your software development methodology:
Large features must be decomposed into manageable pieces. A feature like “User account management” planned for a 2025 release breaks down into:
Each component becomes a user story with acceptance criteria and technical subtasks tracked in project management tools like Jira, Azure Boards, or Linear.
Estimation practices help teams plan sprints effectively:
Project managers use these estimates to balance workload across the team and ensure the project scope remains achievable within the timeline, feeding directly into effective sprint planning and successful sprint reviews in Agile teams.
The tech stack is typically established during the design phase, but concrete framework choices often get finalized during coding. Teams evaluate options based on:
These aren’t exhaustive catalogs—the right choice depends on your project requirements and team capabilities and should align with broader SDLC best practices for software development.
Modern applications follow layered architectures that separate concerns:
When implementing a use case like “customer places an order on 1 July 2025,” developers translate requirements into concrete code:
Throughout this process, it is essential to validate the software's functionality to ensure that the implemented features meet user needs and perform efficiently, supported by practices such as static code analysis for early defect detection.
Design patterns support clean implementation:
This separation of concerns creates loosely coupled architecture where changes in one layer don’t cascade unpredictably through the system.
With the core activities outlined, let’s look at the tools and environments that support efficient coding.
Modern coding relies heavily on tooling for productivity, traceability, and software quality. The right tools can dramatically accelerate the software development process while maintaining code quality.
Reproducible environments matter. Using Docker Compose files, dev containers, or infrastructure-as-code ensures every developer works in conditions matching staging and the production environment, complementing collaborative workflows built around pull requests for code review and integration and AI-augmented remote code review practices.
Git-based workflows are central to the coding phase, enabling development and operations teams to work in parallel without conflicts.
GitFlow Strategy
Trunk-Based Development
A typical feature branch workflow:
Best practices include small, focused commits with clear messages, frequent integration to avoid merge conflicts, and branch protection rules preventing direct pushes to main.
CI servers automatically build and test code whenever developers push changes. Popular platforms include GitHub Actions, GitLab CI, Jenkins, and Azure DevOps, all of which are covered in depth in guides to the best CI/CD tools for 2024.
A typical CI pipeline executes these steps:
The benefit is earlier detection of integration issues. Teams catch broken builds, failing tests, and security vulnerabilities before code reaches shared branches—preventing the accumulation of defects that become expensive to fix bugs later.
CI connects the coding phase to subsequent SDLC steps like the corresponding testing phase and deployment, while keeping focus on developer workflows and fast feedback loops.
With the right tools in place, let’s examine how quality is built into the coding phase.
Much of software quality is built during coding, not only caught in later testing phases. Industry data shows that 70% of software failures trace back to poor coding standards, making quality practices during implementation essential.
Quality assurance activities embedded in coding include:
Organizations in 2024-2025 increasingly integrate security checks directly into coding workflows through DevSecOps practices. This includes SAST scanning and dependency vulnerability checks running automatically on every commit and reflects a broader shift toward an AI-driven SDLC across all lifecycle phases and the adoption of AI-powered developer productivity toolchains.
The pull request workflow is the primary mechanism for quality control and directly influences cycle time and pull request review duration:
Review criteria include:
Practical guidelines for effective reviews:
Research shows that implementing version control systems with proper review processes reduced merge conflicts by 70% in multi-team enterprise projects.
The “shift-left” approach means developers write tests alongside or before implementation, catching defects when they’re cheapest to fix. Studies indicate that unit testing during development yields 60-80% bug preemption before system testing.
Test types relevant to the coding phase:
High-quality code includes automated tests committed with the implementation. Teams should perform unit testing as part of their Definition of Done, targeting coverage above 80% for critical business logic.
Static analysis tools enforce coding standards and identify potential issues without running code:
Security-focused tools integrated into coding workflows, alongside broader code quality and maintainability practices, strengthen overall software resilience:
Security testing plays a critical role in the SDLC coding phase by identifying vulnerabilities such as system weaknesses, data breaches, and authentication flaws. It is integrated throughout development, often using automated processes like penetration testing and vulnerability scanning, and is a key part of DevSecOps practices.
These tools help teams address SDLC address security concerns early. Organizations define quality gates—minimum coverage percentages, zero critical vulnerabilities—that must pass before merging.
This approach helps deliver software that remains functional and secure throughout its lifecycle, supporting ongoing maintenance with fewer defects reaching the production environment. Documentation of code and architecture is necessary to ensure long-term maintainability.
With quality practices embedded, let’s see how AI and automation are reshaping the coding phase.
AI-assisted coding has become mainstream by 2024-2025, significantly impacting how software developers work. GitHub reports that tools like Copilot can automate approximately 40% of boilerplate code, freeing developers to focus on complex business logic and underscoring the need to follow AI coding impact metrics and best practices and assess top generative AI tools for developers.
AI capabilities in the coding phase include a growing ecosystem of AI coding assistants that boost development efficiency and AI-driven development platforms that unify engineering data and workflows:
Benefits are significant: faster delivery, reduced manual work on repetitive tasks, and accelerated onboarding for new team members, particularly in distributed teams that rely on AI-powered remote review workflows. However, risks require attention:
AI tools accelerate coding but don’t replace developer judgment. Every suggestion requires evaluation before integration.
Concrete scenarios where AI assists during the SDLC coding phase:
Generating Initial Implementations
A developer writes a function signature and docstring describing the expected behavior. AI suggests the complete implementation, which the developer reviews and refines.
Scaffolding REST Endpoints
Given an OpenAPI specification, AI tools can generate controller stubs, request/response DTOs, and basic validation logic—saving hours of repetitive coding.
Prototyping UI Components
Describing a component’s requirements in natural language yields initial React or Vue component code, including styling and event handlers.
Test Case Suggestions
Based on function signatures and existing tests, AI suggests additional test cases covering edge conditions the developer might overlook.
Refactoring Assistance
During an April 2025 sprint, AI identifies duplicate logic across multiple services and suggests extracting it into a shared utility, complete with migration steps.
All AI output requires review for correctness, performance, licensing compliance, and security before merging. User feedback on AI suggestions helps improve accuracy over time.
With automation and AI accelerating development, let’s see how Agile methodology shapes the coding phase.
Agile methodology has transformed the coding phase of the SDLC by introducing flexibility, collaboration, and a relentless focus on continuous improvement. In Agile, the coding phase is organized into short, time-boxed sprints—typically lasting one to four weeks—where development teams tackle a prioritized set of user stories or features. This approach enables teams to deliver working software incrementally, gather user feedback early, and adapt quickly to changing requirements, especially when combined with lean SDLC practices tailored for startups.
During each sprint, developers collaborate closely, write and refactor code, and perform frequent code reviews to maintain high software quality. Continuous integration and automated testing are integral, ensuring that new code is always production-ready and that bugs are caught early. Agile methodology encourages open communication, regular retrospectives, and iterative enhancements, empowering development teams to improve their processes and outcomes with every sprint. By embracing Agile in the coding phase, organizations can reduce risk, accelerate delivery, and consistently meet customer expectations.
With Agile practices in mind, let’s consider how to deliver scalable software.
Delivering scalable software is essential for organizations aiming to support growth and adapt to changing user demands. Achieving scalable software delivery requires careful attention to system architecture, infrastructure, and robust testing practices throughout the software development process.
A well-architected system lays the foundation for scalability, enabling applications to handle increased traffic and data volumes without sacrificing performance. Leveraging modern infrastructure solutions—such as cloud platforms, containerization, and orchestration tools—gives development teams the flexibility to scale resources up or down as needed. Comprehensive testing, including load and performance testing, ensures that the software remains reliable under varying conditions.
Incorporating DevOps practices like continuous integration and continuous deployment (CI/CD) further streamlines the development process, allowing teams to deliver updates rapidly and with confidence. By prioritizing scalability from the outset, development teams can build software that not only meets current requirements but is also prepared for future growth, ensuring a seamless experience for users and stakeholders alike.
With scalability addressed, let’s look at how the coding phase transitions to testing and deployment.
The coding phase doesn’t end when code compiles—it ends when code is integrated, tested, and ready for formal QA and release. The testing process depends on quality handover from development. Key components such as source code, documentation, test cases, and deployment scripts must be provided to the testing team to ensure a smooth transition.
The goal of the testing phase is to identify and fix bugs, ensuring the software operates as intended before being deployed to users.
Software development teams must provide:
Successful CI builds are promoted through environments:
Feature flags and configuration toggles enable teams to deploy code to production while selectively enabling functionality. This supports scalable software delivery where the final product can be released incrementally.
This approach aligns with customer expectations by enabling faster delivery while maintaining control over feature rollout and supporting customer feedback cycles.
With the handover complete, let’s examine common pitfalls and how to avoid them.
Many SDLC failures trace back to poor practices in the coding phase rather than pure technical limitations. Focusing on the quality of the actual code is crucial to avoid common pitfalls that can lead to costly issues later. Understanding common pitfalls helps teams avoid expensive rework.
In the prevention strategies subsection, it's important to note that proper modular coding allows for easier scalability and future feature additions.
In late 2024, a development team bypassed code review to meet a deadline, introducing a regression bug that affected payment processing. The fix required emergency deployment, customer communication, and three days of recovery effort—far exceeding the time a proper review would have taken.
The maintenance phase inherits whatever quality the coding phase produces. Software projects that cut corners during implementation pay multiples later in support costs, with maintenance potentially consuming 60% of total lifecycle budgets.
Following a structured approach to risk analysis during coding helps identify issues before they reach the testing deployment and maintenance phases.
With pitfalls addressed, let’s conclude with the importance of a strong coding phase in the SDLC.
The coding phase is where requirements and design finally become working software artifacts. It’s the pivotal development stage where planning meets reality, transforming business objectives into the software’s functionality that serves users. Ongoing maintenance is essential to ensure the software remains functional and continues to operate effectively after deployment.
Disciplined coding practices—supported by modern tooling, AI assistance, comprehensive testing, and rigorous reviews—reduce risk and accelerate the entire process. Teams that invest in quality during implementation spend less time fixing bugs in testing and maintenance.
Continuous maintenance is necessary to ensure software remains functional and meets evolving user needs after deployment. The maintenance phase in the Software Development Life Cycle (SDLC) is characterized by constant assistance and improvement, ensuring the software's best possible functioning and longevity. Ongoing support during the maintenance phase addresses issues, applies updates, and adds new features to the software. This phase also involves responding to user feedback, resolving unexpected issues, and upgrading the software based on evolving requirements. Maintenance tasks include frequent software updates, implementing patches, and fixing bugs to ensure software longevity. User support is a crucial component of the maintenance phase, offering help and guidance to users facing difficulties with the software. The maintenance phase is essential for safeguarding the longevity of any piece of software, similar to maintaining a house over time.
View coding not as an isolated activity but as an integrated, collaborative phase connected to planning, design, testing, deployment and maintenance, and operations. The right sdlc model for your organization balances structure with flexibility, enabling software development teams to deliver consistently.
Looking forward, the SDLC coding phase will continue evolving. AI-augmented development, shift-left security practices, and continuous delivery techniques will reshape how traditional software development approaches complex projects. Teams that embrace these changes while maintaining fundamental engineering discipline will build the high quality software that meets customer expectations and supports system performance at scale.
The key components of the SDLC—including planning, design, coding, testing, deployment, and maintenance—work together to deliver high-quality software. Each phase plays a vital role, and ongoing maintenance ensures the software remains functional, secure, and aligned with user needs throughout its lifecycle.
Start by evaluating your current coding practices against the checklists in this article. Choose one area—whether it’s improving code reviews, adding static analysis, or integrating AI tools—and implement it in your next sprint. Incremental improvements compound into significant gains across your software development lifecycle.
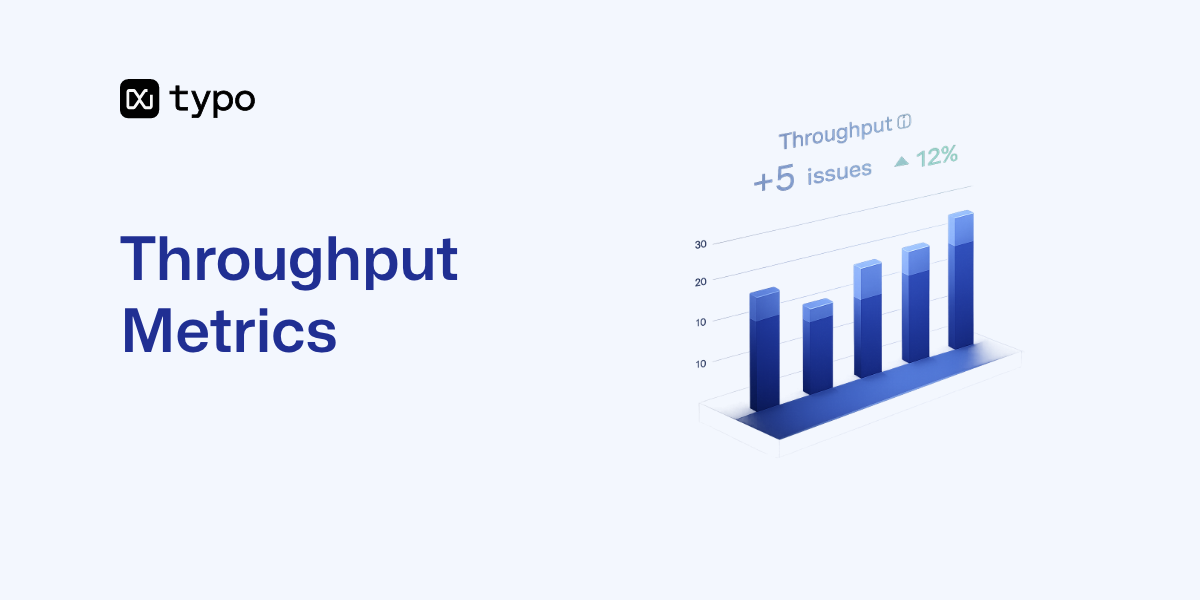
In 2026, organizations across manufacturing, IT, and product development face mounting pressure to deliver more value with fewer resources. Throughput metrics have become the universal language for quantifying exactly how much value—whether units, tasks, transactions, or data—a system delivers per unit of time. Understanding throughput is no longer optional; it’s the foundation of operational efficiency and competitive advantage.
Throughput metrics are typically tracked over a certain period, such as daily or weekly intervals, to analyze and optimize efficiency.
This guide is intended for operations managers, software development leads, IT professionals, and anyone responsible for optimizing system performance or delivery processes. Tracking key metrics is essential for monitoring system performance and identifying opportunities to improve throughput.
This article covers throughput metrics across three critical domains: manufacturing operations, Agile and Kanban workflows in software development processes, and system performance including network and load testing. You’ll learn core formulas with practical examples, discover how to calculate throughput in different contexts, and understand how to interpret throughput data alongside related metrics like cycle time, lead time, and bandwidth.
Throughput refers to the number of completed units of output delivered per defined period.
Throughput metrics measure the rate at which a system processes, completes, or delivers work within a specific timeframe. Throughput is the amount of data or transactions a system processes within a defined time frame under specific conditions. Throughput is the amount of a product that a company can produce and deliver within a set time period. Throughput measures how quickly and efficiently an organization can deliver products, services, or completed work to meet customer demands.
Whether you’re measuring products per hour, stories per sprint, or requests per second, the fundamental concept remains consistent: throughput quantifies your system’s actual delivery rate.
The basic formula is straightforward:
Throughput = Number of Completed Units / Time Period
The critical distinction here is that “completed units” must represent actual value delivered—sold products, deployed features, or successfully processed requests—rather than merely work started. A chair manufacturer with 100 chairs in their production process and an average flow time of 10 days has a throughput of 10 chairs per day, regardless of how many units are still being assembled.
Because throughput is a rate (not a raw count), it’s sensitive to both volume and time. This characteristic makes measuring throughput central for capacity planning, allowing teams to forecast how many units or tasks they can realistically deliver within a given period.
While the mathematical definition of throughput remains consistent, its practical interpretation varies across industries:
These variations share a common thread: throughput always answers “how many units of value does this process deliver per unit of time?”
Throughput rarely tells the complete story on its own. To gain valuable insights into team performance and organizational performance, you need to analyze throughput alongside other key flow metrics that capture different dimensions of system behavior.
Throughput metrics gained strategic prominence through the Theory of Constraints (TOC), pioneered by Eliyahu Goldratt in his 1984 novel “The Goal.” TOC positions throughput as the primary measure of system success, with all performance ultimately limited by a single constraint or bottleneck.
Consider a factory capable of assembling 500 units daily, yet shipping only 350 units due to final inspection capacity limits. This throughput analysis immediately highlights where management should focus improvement efforts. Organizations use throughput per shift, per day, or per week as a governance metric in manufacturing, logistics, and warehouse operations to identify areas requiring intervention.
In software development and knowledge work, throughput tracks completed work items—user stories, tasks, bugs, or features—over a sprint or week. This performance metric provides a count-based view of delivery capacity that supports forecasting and process stability assessment.
Consider two teams with similar velocity of 40 story points per sprint. Team A completes 8 large items while Team B completes 16 smaller items. Differences in how teams estimate work—such as whether they rely more on story points vs hours for estimation—also influence how throughput and velocity trends are interpreted. Team B’s higher throughput typically indicates better predictability and more frequent customer feedback—demonstrating why throughput matters for agile project management.
Kanban tools commonly visualize throughput using specialized charts that reveal patterns invisible in raw numbers:
A typical pattern might show a team whose throughput centers around 6-8 items/day under normal conditions but occasionally spikes to 15 items immediately following big releases when accumulated items flow through to completion. Recognizing these patterns enables better sprint planning and resource allocation.
In Scrum, throughput measures completed Product Backlog Items per sprint, regardless of story point estimates. This simplicity makes it powerful for tracking team’s throughput over time, especially when complemented with DORA metrics to improve Scrum team performance.
Example progression:
Best practices for Scrum throughput:
In performance testing, throughput measures transactions processed per second or minute under specific load conditions. This metric is central to validating that systems can handle expected—and unexpected—traffic volumes.
Test reports typically present time-series throughput graphs, helping teams identify at what user load throughput plateaus and correlate performance degradation with specific system components.
Network throughput represents actual volume of data successfully delivered over a link per second, while bandwidth defines maximum theoretical capacity. Understanding this distinction is crucial for realistic capacity planning.
Engineers read throughput graphs during incident analysis to pinpoint whether network capacity, application logic, or backend systems are causing degradation.
This section provides ready-to-use formulas for typical contexts along with guidance on interpretation and common pitfalls.
Operations/Manufacturing:
Agile/Kanban:
Performance Testing:
Financial/Healthcare:
Interpretation guidance:
Throughput measurement tools play a key role in helping organizations achieve operational efficiency by providing the data and insights needed to calculate throughput, analyze performance, and identify bottlenecks across workflows. By leveraging these tools, teams can visualize throughput, track progress on tasks, and pinpoint areas where efficiency can be improved.
Time tracking software is a foundational tool for measuring how long tasks and projects take to complete. By capturing detailed throughput data, these tools enable teams to analyze throughput trends, identify areas where work slows down, and make informed decisions to optimize productivity.
Project management platforms such as Asana, Trello, and Jira are widely used to manage workflows, monitor work in progress, and track completed items over a set timeframe. These tools not only help teams calculate throughput but also provide valuable insights into team performance, allowing managers to identify bottlenecks and allocate resources more effectively. By visualizing throughput and work completed, organizations can quickly spot inefficiencies and implement targeted improvements.
Analytics software, including solutions like Google Analytics and Mixpanel, extends throughput measurement to digital environments. These tools help organizations analyze throughput in terms of website traffic, user actions, and conversion rates, offering a data-driven approach to optimizing digital processes and increasing throughput.
In supply chains and logistics, specialized supply chain management software is essential for tracking inventory, monitoring the flow of raw materials, and managing the production process. These tools help organizations identify areas where wait time or processing time limits throughput, enabling more efficient sourcing of raw materials and smoother delivery of finished goods.
By integrating these throughput measurement tools into their operations, organizations gain the ability to continuously monitor, analyze, and improve throughput. This leads to greater efficiency, higher productivity, and a more agile response to changing business demands.
Consistently tracking throughput gives organizations a quantitative basis for improvement decisions rather than relying on intuition or anecdotes. The benefits span operational, financial, and customer-facing dimensions.
These benefits apply across functions: operations teams use throughput for scheduling, engineering teams for sprint planning, and finance teams for margin analysis.
Improving throughput isn’t simply about working faster—it requires systematically removing constraints and reducing waste. The flow rate through any system depends on its weakest link, so indiscriminate effort often yields minimal results.
Any throughput increase must be balanced with quality and risk management. Track defect rates, error percentages, and customer complaints alongside throughput to ensure speed doesn’t compromise value. Maintaining high throughput means nothing if quality degrades.
Organizations seeking to maximize throughput and maintain high operational efficiency often adopt proven methodologies and frameworks that focus on continuous improvement, reducing bottlenecks, and increasing productivity. These organizational approaches are designed to optimize the flow of work, streamline processes, and ensure that resources are used as efficiently as possible.
Lean manufacturing is a widely adopted approach that emphasizes the elimination of waste, reduction of variability, and improvement of process flow. By focusing on value-added activities and systematically removing inefficiencies, Lean helps organizations increase throughput and deliver more value with fewer resources.
Agile project management is another powerful strategy, particularly in software development and knowledge work. By breaking down large projects into smaller, manageable tasks and prioritizing work based on customer value, Agile teams can improve throughput, adapt quickly to change, and foster a culture of continuous improvement. Regular retrospectives and iterative planning help teams identify bottlenecks and implement targeted improvements to their workflows.
Total Quality Management (TQM) takes a holistic approach to improving throughput by engaging employees at all levels in the pursuit of quality and efficiency. TQM emphasizes continuous improvement, data-driven decision-making, and a strong focus on customer satisfaction. By embedding quality into every stage of the production process, organizations can reduce rework, minimize delays, and increase overall throughput.
Just-in-time (JIT) production is a strategy that aligns production schedules closely with customer demand, minimizing inventory and reducing wait times. By producing and delivering products only as needed, organizations can optimize throughput, reduce excess work in progress, and respond more flexibly to market changes.
By implementing these organizational approaches, companies can systematically improve throughput, reduce bottlenecks, and drive ongoing improvements in efficiency and productivity. These strategies not only enhance team performance and project management outcomes but also position organizations for long-term success in competitive markets.
Throughput can mislead when measured incorrectly or incentivized poorly. Awareness of common pitfalls helps teams avoid optimizing for the wrong outcomes.
In one documented case, throughput-tied bonuses led a team to fragment large projects into dozens of tiny tickets, technically increasing throughput while delaying actual project completion by weeks. The lesson: throughput incentives must align with customer value, not just item counts.
Throughput metrics, when clearly defined and consistently measured, provide a powerful lens on system performance across manufacturing, Agile delivery, and IT operations. From how many units a factory ships daily to transactions processed by financial systems per second, throughput answers the fundamental question of delivery capacity.
The most effective use of throughput combines:
Industry leaders in 2026 leverage throughput metrics not just for reporting, but for probabilistic forecasting, constraint identification, and continuous improvement. Real-time dashboards in manufacturing execution systems and Kanban tools provide immediate visibility, while AI-driven simulations enable more sophisticated planning than simple averages allow.
Start by mapping your current process and identifying the single biggest constraint limiting your throughput today. Implement basic throughput tracking with consistent definitions and measurement periods. As your data matures, incorporate other metrics and move toward more advanced analyses. Building resilient, scalable, and customer-centric operations requires exactly this kind of quantitative foundation—and throughput metrics provide the starting point.
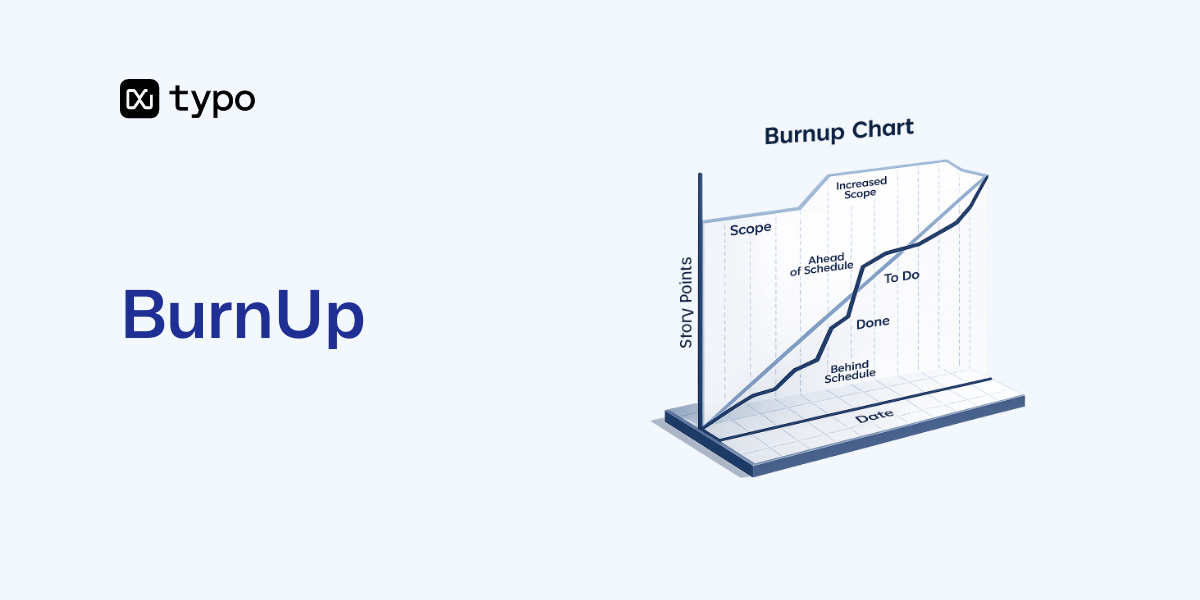
If you’ve searched for “burn ups,” chances are you’re either tracking a software project or diving into nuclear engineering literature. This guide explains Agile project management.
Another common Agile project tracking tool is the burn down chart, which is often compared to burn up charts. We'll introduce the basic principles of burn down charts and discuss how they differ from burn up charts later in this guide.
A burn up chart is a visual tool that tracks completed work against total scope over time. Scrum and Kanban teams use it to visualize how close they are to finishing a release, sprint, or project. Unlike a burndown chart that starts high and decreases, a burn up chart starts at zero and rises as the team delivers. A burn down chart visualizes the remaining work over time, starting with the total scope and decreasing as work is completed, and is especially useful for projects with fixed scope.
A typical Agile burn up chart displays two lines on the same graph:
Teams measure progress using various units depending on their workflow, and the choice between story points vs. hours for estimation affects how you interpret the chart:
The horizontal axis typically shows time in days, weeks, or sprints. For example, a product team might configure their x axis to display 10 two-week sprints spanning Q2 through Q4 2025.
Visual elements of an effective burn up chart:
Figure 1: A sample burn up chart for a 6-sprint mobile app project would show a scope line starting at 100 story points, rising to 120 in sprint 3, with the progress line climbing from 0 to meet it by sprint 6.
Burn up charts are favored in Agile environments because they make project progress, scope changes, and completion forecasts visible at a glance. When stakeholders ask “how much work is left?” or “are we going to hit the deadline?”, a burn up chart answers both questions without lengthy explanations.
Key benefits of using burn up charts:
Realistic usage scenarios:
Burn up vs. burndown: key distinction
For a deeper dive into a complete guide to burndown charts, you can explore how they complement burn up charts in Agile tracking.
Prefer burnups when your scope evolves, your team does discovery-heavy work, or you’re managing long-running product roadmaps. A simple burndown may suffice for fixed-scope, short-lived projects like one sprint or a small feature.
The process of creating a burn up chart works across spreadsheets (Excel, Google Sheets) and Agile tools like Jira, Azure DevOps, and ClickUp. These steps are tool-agnostic, so you can apply them anywhere.
Step-by-step process:
Example with actual numbers: Your team begins a release with 120 story points planned. By sprint 3, new regulatory requirements add 30 points, pushing total scope to 150. Your burn up chart shows the scope line jumping from 120 to 150 at the sprint 3 boundary. Meanwhile, your completed work line has reached 45 points. The visual immediately shows stakeholders why the remaining work increased—without making your team look slow.
Configuring a burn up report in Agile tools:
Visual design tips:
Your team should be able to set up a basic burn up chart in under an hour, whether using a spreadsheet template or a built-in tool report.
Reading a burn up chart means understanding what each line, gap, and slope tells you about delivery risk, progress velocity, and scope changes. Once you know the patterns, the chart becomes a powerful forecasting tool.
Understanding the axes:
Interpreting the gap: The space between the scope line and the completed work line at any date represents work remaining. For example:
If your team maintains velocity at 25 points per sprint, you can project completion in two more sprints, assuming you understand how to use Scrum velocity as a planning metric rather than a rigid performance target.
Common patterns and their meanings:
Walkthrough example: Consider a 10-week web redesign project with 150 story points in scope. By week 3, the team has completed only 20 points—well below the ideal pace line that projected 45. The burn up chart makes this gap obvious. After the team removes a critical impediment (switching a blocked vendor integration), velocity doubles. By week 8, completed work reaches 140 points, nearly catching the scope line.
When patterns indicate risk—like a widening gap heading into a November 2025 release—the chart supports practical decisions: renegotiating scope with stakeholders, adding resources, or adjusting the delivery date.
Both burnup charts and burndown charts track progress over time, but they show it from opposite perspectives. A burn up chart displays completed work rising toward scope. A burndown chart displays work remaining falling toward zero.
Key differences:
Concrete example:
When to choose each chart:
Some teams use both charts side by side in Jira or Azure DevOps. This can provide comprehensive views, but teams should agree on which chart serves as the “single source of truth” for status reports and stakeholder communication, while using iteration burndown charts for sprint-level insight.
Burn up charts work at the sprint level, but their real power emerges when applied to releases and multi-team portfolios spanning several quarters.
Release forecasting with projection lines:
Portfolio burn up charts:
Caveats for forecasting:
Advanced setups might integrate burn up charts with other metrics like cycle time, work-in-progress limits, or defect rates, or combine them with additional engineering progress tracking tools such as Kanban boards and dashboards. However, keep the chart itself simple and readable—additional complexity belongs in separate reports.
While burn up charts are invaluable in Agile project management, the term “burnup” also plays a critical role in nuclear engineering, which we’ll explore next.
Update frequency depends on your workflow. For sprints, updating at the end of each day during stand-ups provides early warning of issues. For releases spanning multiple sprints, updating at sprint boundaries often suffices. Kanban teams typically update daily since they don’t have sprint boundaries.
Absolutely. In Kanban, configure the horizontal axis as calendar days rather than discrete sprints. Plot cumulative completed work daily against your target scope. The cumulative flow diagram offers complementary insights, but a burn up chart still works for visualizing progress toward a goal.
Persistent scope growth signals either poor initial estimation, stakeholder pressure, or unclear project boundaries. Use the burn up chart as evidence in stakeholder conversations. Show how each scope increase pushes out the projected completion date, then negotiate trade-offs: add resources, extend timelines, or cut lower-priority features.
Track at both levels if possible. Sprint-level burn up charts help the team during daily stand-ups. Release-level charts inform product managers and stakeholders about overall trajectory. Most Agile tools support both views from the same underlying data.
If your completed work line is tracking parallel to or above an ideal pace line connecting your start point to the target end date, you’re on track. If the gap between your progress line and scope line is shrinking at your current velocity, you should meet the deadline.
For Agile teams:
Start by creating a burn up chart for your next sprint. Watch how making scope and progress visible transforms your team’s conversations—and your ability to deliver on time.
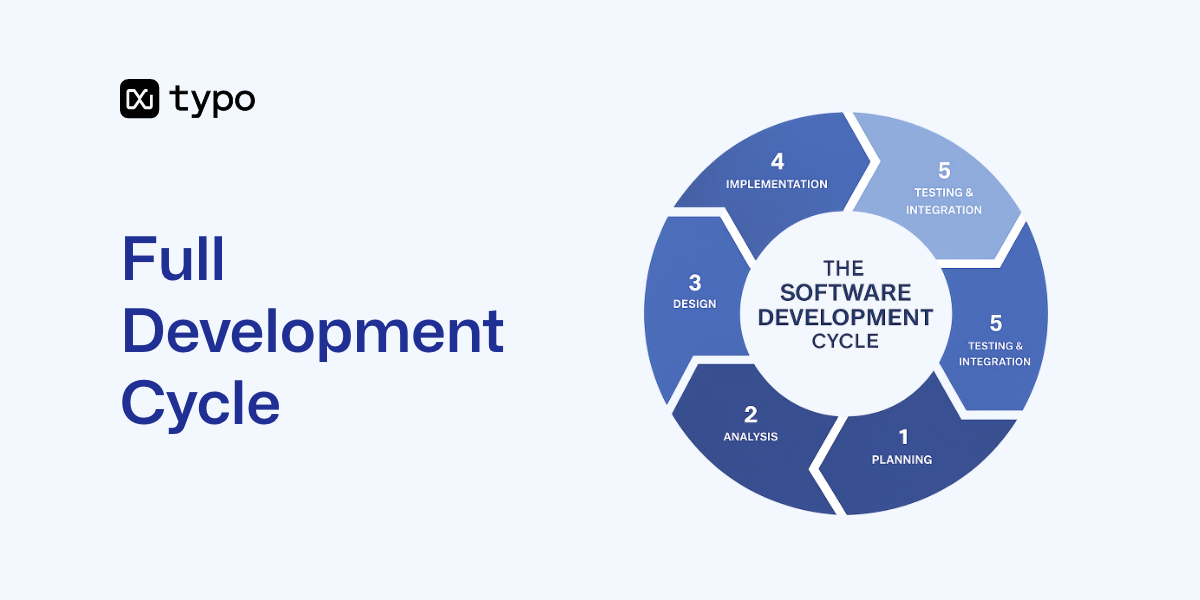
The full development cycle, commonly referred to as the Software Development Life Cycle (SDLC), is a structured, iterative methodology used to plan, create, test, and deploy high-quality software efficiently at a low cost. The SDLC consists of several core stages, also known as common SDLC phases and key phases: planning, design, implementation, testing, deployment, and maintenance. Each of these phases plays a critical role in the software development process, serving as essential checkpoints that contribute to quality and project success.
After understanding the phases, it’s important to recognize the variety of SDLC models available. Common SDLC models include the Waterfall model (a linear, sequential approach best for small projects), the Agile model (an iterative, flexible methodology emphasizing collaboration and customer feedback), the V-shaped model (which focuses on validation and verification through testing at each stage), the Spiral model (which combines iterative development with risk assessment), and the RAD (Rapid Application Development) model (which emphasizes quick prototyping and user feedback). Choosing the right SDLC model depends on the software project’s requirements, team structure, and complexity, especially for complex projects.
The full development cycle refers to managing a software product’s entire process and full life cycle through a structured SDLC process that maintains team continuity and a unified project vision. This approach is central to custom software development and full cycle development, where the same project team is engaged throughout the software development lifecycle. A full cycle developer is involved in all stages of the software development process, ensuring seamless workflow, clear communication, and comprehensive responsibility for project success. Unlike segmented or sprint-based development, full-cycle software development services ensure no interruptions during the development cycle, leading to faster time-to-market, better budget management, and cost-effectiveness.
Full-cycle software development is also ideal for MVP development, as it allows for planning all steps in advance and gradual implementation. This is particularly beneficial for complex projects, as it allows for comprehensive planning, risk management, and proactive problem-solving. The consistency of engaging the same team throughout the entire process enhances communication, collaboration, and the quality of the final product. A unified dev team boosts developer productivity and operational efficiency, empowering the team to deliver better results and reduce burnout.
Why does this matter? With fast-changing market demands and high customer expectations, managing the entire lifecycle allows faster response to change, better alignment to business objectives, and improved quality assurance. Effective project management in a software project includes monitoring & controlling, risk management, and maintaining cost & time efficiency through detailed planning and improved visibility, all of which contribute to effective software delivery across the SDLC. Improved visibility and efficiency in SDLC keeps stakeholders informed and streamlines project tracking.
Organizations using fragmented approaches often accumulate significant technical debt because early decisions in system architecture, security, and user experience suffer when later teams lack context from previous development stages. Effective communication among team members and full cycle developers further enhances workflow efficiency and project success, particularly when supported by well-chosen KPIs for software development team success that align everyone on shared outcomes.
Risk management in SDLC detects issues early, mitigating potential security or operational risks, especially when teams follow well-defined software development life cycle phases with clear deliverables and review points. Additionally, SDLC addresses security by integrating security measures throughout the entire software development life cycle, not just in the testing phase. Approaches such as DevSecOps incorporate security early in the process and make it a shared responsibility, ensuring a proactive stance on security management during SDLC from initial design to deployment.
The development cycle, often referred to as the software development life cycle (SDLC), is a structured process that guides development teams through the creation of high quality software. By following a systematic approach, the SDLC ensures that every stage of software development—from initial planning to final deployment—is carefully managed to meet customer expectations and business goals. This life cycle is designed to bring order and efficiency to software development, reducing risks and improving outcomes. Each phase of the development cycle plays a vital role in shaping the software development life, ensuring that the final product is robust, reliable, and aligned with user needs. By adhering to a structured process, organizations can deliver software that not only functions as intended but also exceeds customer expectations throughout its entire life cycle.
The Development Life Cycle SDLC is the backbone of a successful software development process, providing a systematic framework that guides teams from concept to completion. By breaking down the software development process into distinct, interconnected phases—such as planning, design, implementation, testing, deployment, and maintenance—the SDLC process ensures that every aspect of the project is carefully managed and aligned with customer expectations. This structured approach not only helps development teams produce high quality software, but also enables them to anticipate challenges, allocate resources efficiently, and maintain a clear focus on project goals throughout the life cycle. By adhering to the development life cycle SDLC, organizations can deliver software that is reliable, scalable, and tailored to meet the evolving needs of users, ensuring long-term success and satisfaction.
A streamlined workflow is the backbone of an effective software development life cycle. In full cycle software development, the development team benefits from a clearly defined process where each stage—from planning through deployment—is mapped out and responsibilities are transparent. This clarity allows the team to collaborate efficiently, minimizing bottlenecks and ensuring that every member knows their role in the development cycle. By maintaining a structured workflow, the development process becomes more predictable and manageable, which is essential for delivering high quality software that aligns with customer expectations. Project management plays a pivotal role in this, with methodologies like agile and Lean development practices for SDLC helping teams adapt quickly to changes and stay focused on their goals, and with resources on engineering data management and workflow automation further supporting continuous improvement. Ultimately, a streamlined workflow supports the entire life cycle, enabling the development team to deliver consistent results and maintain momentum throughout the software development life.
The planning and requirement gathering phase is the cornerstone of a successful software development life cycle. During this stage, the development team collaborates closely with stakeholders—including customers, end-users, and project managers—to collect and document all necessary requirements for the software project. This process results in the creation of a comprehensive software requirement specification (SRS) document, which outlines the project scope, objectives, and key deliverables. The SRS serves as a roadmap for the entire development process, ensuring that everyone involved has a clear understanding of what needs to be achieved. In addition to defining requirements, the planning phase involves careful risk management, accurate cost estimates, and strategic resource allocation that directly influence developer productivity throughout the project. These activities help the team assess project feasibility and set realistic timelines, laying a solid foundation for the rest of the software development life, including planning for effective code review best practices that will support code quality later in the cycle. By investing time and effort in thorough planning, development teams can minimize uncertainties and set the stage for a smooth and successful project execution.
The Design Phase is a pivotal part of the software development life cycle, where the vision for the software begins to take concrete shape. During this stage, software engineers use the insights gathered during the planning phase to craft a detailed blueprint for the software product. This involves selecting the most appropriate technologies, development tools, and considering the integration of existing modules to streamline the development process. The design phase also addresses how the new solution will fit within the current IT infrastructure, ensuring compatibility and scalability. The result is a comprehensive design document that outlines the software’s architecture, user interfaces, and system components, serving as a roadmap for the implementation phase. By investing in a thorough design phase, development teams lay a strong foundation for the entire development process, reducing risks and setting the stage for a successful software development life.
The development stages of the software development life cycle encompass the design, implementation, and testing phases, each contributing to the creation of a high quality software product. In the design phase, software engineers translate requirements into a detailed blueprint, defining the software’s architecture, components, and interfaces. This careful planning ensures that the system will be scalable, maintainable, and aligned with the project’s goals, while also creating the context needed to avoid common mistakes during code reviews that can undermine software quality. The implementation phase follows, where the development team brings the design to life by writing code, conducting code reviews, and performing unit testing to verify that each component functions correctly. Collaboration and attention to detail are crucial during this stage, as they help maintain code quality and consistency. Once the core features are developed, the testing phase begins, involving integration testing, system testing, and acceptance testing. These activities validate the software’s functionality, performance, and security, ensuring that it meets the standards set during the earlier phases. By progressing through these development stages in a structured manner, teams can effectively manage the software development life, reduce overall software cycle time, and minimize coding time within cycle time to deliver reliable solutions that fulfill user needs.
Testing and quality assurance are essential components of the software development life cycle, ensuring that the final product meets both technical standards and customer expectations. During the testing phase, the testing team employs a variety of techniques—including black box, white box, and gray box testing—to thoroughly evaluate the software’s functionality, performance, and security, often relying on specialized tools that improve the SDLC from automated testing to continuous integration. These methods help identify and report defects early, reducing the risk of issues in the production environment. Quality assurance goes beyond testing by incorporating activities such as code reviews, validation, and process improvements to guarantee that the software is reliable, stable, and maintainable, often supported by an effective code review checklist that standardizes review criteria. The creation of detailed test cases, test scripts, and test data enables comprehensive coverage and repeatable testing processes. By prioritizing quality assurance throughout the life cycle, development teams can produce high quality software that not only meets but often exceeds customer expectations, supporting long-term success and continuous improvement in the software development process.
Deployment and Maintenance are essential phases in the software development life cycle that ensure the software product delivers ongoing value to users. The deployment phase is when the software is packaged, configured, and released into the production environment, making it accessible to end-users. This stage requires careful planning to ensure a smooth transition and minimal disruption. Once deployed, the maintenance phase begins, focusing on supporting the software throughout its operational life. This includes addressing bugs, implementing updates, and responding to user feedback to ensure the software continues to meet customer expectations. Maintenance also involves monitoring system performance, enhancing security, and making necessary adjustments to keep the software reliable and efficient. Together, the deployment and maintenance phases are crucial for sustaining the software development life and ensuring the product remains robust and relevant over time.
One of the standout advantages of full cycle software development is the ability to achieve faster time-to-market by improving key delivery metrics such as cycle time and lead time. By following a structured development process and leveraging iterative development practices, development teams can quickly transform ideas into a working software product. This approach allows for rapid prototyping, frequent releases, and continuous feedback, ensuring that new features and improvements reach users sooner. Automation in testing and deployment further accelerates the process, reducing manual effort and minimizing delays. As a result, businesses can respond swiftly to evolving market demands, outpace competitors, and better satisfy customer needs. The full cycle approach not only speeds up delivery but also ensures that the software product maintains the quality and functionality required for long-term success.
Navigating the software development life cycle comes with its share of risks, from project delays and budget overruns to the delivery of subpar software. Effective risk management is essential to a successful development process. Development teams can proactively address potential issues through comprehensive risk analysis, identifying and evaluating threats early in the development cycle. Contingency planning ensures that the team is prepared to handle unexpected challenges without derailing the project. Continuous testing throughout the development life cycle SDLC helps catch defects early, while analyzing cycle time across development stages reduces the likelihood of costly fixes later on. Strong project management practices, supported by the right tools and careful tracking of issue cycle time in engineering operations and accurately calculating cycle time in software development, keep the team organized and focused, further minimizing risks. By integrating these strategies, teams can safeguard the software development life, ensuring that the final product meets both quality standards and customer expectations.
A successful software development life cycle relies on a suite of tools and technologies that support each phase of the development process. Project management tools help the development team organize tasks, track progress, and collaborate effectively. Version control systems, such as Git, ensure that code changes are managed efficiently and securely, while tracking key DevOps metrics for performance helps teams understand how those changes affect delivery speed and stability. Integrated development environments (IDEs) like Eclipse streamline coding and debugging, while testing frameworks such as JUnit enable thorough and automated software testing. Deployment tools, including Jenkins, facilitate smooth transitions from development to production environments. The selection of these tools depends on the project’s requirements and the preferences of the development team, but their effective use can significantly enhance the efficiency, quality, and reliability of the software development process throughout the life cycle.
Adopting best practices is vital for development teams aiming to deliver high quality software that meets and exceeds customer expectations. Following a structured software development life cycle ensures that every phase is executed with precision and accountability. Thorough requirements gathering and analysis lay the groundwork for success, while iterative and incremental development approaches allow for flexibility and continuous improvement. Regular code reviews help maintain code quality and catch issues early, and the use of version control systems safeguards project assets, especially when teams follow best practices for setting software development KPIs to measure and improve these activities. Continuous testing and integration ensure that new features are reliable and do not disrupt existing functionality. Additionally, investing in the ongoing training and development of the team, embracing agile methodologies, and fostering a culture of learning and adaptation all contribute to a robust software development life. By integrating these best practices into the life cycle, development teams can consistently produce software that is reliable, maintainable, and aligned with customer needs.
AI coding tool impact is now a central concern for software organizations, especially as we approach 2026. Engineering leaders and VPs of Engineering are under increasing pressure to not only adopt AI coding tools but also to measure, optimize, and de-risk their investments. Understanding the true impact of AI coding tools is critical for maintaining competitive advantage, controlling costs, and ensuring software quality in a rapidly evolving landscape.
The scope of this article is to provide a comprehensive guide for engineering leaders on how to measure, optimize, and de-risk the impact of AI coding tools within their organizations. We will synthesize public research, real-world metrics, and actionable measurement practices to help you answer: “Is Copilot, Cursor, or Claude Code actually helping us?” This guide is designed for decision-makers who need to justify AI investments, optimize developer productivity, and safeguard code quality as AI becomes ubiquitous in the software development lifecycle (SDLC).
AI coding tools are everywhere. The 2025 DORA report shows roughly 90% of developers now use them, with daily usage rates climbing from 18% in 2024 to 73% in 2026. GitHub Copilot alone generates 46% of all code written by developers. Yet most engineering leaders still can’t quantify ROI beyond license counts.
The central tension is stark. Some reports show “rocket ship” uplift—high-AI teams nearly doubling PRs per engineer. Meanwhile, controlled 2024–2025 studies reveal 10–20% slowdowns on real-world tasks. At Typo, an engineering intelligence platform processing 15M+ pull requests across 1,000+ teams, we focus on measuring actual behavioral change in the SDLC—cycle time, PR quality, DevEx—not just tool usage.
This article synthesizes public research, real-world metrics, and concrete measurement practices so you can answer: “Is Copilot, Cursor, or Claude Code actually helping us?” With data, building on a broader view of AI-assisted coding impact, metrics, and best practices.
“We thought AI would be a slam dunk. Six months in, our Jira data told a different story than our engineers’ enthusiasm.” — VP of Engineering, Series C SaaS
Impact must be defined in concrete engineering terms, not vendor marketing. For the purposes of this article, AI coding tool impact refers to the measurable effects—positive or negative—that AI-powered development tools have on software delivery, code quality, developer experience, and organizational efficiency.
Three layers matter:
AI-influenced PRs are pull requests that contain AI-generated code or are opened by AI agents. This concept is more meaningful than license utilization, as it directly ties AI tool adoption to tangible changes in the SDLC. The relationship between AI tool adoption, code review practices, and code quality is critical: AI lowers the barrier to entry for less-experienced developers, but the developer’s role is shifting from writing code to reviewing, validating, and debugging AI-generated code. Teams with strong code review processes see quality improvements, while those without may experience a decline in quality.
Specific tools—GitHub Copilot, Cursor, Claude Code, Amazon Q—manifest differently across GitHub, GitLab, and Bitbucket workflows through code suggestions, AI-generated PR descriptions, and chat-driven refactors.
The concept of “AI-influenced PRs” (PRs containing AI generated code or opened by AI agents) matters more than license utilization. This ties directly to DORA’s 2024 evolution with its five key metrics, including deployment rework rate.
With this foundation, we can now explore what the data really says about the measurable impacts of AI coding tools.
AI coding tools promise measurable benefits, including faster development cycles, reduced time spent on repetitive tasks, and increased developer productivity. However, the data presents a nuanced picture.
The “rocket ship” findings are compelling: organizations with 75–100% AI adoption see engineers merging ~2.2 PRs weekly versus ~1.2 at low-adoption firms. Revert rates nudge only slightly from ~0.61% to ~0.65%.
But here’s the counterweight: a controlled 2024–2025 study with 16 experienced open-source maintainers working on 246 real issues using Cursor and Claude 3.5/3.7 Sonnet took 19% longer than those without AI—despite expecting a 24% speedup.
The perception gap is critical. Developers reported ~20% perceived speedup even when measured slowdown appeared. This matters enormously for budget decisions and vendor claims.
The methodological differences explain the conflict: benchmarks versus messy real issues, short-term experiments versus months of practice, individual tasks versus team-level throughput.
Transition: Understanding these measurable impacts and their limitations sets the stage for building a robust measurement framework. Next, we’ll break down the four key dimensions you must track to quantify AI coding tool impact in your organization.
Most companies over-index on seat usage and lines generated while under-measuring downstream effects. A proper framework covers four dimensions: Delivery Speed, Code Quality & Risk, Developer Experience, and Cost & Efficiency, ideally powered by AI-driven engineering intelligence for productivity.
Track these concrete metrics:
Real example: A mid-market SaaS team’s average PR cycle time dropped from 3.6 days to 2.5 days after rolling out Copilot paired with Typo’s automated AI code review across 40 engineers.
AI affects specific stages differently:
Segment PRs by “AI-influenced” versus “non-AI” to isolate whether speed gains come from AI-assisted work or process changes.
Measurable indicators include:
Research shows 48% of AI generated code harbors potential security vulnerabilities. Leaders care less about minor revert bumps than spikes in high-severity incidents or prolonged remediation times.
AI tools can improve quality (faster test generation, consistent patterns) and worsen it (subtle logic bugs, hidden security issues, copy-pasted vulnerabilities). Automated AI in the code review process with PR health scores catches risky patterns before production.
AI-generated code can introduce significant risks, including security vulnerabilities (e.g., 48% of AI-generated code harbors potential security vulnerabilities, and approximately 29% of AI-generated Python code contains potential weaknesses). The role of the developer is shifting from writing code to reviewing, validating, and debugging AI-generated code—akin to reviewing a junior developer’s pull request. Blindly accepting AI suggestions can lead to rapid accumulation of technical debt and decreased code quality.
To manage these risks, organizations must:
Transition: With code quality and risk addressed, the next dimension to consider is how AI coding tools affect developer experience and team behavior.
Impact isn’t only about speed. AI coding tools change how developers working on code feel—flow state, cognitive load, satisfaction, perceived autonomy.
Gartner’s 2025 research found organizations with strong DevEx are 31% more likely to improve delivery flow. Combine anonymous AI-chatbot surveys with behavioral data (time in review queues, context switching, after-hours work) to surface whether AI reduces friction or adds confusion, as explored in depth in developer productivity in the age of AI.
Sample survey questions:
Measurement must not rely on surveillance or keystroke tracking.
Transition: After understanding the impact on developer experience, it’s essential to evaluate the cost and ROI of AI coding tools to ensure sustainable investment.
The full cost picture includes:
Naive ROI views based on 28-day retention or acceptance rates mislead without tying to DORA metrics. A proper ROI model maps license cost per seat to actual AI-influenced PRs, quantifies saved engineer-hours from reduced cycle time, and factors in avoided incidents using rework rate and CFR.
Example scenario: A 200-engineer org comparing $300k/year in AI tool spend against 15% cycle time reduction and 30% fewer stuck PRs can calculate a clear payback period.
Transition: With these four dimensions in mind, let’s move on to how you can systematically measure and optimize AI coding tool impact in your organization.
Use existing workflows (GitHub/GitLab/Bitbucket, Jira/Linear, CI/CD) and an engineering intelligence platform rather than one-off spreadsheets. Measurement must cover near-term experiments (first 90 days) and long-term trends (12+ months) to capture learning curves and model upgrades.
Transition: With a measurement program in place, it’s crucial to address governance, code review, and safety nets to manage the risks of AI-generated code.
Higher throughput without governance accelerates technical debt and incident risk.
Define where AI is mandatory, allowed, or prohibited by code area. Policies should cover attribution, documentation standards, and manual validation expectations. Align with compliance and legal requirements for data privacy. Enterprise teams need clear boundaries for features like background agents and autonomous agents.
Traditional line-by-line review doesn’t scale when AI generates 300-line diffs in seconds. Modern approaches use AI-powered code review tools, LLM-powered review comments, PR health scores, security checks, and auto-suggested fixes. Adopt PR size limits and enforce test requirements. One customer reduced review time by ~30% while cutting critical quality assurance issues by ~40%.
Real risks include leaking proprietary code in prompts and reintroducing known CVEs. Technical controls: proxy AI traffic through approved gateways, redact secrets before sending prompts, use self hosted or enterprise plans with stronger access controls. Surface suspicious patterns like repeated changes to security-sensitive files.
Transition: Once governance and safety nets are established, organizations can move from basic usage dashboards to true engineering intelligence.
GitHub’s Copilot metrics (28-day retention, suggestion acceptance, usage by language) answer “Who is using Copilot?” They don’t answer “Are we shipping better software faster and safer?”
Example: A company built a Grafana-based Copilot dashboard but couldn’t explain flat cycle time to the CFO. After implementing proper engineering intelligence, they discovered review time had ballooned on AI-influenced PRs—and fixed it with new review rules.
Beyond vendor dashboards, trend these signals:
Summary Table: Main Measurable Impacts of AI Coding Tools
Benchmark against similar-sized engineering teams to see whether AI helps you beat the market or just keep pace.
Transition: To maximize sustainable performance, connect AI coding tool impact to DORA metrics and broader business outcomes.
Connect AI impact to DORA’s common language: deployment frequency, lead time, change failure rate, MTTR, deployment rework rate, using resources like a practical DORA metrics guide for AI-era teams.
AI can move each metric positively (faster implementation, more frequent releases) or negatively (rushed risky changes, slower incident diagnosis). The 2024–2025 DORA findings show AI adoption is strongest in organizations with solid existing practices—platform engineering is the #1 enabler of AI gains.
Data driven insights that tie AI adoption to DORA profile changes reveal whether you’re improving or generating noise. Concrete customer results: 30% reduction in PR time-to-merge, 20% more deployments.
Transition: With all these elements in place, let’s summarize a pragmatic playbook for engineering leaders to maximize AI coding tool impact.
AI coding tools like GitHub Copilot, Cursor, and Claude Code can be a rocket ship—but only with measured impact across delivery, quality, and DevEx, paired with strong governance and automated review.
Your checklist:
Whether you’re evaluating cursor fits for your team, considering multi model access capabilities, or scaling enterprise AI assistance, the principle holds: measure before you scale.
Typo connects in 60 seconds to your existing systems. Start a free trial or book a demo to see your AI coding tool impact quantified—not estimated.
GitHub Copilot ROI is top of mind in February 2026, and engineering leaders everywhere are asking the same question: is this tool actually worth it? Understanding Copilot ROI helps engineering leaders make informed investment decisions and optimize team productivity. ROI (Return on Investment) is a measure of the value gained relative to the cost incurred. The short answer is yes—if you measure beyond license usage and set it up intentionally. Most teams still only see 28-day adoption windows, not business impact.
The data shows real potential. GitHub’s 2023 controlled study found developers with Copilot completed coding tasks 55% faster (1h11m vs 2h41m). But GitClear’s analysis of millions of PRs revealed ~41% higher churn in AI-assisted code. Typo customers who combined Copilot with structured measurement saw different results: JemHR achieved 50% improvement in PR cycle time, and StackGen reduced PR review time by 30%.
This article is for VP/Directors of Engineering and EMs at SaaS companies with 20–500 developers already piloting Copilot, Cursor, or Claude Code. Here’s what we’ll cover:
Over 50,000 businesses and roughly one-third of the Fortune 500 now use GitHub Copilot. Yet most organizations only track seats purchased and monthly active users—metrics that tell you nothing about software delivery improvement.
Adoption patterns vary dramatically across teams:
This creates the “AI productivity paradox”: individual developer speed goes up, but org-level delivery metrics stay flat. Telemetry studies across 10,000+ developers confirm this pattern—faster individual coding, but modest or no change in lead time until teams rework their review and testing pipelines.
GitHub’s built-in Copilot metrics provide a 28-day window with per-seat usage and suggestion acceptance rates. But engineering leaders need trend lines over quarters, impact on PR flow, incident rates, and rework data. Typo connects to GitHub, GitLab, Bitbucket, Jira, and other core tools in ~60 seconds to unify this data without extra instrumentation using its full suite of engineering tool integrations.
Most dashboards answer “How many people use Copilot?” instead of “Is our SDLC (Software Development Life Cycle) healthier because of it?” This distinction matters because license utilization can look great while PR throughput and code quality degrade.
Developer experience metrics—satisfaction, cognitive load, burnout risk—are part of ROI, not “nice to have.” Satisfied developers perform better and stay longer. Many teams overlook that improved developer satisfaction directly affects retention costs, even though developer productivity in the age of AI is increasingly shaped by these factors.
Definition: AI-assisted work refers to code or pull requests (PRs) created with the help of tools like GitHub Copilot. AI-influenced PRs are pull requests where AI-generated code or suggestions have been incorporated.
The evidence base for AI-assisted development is now much stronger than in 2021–2022.
Typo’s dataset of 15M+ PRs across 1,000+ teams reveals a consistent pattern: teams that combine Copilot with disciplined PR practices see 20–30% reductions in PR cycle time and more deployments within 3–6 months. The key insight: Copilot has strong potential ROI, but only when measured within the SDLC, not just the IDE—exactly the gap Typo’s AI engineering intelligence platform is built to address.
This framework is designed for VP/Director-level implementation: baseline → track → survey → benchmark. Everything must be measurable with real data from GitHub, Jira, and CI/CD tools.
You can’t calculate ROI without “before” data—ideally 4–12 weeks of history. Capture these baseline metrics per team and repo:
These maps closely to DORA metrics for engineering leaders, so you can compare your Copilot impact to industry benchmarks.
Use structured DevEx questions and lightweight in-tool prompts from an AI-powered developer productivity platform rather than ad hoc surveys.
Example baseline: “Team Alpha: 2.5-day median PR cycle time, 15 deployments/month, 18% change failure rate in Q4 2025.”
You must distinguish AI-influenced PRs from non-AI PRs to get valid comparisons. Without this, you’re measuring noise.
Definition: AI-assisted work refers to code or pull requests (PRs) created with the help of tools like GitHub Copilot.
For remote and distributed teams, pairing tagging with AI-assisted code reviews for remote teams can make it easier to consistently flag AI-generated changes.
Treat Git events and work items as a single system of record by leaning on deep GitHub and Jira integration so that Copilot usage is always tied back to business outcomes.
Typo’s AI Impact Measurement pillar automatically correlates “AI-assisted” signals with PR outcomes—no Elasticsearch + Grafana setup required, and its broader AI-powered code review capabilities ensure risky changes are flagged early.
Treat this as a data-driven experiment, not a permanent commitment: 8–12 weeks, 1–3 pilot teams, clear hypotheses.
Example result: “Pilot Team Bravo reduced median PR cycle time from 30h to 20h over 10 weeks while AI-influenced PR share climbed from 0% to 45%.”
ROI Formula: ROI = (Value of Time Saved + Quality Gains + DevEx Improvements − Costs) ÷ Costs
Quality gains include fewer incidents, lower rework, and reduced churn. DevEx value covers reduced burnout risk and improved developer happiness tied to retention.
Anchor on a small, rigorous set of concrete metrics rather than dozens of vanity charts.
GitHub’s Copilot metrics (activation, acceptance, language breakdown) are useful input signals but must be correlated with these SDLC metrics to tell an ROI story. Typo surfaces all three buckets in a single dashboard, broken down by team, repo, and AI-adoption cohort.
40–60 engineers using Node.js/React with GitHub + Jira. After measuring baseline and implementing Copilot with Typo analytics, they achieved ~50% improvement in PR cycle time over 4 months. Deployment frequency increased ~30% with no increase in change failure rate.
15 engineers facing severe PR review bottlenecks. Copilot adoption plus Typo’s automated AI code review reduced PR review time by ~30%. Reviewers focused on architectural concerns while AI caught style issues and performed more thorough analysis of routine tasks.
120-engineer org runs a 12-week Copilot+Typo pilot with 3 teams. Pilot teams see 25% reduction in lead time, 20% more deployments, and 10–15% fewer production incidents. Financial impact: faster feature delivery yields estimated competitive advantage versus <$100K annual spend.
These outcomes only materialized where leaders treated Copilot as an experiment with measurement—not “flip the switch and hope.”
Poor measurement can make Copilot look useless—or magical—when reality is nuanced.
Typo’s dashboards are intentionally team- and cohort-focused to avoid surveillance concerns and encourage widespread adoption.
Typo is an engineering intelligence platform purpose-built to answer “Is our AI coding stack actually helping?” for GitHub Copilot, Cursor, and Claude Code, grounded in a mission to redefine engineering intelligence for modern software teams.
Typo’s automated AI code review layer complements Copilot by catching risky AI-generated code patterns before merge—reducing the churn that GitClear data warns about and leveraging AI-powered PR summaries for efficient reviews to keep feedback fast and focused. Connect Typo to your GitHub org and run a 30–60 day Copilot ROI experiment using prebuilt dashboards.
Copilot has real, measurable ROI—but only if you baseline, instrument, and analyze with the right productivity metrics.
Connect GitHub/Jira/CI to Typo and freeze your baseline. Capture quantitative metrics and run an initial DevEx survey for qualitative feedback.
Enable Copilot for 1–2 pilot programs, run enablement sessions, and start tagging AI-influenced work. Set realistic expectations with teams working on the pilot.
Monitor PR cycle time, lead time, and early quality signals. Identify optimization opportunities in existing workflows and development cycles.
Run a quick DevEx survey and produce a preliminary ROI snapshot for leadership using data driven insights.
Report Copilot ROI using DORA and DevEx language—lead time, change failure rate, developer satisfaction—not “lines of code” or “suggestions accepted.” This enables continuous improvement and seamless integration with your digital transformation initiatives.
Ready to see your actual Copilot impact quantified with real SDLC data? Start a free Typo trial or book a demo to measure your GitHub Copilot ROI in 60 seconds—not 60 days.
Engineering leaders evaluating LinearB alternatives in 2026 face a fundamentally different landscape than two years ago. The rise of AI coding tools like GitHub Copilot, Cursor, and Claude Code has transformed how engineering teams write and review code—yet most engineering analytics platforms haven’t kept pace with measuring what matters most: actual AI impact on delivery speed and code quality.
Note: LinearB should not be confused with Linear, which is a project management tool often used as a faster alternative to Jira.
This guide covers the top LinearB alternatives for VPs of Engineering, CTOs, and engineering managers at mid-market SaaS companies who need more than traditional DORA metrics. We focus specifically on platforms that address LinearB’s core gaps: native AI impact measurement, automated code review capabilities, and simplified setup processes. Enterprise-focused platforms requiring months of implementation fall outside our primary scope, though we include them for context.
The direct answer: The best LinearB alternatives combine SDLC visibility with AI impact measurement and AI powered code review capabilities that LinearB currently lacks. Platforms like Typo deliver automated code review on every pull request while tracking GitHub Copilot ROI with verified data—capabilities LinearB offers only partially.
By the end of this guide, you’ll understand:
Note: LinearB should not be confused with Linear, which is a project management tool often used as a faster alternative to Jira.
LinearB positions itself as a software engineering intelligence platform focused on SDLC visibility, workflow automation, and DORA metrics like deployment frequency, cycle time, and lead time. The platform integrates with Git repositories, CI/CD pipelines, and project management tools to expose bottlenecks in pull requests and delivery flows. For engineering teams seeking basic delivery analytics, LinearB delivers solid DORA metrics and PR workflow automation through GitStream.
However, LinearB’s architecture reflects an era before AI coding tools became central to the software development process. Three specific limitations now create friction for AI-native engineering teams.
LinearB tracks traditional engineering metrics effectively—deployment frequency, cycle time, change failure rate—but lacks native AI coding tool impact measurement. While LinearB has introduced dashboards showing Copilot and Cursor usage, the tracking remains surface-level: license adoption and broad cycle time correlations rather than granular attribution.
Recent analysis of LinearB’s own data reveals the problem clearly. A study of 8.1 million pull requests from 4,800 teams found AI-generated PRs wait 4.6x longer in review queues, with 10.83 issues per AI PR versus 6.45 for manual PRs. Acceptance rates dropped from 84.4% for human code to 32.7% for AI-assisted code. These findings suggest AI speed gains may be cancelled by verification costs—exactly the kind of insight teams need, but LinearB’s current metrics don’t capture this nuance.
For engineering leaders asking “What’s our GitHub Copilot ROI?” or “Is AI code increasing our delivery risks?”, LinearB provides estimates rather than verified engineering data connecting AI usage to business outcomes.
G2 reviews consistently highlight LinearB’s steep learning curve. Teams report multi-week onboarding processes for organizations with many repositories, complex CI/CD pipelines, or non-standard branching workflows. Historical data import challenges and dashboard configuration complexity add friction.
This contrasts sharply with modern alternatives offering 60-second setup. For mid-market SaaS companies without dedicated platform teams, weeks of configuration work represents real engineering effort diverted from product development.
LinearB introduced AI-powered code review features including auto-generated PR descriptions, context-aware suggestions, and reviewer assignment through GitStream. However, these capabilities complement workflow automation rather than replace deep code analysis.
Missing from LinearB’s offering: merge confidence scoring, scope drift detection (identifying when code changes solve the wrong problem), and context-aware reasoning that considers codebase history. For teams where AI-generated code comprises 30-40% of pull requests, this gap creates review bottlenecks that offset AI productivity gains.
Given LinearB’s gaps, what should engineering managers prioritize when evaluating alternatives? Three capability areas separate platforms built for 2026 from those designed for 2020.
Modern engineering intelligence platforms must track AI coding tool impact beyond license counts. Essential capabilities include:
This engineering data enables informed decisions about AI tool investments and identifies where human review processes need adjustment.
AI powered code review has evolved beyond syntax checking. Leading platforms now offer:
These capabilities address the verification bottleneck revealed in AI PR data—where faster writing means slower reviewing without intelligent automation.
Setup complexity directly impacts time to value. Modern alternatives provide:
The following analysis evaluates each platform against criteria most relevant for AI-native engineering teams: AI capabilities, setup speed, DORA metrics support, and pricing transparency.
Top alternatives to LinearB for software development analytics include Jellyfish, Swarmia, Waydev, and Allstacks.
1. Typo
Typo operates as an AI-native engineering management platform built specifically for teams using AI coding tools. The platform combines delivery analytics with automated code review on every pull request, using LLM-powered analysis to provide reasoning-based feedback rather than pattern matching.
Key differentiators include native GitHub Copilot ROI measurement with verified data, merge confidence scoring for delivery risk detection, and 60-second setup. Typo has processed 15M+ pull requests across 1,000+ engineering teams, earning G2 Leader status with 100+ reviews as an AI-driven engineering intelligence platform.
For teams where AI impact measurement and code review automation are primary requirements, Typo addresses LinearB’s core gaps directly.
2. Swarmia
Swarmia focuses on developer experience alongside delivery metrics, combining DORA metrics with DevEx surveys and team agreements, though several Swarmia alternatives offer broader AI-focused analytics. The platform emphasizes research-backed metrics rather than overwhelming teams with every possible measurement.
Strengths include clean dashboards, real-time Slack integrations, and faster setup (hours versus days). However, Swarmia provides limited AI impact tracking and no automated code review—teams still need separate tools for AI powered code review capabilities.
Best for: Teams prioritizing developer workflow optimization and team health measurement over AI-specific analytics, though some organizations will prefer a Swarmia alternative with deeper automation.
3. Jellyfish
Jellyfish serves enterprise organizations needing engineering visibility tied to business strategy, and there is now a growing ecosystem of Jellyfish alternatives for engineering leaders. The platform excels at resource allocation, capacity planning, R&D capitalization, and aligning engineering effort with business priorities.
The trade-off: Jellyfish requires significant implementation time—often 6-9 months to full ROI per published comparisons. Pricing reflects enterprise positioning with custom contracts typically exceeding $100,000 annually.
Best for: Large organizations needing financial data integration and executive-level strategic planning capabilities.
4. DX (getdx.com)
DX specializes in developer experience measurement using the DX Core 4 framework. The platform combines survey instruments with system metrics to understand morale, burnout, and workflow friction.
DX provides valuable insights into developer productivity factors but lacks delivery analytics, code review automation, or AI impact tracking. Teams typically use DX alongside other engineering analytics tools rather than as a standalone solution, especially when implementing broader developer experience (DX) improvement strategies.
Best for: Organizations with mature engineering operations seeking to improve team efficiency through DevEx insights.
5. Haystack
Haystack offers lightweight, Git-native engineering metrics with minimal configuration, sitting alongside a broader set of Waydev and similar alternatives in the engineering analytics space. The platform delivers DORA metrics, PR bottleneck identification, and sprint summaries without enterprise complexity.
Setup takes hours rather than weeks, making Haystack attractive for smaller teams wanting quick delivery performance visibility. However, the platform lacks AI code review features and provides basic AI impact tracking at best.
Best for: Smaller engineering teams needing fast delivery insights without comprehensive AI capabilities.
6. Waydev
Waydev provides Git analytics with individual developer insights and industry benchmarks and is frequently evaluated in lists of top LinearB alternative platforms. The platform tracks code contributions, PR patterns, and identifies skill gaps across engineering teams.
Critics note Waydev’s focus on individual metrics can create surveillance concerns. The platform offers limited workflow automation and no AI powered code review capabilities.
Best for: Organizations comfortable with individual contributor tracking and needing benchmark comparisons.
7. Allstacks
Allstacks positions itself as a value stream intelligence platform with predictive analytics and delivery forecasting, often compared against Intelligent LinearB alternatives like Typo. The platform helps teams identify bottlenecks across the value stream and predict delivery risks before they impact schedules.
Setup complexity and enterprise pricing limit Allstacks’ accessibility for mid-market teams. AI impact measurement remains basic.
Best for: Larger organizations needing predictive risk detection and value stream mapping across multiple products.
8. Pluralsight Flow
Pluralsight Flow combines engineering metrics with skill tracking and learning recommendations. The platform links identified skill gaps to Pluralsight’s training content, creating a development-to-learning feedback loop and is also frequently listed among Waydev competitor tools.
The integration with Pluralsight’s learning platform provides unique value for organizations invested in developer skill development. However, Flow provides no automated code review and limited AI impact tracking.
Best for: Organizations using Pluralsight for training who want integrated skill gap analysis, while teams focused on broader engineering performance may compare it with reasons companies choose Typo instead.
Challenge: Teams want to retain baseline engineering metrics covering previous quarters for trend analysis and comparison.
Solution: Choose platforms with API import capabilities and dedicated migration support. Typo’s architecture, having processed 15M+ pull requests across 2M+ repositories, demonstrates capability to handle historical data at scale. Request a migration timeline and data mapping documentation before committing. Most platforms can import GitHub/GitLab historical data directly, though Jira integration may require additional configuration.
Challenge: Engineering teams resist new tools, especially if previous implementations required significant configuration effort.
Solution: Prioritize platforms offering intuitive interfaces and dramatically faster setup. The difference between 60-second onboarding and multi-week implementation directly impacts adoption friction. Choose platforms that provide immediate team insights without requiring teams to build custom dashboards first.
Present the switch as addressing specific pain points (like “we can finally measure our Copilot ROI” or “automated code review on every PR”) rather than as generic tooling change.
Challenge: Engineering teams rely on specific GitHub/GitLab configurations, Jira workflows, and CI/CD pipelines that previous tools struggled to accommodate.
Solution: Verify one-click integrations with your specific toolchain before evaluation. Modern platforms should connect to existing tools without requiring workflow changes. Ask vendors specifically about your branching strategy, monorepo setup (if applicable), and any non-standard configurations.
LinearB delivered solid DORA metrics and workflow automation for its era, but lacks the native AI impact measurement and automated code review capabilities that AI-native engineering teams now require. The 4.6x longer review queue times for AI-generated PRs—revealed in LinearB’s own data—demonstrate why teams need platforms that address AI coding tool verification, not just adoption tracking.
Sign up now and you’ll be up and running on Typo in just minutes


