Software engineering teams are important assets for the organization. They build high-quality products, gather and analyze requirements, design system architecture and components, and write clean, efficient code. Measuring their success and identifying the potential challenges they may be facing is important. However, this isn’t always easy and takes a lot of time. Analytics tools help align engineering activities with business goals by providing visibility into team performance and supporting strategic decision-making.
And that’s how Engineering Analytics Tools comes to the rescue. These tools provide data driven insights that help improve engineering productivity by enabling leaders to make informed decisions and optimize team performance. One of the popular tools is Jellyfish which is widely used by engineering leaders and CTOs across the globe.
While this is usually the best choice for the organizations, there might be chances that it doesn’t work for you. Worry not! We’ve curated the top 6 Jellyfish alternatives that you can consider when choosing an engineering analytics tool for your company.
Jellyfish is a popular engineering management platform that offers real-time visibility into engineering organizations and team progress. It translates technical data into information that the business side can understand and offers multiple perspectives on resource allocation. It also shows the status of every pull request and commits on the team. Jellyfish can be integrated with third-party tools such as Bitbucket, Github, Gitlab, JIRA, and other popular HR, Calendar, and Roadmap tools.
Jellyfish supports engineering operations by providing high-level visibility and management tools that help optimize workflows and align technical efforts with organizational goals.
However, its UI can be tricky initially and has a steep learning curve due to the vast amount of data it provides, which can be overwhelming for new users.

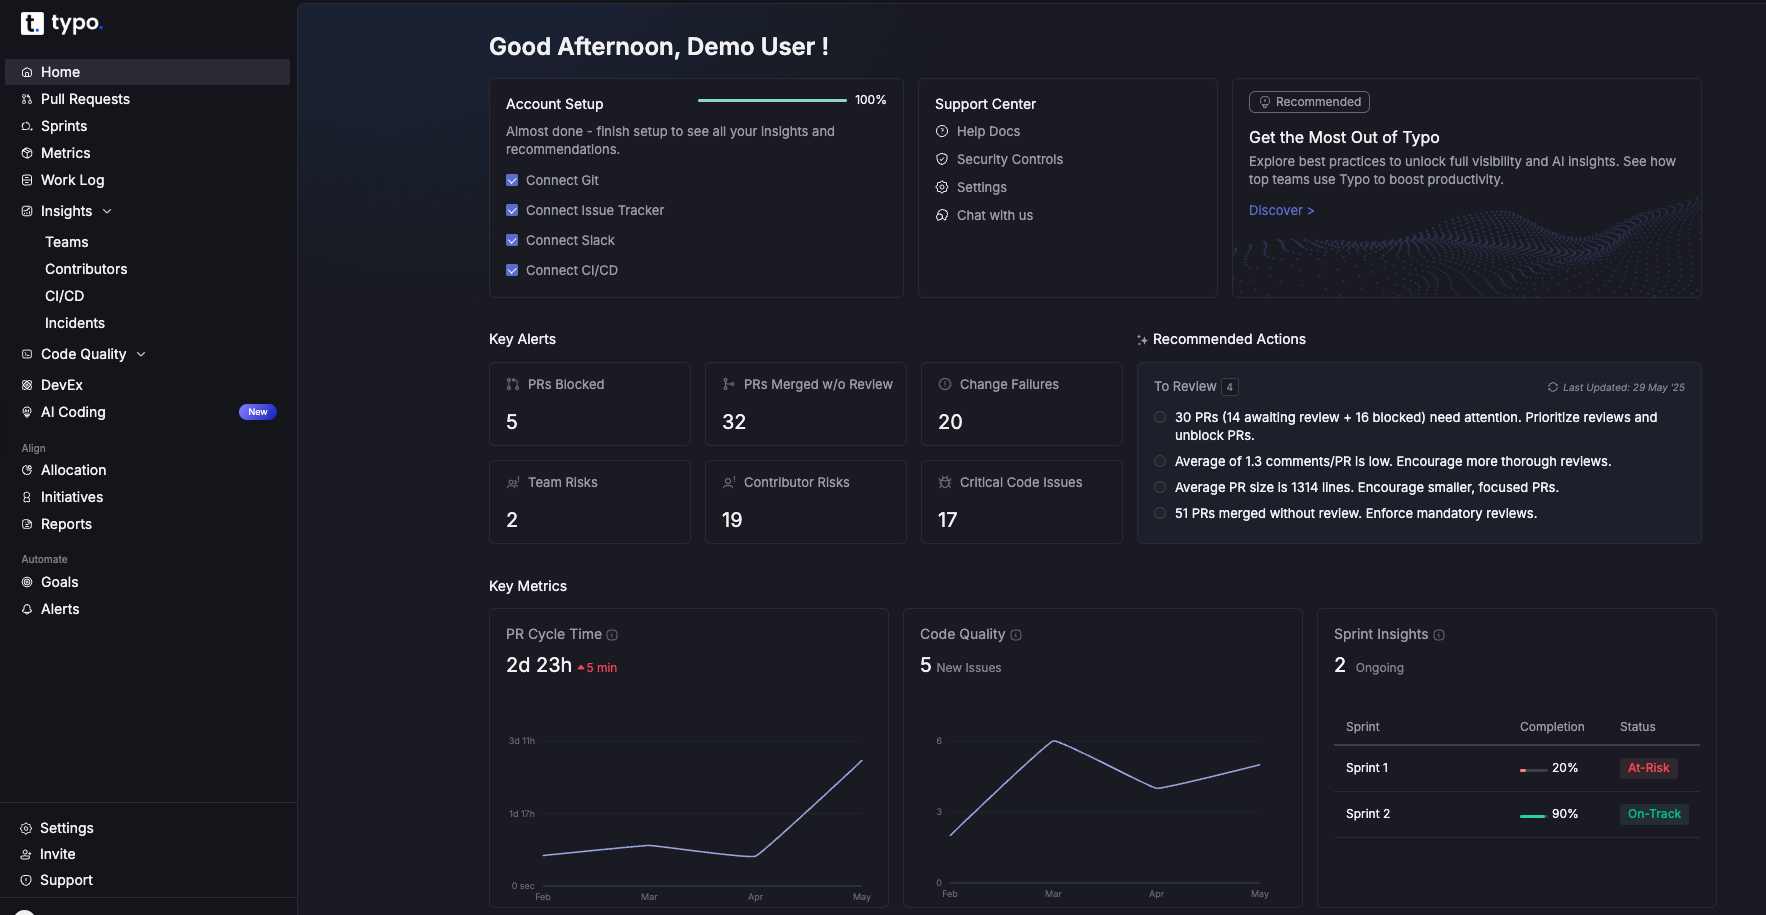
Typo is another Jellyfish alternative that maximizes the business value of software delivery by offering features that improve SDLC visibility, developer insights, and workflow automation. It provides comprehensive insights into the deployment process through key DORA and other engineering metrics and offers engineering benchmarks to compare the team’s results across industries. Typo also delivers detailed analytics, enabling better decision-making and risk management for software development teams. Its automated code tool helps development teams identify code issues and auto-fix them before merging to master. It captures a 360-degree view of developers’ experience and includes an effective sprint analysis that tracks and analyzes the team’s progress. Additionally, you can create custom reports to track key metrics, gain deeper insights, and improve processes. Typo can be integrated with tech tools such as GitHub, GitLab, Jira, Linear, and Jenkins, making it easy to benchmark and track progress while evaluating the team's performance.
LinearB is another leading software engineering intelligence platform that provides insights for identifying bottlenecks and streamlining software development workflow. It highlights automatable tasks to save time and enhance developer productivity. It also tracks DORA metrics and collects data from other tools to provide a holistic view of performance. Its project delivery tracker reflects project delivery status updates using planning accuracy and delivery reports. LinearB can be integrated with third-party applications such as Jira, Slack, and Shortcut.

Waydev is a software development analytics platform that provides actionable insights on metrics related to bug fixes, velocity, and more. It uses the agile method for tracking output during the development process and allows engineering leaders to see data from different perspectives. It emphasizes market-based metrics and ROI, unlike other platforms. Its resource planning assistance feature allows for avoiding scope creep and offers an understanding of the cost and progress of deliverables and key initiatives. Waydev can be integrated with well-known tools such as Gitlab, Github, CircleCI, and AzureOPS.

Pluralsight Flow is a popular tool that tracks DORA metrics and helps to benchmark DevOps practices, supporting software teams in achieving their goals. It aggregates GIT data into comprehensive insights and offers a bird-eye view of what’s happening in development teams. Its sprint feature helps to make better plans and dive into the team’s accomplished work and whether they are committed or unplanned. Its team-level ticket filters, GIT tags, and other lightweight signals streamline pulling data from different sources. Pluralsight Flow helps improve team collaboration by providing real-time analytics, tracking key metrics, and supporting distributed teams to enhance workflow and communication. Pluralsight Flow can be integrated with manual and automated testing tools such as Azure DevOps, and GitLab, helping to optimize software delivery processes.

Code Climate Velocity is a popular tool that uses repos to synthesize data and offers visibility into code coverage, coding practices, and security risks. It tracks issues in real time to help quickly move through existing workflows and allow engineering leaders to compile data on dev velocity and code quality. It has JIRA and GIT support that compresses into real-time analytics. Its customized dashboard and trends provide a view into each individual’s day-to-day tasks to long progress. Code Climate Velocity also provides technical debt assessment and style check in every pull request.

Swarmia is another well-known engineering effectiveness platform that provides quantitative insights into the software development pipeline. It offers visibility into three key areas: Business outcomes, developer productivity, and developer experience. It allows engineering leaders to create flexible and audit-ready software cost capitalization reports. It also identifies and fixes common teamwork antipatterns such as siloing and too much work in progress. Swarmia can be integrated with popular tools such as Slack, JIRA, Gitlab, Azure DevOps, and more.

Implementing a new engineering analytics tool—particularly when exploring alternatives to Jellyfish—fundamentally transforms how engineering teams operate, analyze performance, and optimize their development workflows. By automating data collection, analyzing development patterns, and predicting bottlenecks, these platforms enhance visibility, accuracy, and strategic decision-making across all engineering processes.
Let's explore how engineering analytics tools reshape development workflows and examine the critical factors that determine successful implementation.
Engineering management platforms comprise multiple integration points and analytical capabilities, each with specific objectives that ensure comprehensive visibility into development processes. Here's how these tools influence various aspects of engineering operations:
The foundation of any successful analytics implementation lies in seamless integration with existing development infrastructure.
This capability encompasses comprehensive metric visualization and analysis before implementing process improvements. This involves defining key performance indicators, setting measurement objectives, tracking DORA and SPACE metrics, and creating actionable reporting frameworks for the development process.
The third critical component involves generating real-time visibility into team dynamics, code quality, and engineering efforts. This encompasses creating detailed analytics of development processes based on live data streams, outlining performance components and how they interconnect.
The adoption of scalable analytics architecture has transformed how engineering organizations design and implement their measurement strategies. When combined with data-driven development approaches, scalable platforms offer unprecedented flexibility, adaptability, and operational resilience.
Implementation strategy aims to deploy analytics solutions that are efficient, comprehensive, and team-friendly. In this phase, planning transforms into functional monitoring capabilities—actual configuration takes place based on organizational specifications.
Establishing clear objectives serves as the foundation for successful analytics implementation and directly affects subsequent configuration steps.
Once implementation planning is complete, the entire configuration structure requires dedicated oversight and optimization. This ensures flawless platform operations before reaching end-users and identifies opportunities for enhancement.
The training phase involves educating teams on the optimized analytics platform capabilities. This stage serves as a gateway to ongoing usage activities like advanced reporting and custom dashboard creation.
The integration of feedback collection with ongoing platform refinement creates powerful synergy that enhances collaboration between teams while optimizing crucial measurement processes. Monitoring practices ensure continuous improvement, adaptation, and optimization, which complements the analytics capabilities throughout the development lifecycle.
By strategically planning implementation workflows and optimization strategies, engineering organizations achieve comprehensive visibility into development operations, enhance team performance analytics, and drive measurable business impact. The optimal engineering analytics platform empowers engineering leaders and managers to implement data-driven development processes, maximize team productivity insights, and ensure software development measurements consistently align with strategic organizational objectives.
While we have shared top software development analytics tools, don't forget to conduct thorough research before selecting for your engineering team. Check whether it aligns well with your requirements, facilitates team collaboration and continuous improvement, integrates seamlessly with your existing and upcoming tools, and so on.


Implement engineering metrics, gather SDLC insights & set continuous improvement goals in your dev teams.
Try Live Demo
We're on a mission to build engaged, productive tech teams. Try it out for free!


Follow us on:


