Software product metrics measure quality, performance, and user satisfaction, aligning with business goals to improve your software. This article explains essential metrics and their role in guiding development decisions.
Software product metrics are quantifiable measurements that assess various characteristics and performance aspects of software products. These metrics are designed to align with business goals, add user value, and ensure the proper functioning of the product. Tracking these critical metrics ensures your software meets quality standards, performs reliably, and fulfills user expectations. User Satisfaction metrics include Net Promoter Score (NPS), Customer Satisfaction Score (CSAT), and Customer Effort Score (CES), which provide valuable insights into user experiences and satisfaction levels. User Engagement metrics include Active Users, Session Duration, and Feature Usage, which help teams understand how users interact with the product. Additionally, understanding software metric product metrics in software is essential for continuous improvement.
Evaluating quality, performance, and effectiveness, software metrics guide development decisions and align with user needs. They provide insights that influence development strategies, leading to enhanced product quality and improved developer experience and productivity. These metrics help teams identify areas for improvement, assess project progress, and make informed decisions to enhance product quality.
Quality software metrics reduce maintenance efforts, enabling teams to focus on developing new features and enhancing user satisfaction. Comprehensive insights into software health help teams detect issues early and guide improvements, ultimately leading to better software. These metrics serve as a compass, guiding your development team towards creating a robust and user-friendly product.
Software quality metrics are essential quantitative indicators that evaluate the quality, performance, maintainability, and complexity of software products. These quantifiable measures enable teams to monitor progress, identify challenges, and adjust strategies in the software development process. Additionally, metrics in software engineering play a crucial role in enhancing overall software product’s quality.
By measuring various aspects such as functionality, reliability, and usability, quality metrics ensure that software systems meet user expectations and performance standards. The following subsections delve into specific key metrics that play a pivotal role in maintaining high code quality and software reliability.
Defect density is a crucial metric that helps identify problematic areas in the codebase by measuring the number of defects per a specified amount of code. Typically measured in terms of Lines of Code (LOC), a high defect density indicates potential maintenance challenges and higher defect risks. Pinpointing areas with high defect density allows development teams to focus on improving those sections, leading to a more stable and reliable software product and enhancing defect removal efficiency.
Understanding and reducing defect density is essential for maintaining high code quality. It provides a clear picture of the software’s health and helps teams prioritize bug fixes and software defects. Consistent monitoring allows teams to proactively address issues, enhancing the overall quality and user satisfaction of the software product.
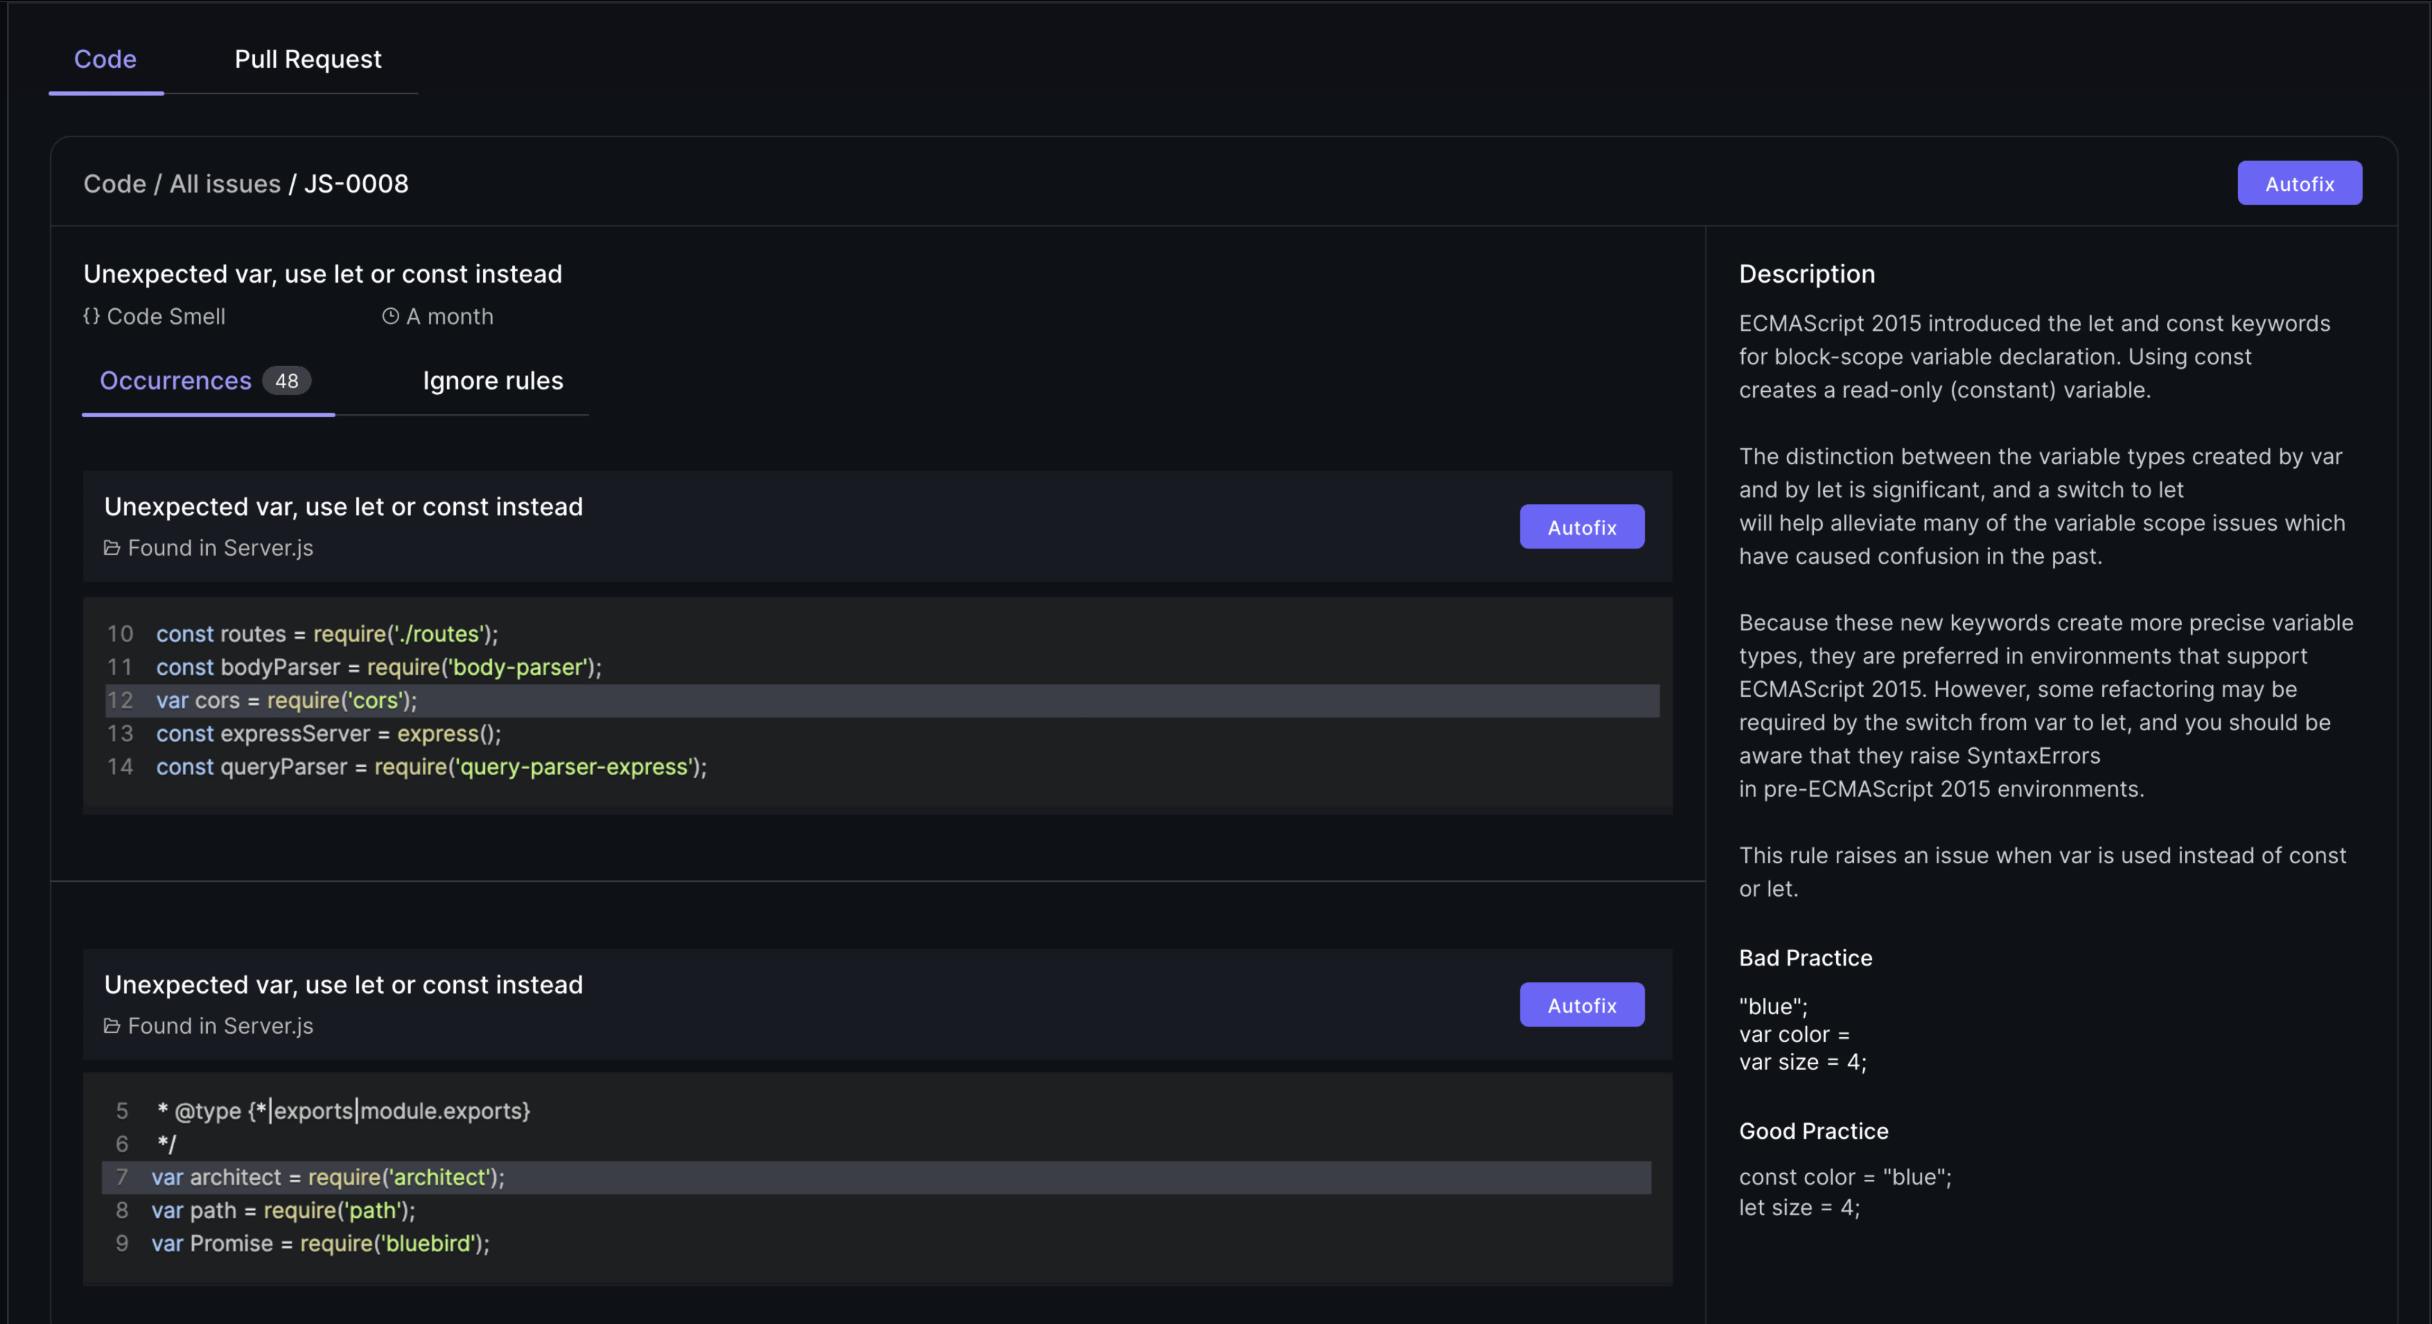
Code coverage is a metric that assesses the percentage of code executed during testing, ensuring adequate test coverage and identifying untested parts. Static analysis tools like SonarQube, ESLint, and Checkstyle play a crucial role in maintaining high code quality by enforcing consistent coding practices and detecting potential vulnerabilities before runtime. These tools are integral to the software development process, helping teams adhere to code quality standards and reduce the likelihood of defects.
Maintaining high code quality through comprehensive code coverage leads to fewer defects and improved code maintainability. Software quality management platforms that facilitate code coverage analysis include:
The Maintainability Index is a metric that provides insights into the software’s complexity, readability, and documentation, all of which influence how easily a software system can be modified or updated. Metrics such as cyclomatic complexity, which measures the number of linearly independent paths in code, are crucial for understanding the complexity of the software. High complexity typically suggests there may be maintenance challenges ahead. It also indicates a greater risk of defects.
Other metrics like the Length of Identifiers, which measures the average length of distinct identifiers in a program, and the Depth of Conditional Nesting, which measures the depth of nesting of if statements, also contribute to the Maintainability Index. These metrics help identify areas that may require refactoring or documentation improvements, ultimately enhancing the maintainability and longevity of the software product.
Performance and reliability metrics are vital for understanding the software’s ability to perform under various conditions over time. These metrics provide insights into the software’s stability, helping teams gauge how well the software maintains its operational functions without interruption. By implementing rigorous software testing and code review practices, teams can proactively identify and fix defects, thereby improving the software’s performance and reliability.
The following subsections explore specific essential metrics that are critical for assessing performance and reliability, including key performance indicators and test metrics.
Mean Time Between Failures (MTBF) is a key metric used to assess the reliability and stability of a system. It calculates the average time between failures, providing a clear indication of how often the system can be expected to fail. A higher MTBF indicates a more reliable system, as it means that failures occur less frequently.
Tracking MTBF helps teams understand the robustness of their software and identify potential areas for improvement. Analyzing this metric helps development teams implement strategies to enhance system reliability, ensuring consistent performance and meeting user expectations.
Mean Time to Repair (MTTR) reflects the average duration needed to resolve issues after system failures occur. This metric encompasses the total duration from system failure to restoration, including repair and testing times. A lower MTTR indicates that the system can be restored quickly, minimizing downtime and its impact on users. Additionally, Mean Time to Recovery (MTTR) is a critical metric for understanding how efficiently services can be restored after a failure, ensuring minimal disruption to users.
Understanding MTTR is crucial for evaluating the effectiveness of maintenance processes. It provides insights into how efficiently a development team can address and resolve issues, ultimately contributing to the overall reliability and user satisfaction of the software product.
Response time measures the duration taken by a system to react to user commands, which is crucial for user experience. A shorter response time indicates a more responsive system, enhancing user satisfaction and engagement. Measuring response time helps teams identify performance bottlenecks that may negatively affect user experience.
Ensuring a quick response time is essential for maintaining high user satisfaction and retention rates. Performance monitoring tools can provide detailed insights into response times, helping teams optimize their software to deliver a seamless and efficient user experience.
User engagement and satisfaction metrics are vital for assessing how users interact with a product and can significantly influence its success. These metrics provide critical insights into user behavior, preferences, and satisfaction levels, helping teams refine product features to enhance user engagement.
Tracking these metrics helps development teams identify areas for improvement and ensures the software meets user expectations. The following subsections explore specific metrics that are crucial for understanding user engagement and satisfaction.
Net Promoter Score (NPS) is a widely used gauge of customer loyalty, reflecting how likely customers are to recommend a product to others. It is calculated by subtracting the percentage of detractors from the percentage of promoters, providing a clear metric for customer loyalty. A higher NPS indicates that customers are more satisfied and likely to promote the product.
Tracking NPS helps teams understand customer satisfaction levels and identify areas for improvement. Focusing on increasing NPS helps development teams enhance user satisfaction and retention, leading to a more successful product.
The number of active users reflects the software’s ability to retain user interest and engagement over time. Tracking daily, weekly, and monthly active users helps gauge the ongoing interest and engagement levels with the software. A higher number of active users indicates that the software is effectively meeting user needs and expectations.
Understanding and tracking active users is crucial for improving user retention strategies. Analyzing user engagement data helps teams enhance software features and ensure the product continues to deliver value.
Tracking how frequently specific features are utilized can inform development priorities based on user needs and feedback. Analyzing feature usage reveals which features are most valued and frequently utilized by users, guiding targeted enhancements and prioritization of development resources.
Monitoring specific feature usage helps development teams gain insights into user preferences and behavior. This information helps identify areas for improvement and ensures that the software evolves in line with user expectations and demands.
Financial metrics are essential for understanding the economic impact of software products and guiding business decisions effectively. These metrics help organizations evaluate the economic benefits and viability of their software products. Tracking financial metrics helps development teams make informed decisions that contribute to the financial health and sustainability of the software product. Tracking metrics such as MRR helps Agile teams understand their product's financial health and growth trajectory.
The following subsections explore specific financial metrics that are crucial for evaluating software development.
Customer Acquisition Cost (CAC) represents the total cost of acquiring a new customer, including marketing expenses and sales team salaries. It is calculated by dividing total sales and marketing costs by the number of new customers acquired. A high customer acquisition costs (CAC) shows that targeted marketing strategies are necessary. It also suggests that enhancements to the product’s value proposition may be needed.
Understanding CAC is crucial for optimizing marketing efforts and ensuring that the cost of acquiring new customers is sustainable. Reducing CAC helps organizations improve overall profitability and ensure the long-term success of their software products.
Customer lifetime value (CLV) quantifies the total revenue generated from a customer. This measurement accounts for the entire duration of their relationship with the product. It is calculated by multiplying the average purchase value by the purchase frequency and lifespan. A healthy ratio of CLV to CAC indicates long-term value and sustainable revenue.
Tracking CLV helps organizations assess the long-term value of customer relationships and make informed business decisions. Focusing on increasing CLV helps development teams enhance customer satisfaction and retention, contributing to the financial health of the software product.
Monthly recurring revenue (MRR) is predictable revenue from subscription services generated monthly. It is calculated by multiplying the total number of paying customers by the average revenue per customer. MRR serves as a key indicator of financial health, representing consistent monthly revenue from subscription-based services.
Tracking MRR allows businesses to forecast growth and make informed financial decisions. A steady or increasing MRR indicates a healthy subscription-based business, while fluctuations may signal the need for adjustments in pricing or service offerings.
Selecting the right metrics for your project is crucial for ensuring that you focus on the most relevant aspects of your software development process. A systematic approach helps identify the most appropriate product metrics that can guide your development strategies and improve the overall quality of your software. Activation rate tracks the percentage of users who complete a specific set of actions consistent with experiencing a product's core value, making it a valuable metric for understanding user engagement.
The following subsections provide insights into key considerations for choosing the right metrics.
Metrics selected should directly support the overarching goals of the business to ensure actionable insights. By aligning metrics with business objectives, teams can make informed decisions that drive business growth and improve customer satisfaction. For example, if your business aims to enhance user engagement, tracking metrics like active users and feature usage will provide valuable insights.
A data-driven approach ensures that the metrics you track provide objective data that can guide your marketing strategy, product development, and overall business operations. Product managers play a crucial role in selecting metrics that align with business goals, ensuring that the development team stays focused on delivering value to users and stakeholders.
Clear differentiation between vanity metrics and actionable metrics is essential for effective decision-making. Vanity metrics may look impressive but do not provide insights or drive improvements. In contrast, actionable metrics inform decisions and strategies to enhance software quality. Vanity Metrics should be avoided; instead, focus on actionable metrics tied to business outcomes to ensure meaningful progress and alignment with organizational goals.
Using the right metrics fosters a culture of accountability and continuous improvement within agile teams. By focusing on actionable metrics, development teams can track progress, identify areas for improvement, and implement changes that lead to better software products. This balance is crucial for maintaining a metrics focus that drives real value.
As a product develops, the focus should shift to metrics that reflect user engagement and retention in line with our development efforts. Early in the product lifecycle, metrics like user acquisition and activation rates are crucial for understanding initial user interest and onboarding success.
As the product matures, metrics related to user satisfaction, feature usage, and retention become more critical. Metrics should evolve to reflect the changing priorities and challenges at each stage of the product lifecycle.
Continuous tracking and adjustment of metrics ensure that development teams remain focused on the most relevant aspects of project management in the software, leading to sustained tracking product metrics success.
Having the right tools for tracking and visualizing metrics is essential for automatically collecting raw data and providing real-time insights. These tools act as diagnostics for maintaining system performance and making informed decisions.
The following subsections explore various tools that can help track software metrics and visualize process metrics and software metrics effectively.
Static analysis tools analyze code without executing it, allowing developers to identify potential bugs and vulnerabilities early in the development process. These tools help improve code quality and maintainability by providing insights into code structure, potential errors, and security vulnerabilities. Popular static analysis tools include Typo, SonarQube, which provides comprehensive code metrics, and ESLint, which detects problematic patterns in JavaScript code.
Using static analysis tools helps development teams enforce consistent coding practices and detect issues early, ensuring high code quality and reducing the likelihood of software failures.
Dynamic analysis tools execute code to find runtime errors, significantly improving software quality. Examples of dynamic analysis tools include Valgrind and Google AddressSanitizer. These tools help identify issues that may not be apparent in static analysis, such as memory leaks, buffer overflows, and other runtime errors.
Incorporating dynamic analysis tools into the software engineering development process helps ensure reliable software performance in real-world conditions, enhancing user satisfaction and reducing the risk of defects.
Performance monitoring tools track performance, availability, and resource usage. Examples include:
Insights from performance monitoring tools help identify performance bottlenecks and ensure adherence to SLAs. By using these tools, development teams can optimize system performance, maintain high user engagement, and ensure the software meets user expectations, providing meaningful insights.
AI coding assistants do accelerate code creation, but they also introduce variability in style, complexity, and maintainability. The bottleneck has shifted from writing code to understanding, reviewing, and validating it.
Effective AI-era code reviews require three things:
AI coding reviews are not “faster reviews.” They are smarter, risk-aligned reviews that help teams maintain quality without slowing down the flow of work.
Understanding and utilizing software product metrics is crucial for the success of any software development project. These metrics provide valuable insights into various aspects of the software, from code quality to user satisfaction. By tracking and analyzing these metrics, development teams can make informed decisions, enhance product quality, and ensure alignment with business objectives.
Incorporating the right metrics and using appropriate tools for tracking and visualization can significantly improve the software development process. By focusing on actionable metrics, aligning them with business goals, and evolving them throughout the product lifecycle, teams can create robust, user-friendly, and financially successful software products. Using tools to automatically collect data and create dashboards is essential for tracking and visualizing product metrics effectively, enabling real-time insights and informed decision-making. Embrace the power of software product metrics to drive continuous improvement and achieve long-term success.
Software product metrics are quantifiable measurements that evaluate the performance and characteristics of software products, aligning with business goals while adding value for users. They play a crucial role in ensuring the software functions effectively.
Defect density is crucial in software development as it highlights problematic areas within the code by quantifying defects per unit of code. This measurement enables teams to prioritize improvements, ultimately reducing maintenance challenges and mitigating defect risks.
Code coverage significantly enhances software quality by ensuring that a high percentage of the code is tested, which helps identify untested areas and reduces defects. This thorough testing ultimately leads to improved code maintainability and reliability.
Tracking active users is crucial as it measures ongoing interest and engagement, allowing you to refine user retention strategies effectively. This insight helps ensure the software remains relevant and valuable to its users. A low user retention rate might suggest a need to improve the onboarding experience or add new features.
AI coding reviews enhance the software development process by optimizing coding speed and maintaining high code quality, which reduces human error and streamlines workflows. This leads to improved efficiency and the ability to quickly identify and address bottlenecks.


Implement engineering metrics, gather SDLC insights & set continuous improvement goals in your dev teams.
Try Live Demo
We're on a mission to build engaged, productive tech teams. Try it out for free!


Follow us on:


